The Bogoslof volcano in Alaska’s Aleutian Islands erupted around 2216 UTC on 29 May 2017. A comparison of Himawari-8 Visible (0.64 µm) and Infrared Window (10.4 µm) images (above; MP4) showed the volcanic cloud as it drifted north/northeastward.A very oblique view of the volcanic cloud was captured by Korean COMS-1 satellite... Read More
![Himawari-8 Visible (0.64 µm, left) and Infrared Window (10.4 µm, right) images, with hourly surface and ship reports plotted in yellow [click to play animation]](https://cimss.ssec.wisc.edu/satellite-blog/wp-content/uploads/sites/5/2017/05/960x640_AHIM08_B313_HIM08_VIS_IR_BOGOSLOF_28MAY2017_2017148_225000_0002PANELS.GIF)
Himawari-8 Visible (0.64 µm, left) and Infrared Window (10.4 µm, right) images, with hourly surface and ship reports plotted in yellow [click to play animation]
The Bogoslof volcano in Alaska’s Aleutian Islands erupted around
2216 UTC on 29 May 2017. A comparison of Himawari-8 Visible (0.64 µm) and Infrared Window (10.4 µm) images
(above; MP4) showed the volcanic cloud as it drifted north/northeastward.
A very oblique view of the volcanic cloud was captured by Korean COMS-1 satellite at 2315 UTC (below).
![COMS-1 Visible (0.67 µm) images, with surface observations plotted in yellow [click to enlarge]](https://cimss.ssec.wisc.edu/satellite-blog/wp-content/uploads/sites/5/2017/05/170528_2315UTC_COMS1_VISIBLE_BOGOSLOF.GIF)
COMS-1 Visible (0.67 µm) images, with surface observations plotted in yellow [click to enlarge]
Himawaari-8 false-color images from the
NOAA/CIMSS Volcanic Cloud Monitoring site
(below) revealed the initial signature of a volcanic cloud — however, this signature became less distinct after about 02 UTC on 29 May.
![Himawari-8 false-color RGB images [click to play animation]](https://cimss.ssec.wisc.edu/satellite-blog/wp-content/uploads/sites/5/2017/05/HIMAWARI-8.AHI.2017-05-28_22-50-00.RGB1112or13um_3911um_11um.Aleutians_East_1_km.png)
Himawari-8 false-color RGB images [click to play animation]
A different type of Himawari-8 false-color imagery
(below) makes use of the 8.5 µm spectral band, which can help to infer the presence of sulfur dioxide within a volcanic cloud feature. A similar
8.4 µm band is available from the
ABI instrument on the
GOES-R series of satellites.
![Himawari-8 false-color images [click to play animation]](https://cimss.ssec.wisc.edu/satellite-blog/wp-content/uploads/sites/5/2017/05/HIMAWARI-8.AHI.2017-05-28_22-50-00.RGB1112um_8511um_11um.Aleutians_East_1_km.png)
3Himawari-8 false-color images [click to play animation]
A blend of Himawari-8 Infrared Window (10.4 µm) and radiometrically-retrieved Ash Cloud Height is shown below; the maximum ash cloud height was generally in the 10-12 km (33,000-39,000 feet above sea level) range
(dark blue color enhancement). A volcanic ash signal was no longer apparent after 2320 UTC — this was likely due to enhanced ash particle removal via water (both liquid and ice) related processes.
![Himawari-8 Infrared Window (10.4 µm) images and Ash Cloud Height retrievals [click to play animation]](https://cimss.ssec.wisc.edu/satellite-blog/wp-content/uploads/sites/5/2017/05/HIMAWARI-8.AHI.2017-05-28_22-40-00.Ash_Height.Aleutians_East_1_km.png)
Himawari-8 Infrared Window (10.4 µm) images and Ash Cloud Height retrievals [click to play animation]
A DigitalGlobe WorldView image at 2234 UTC (below) provided remarkable detail of the Bogoslof volcanic cloud shortly after the eruption began.
View only this post
Read Less
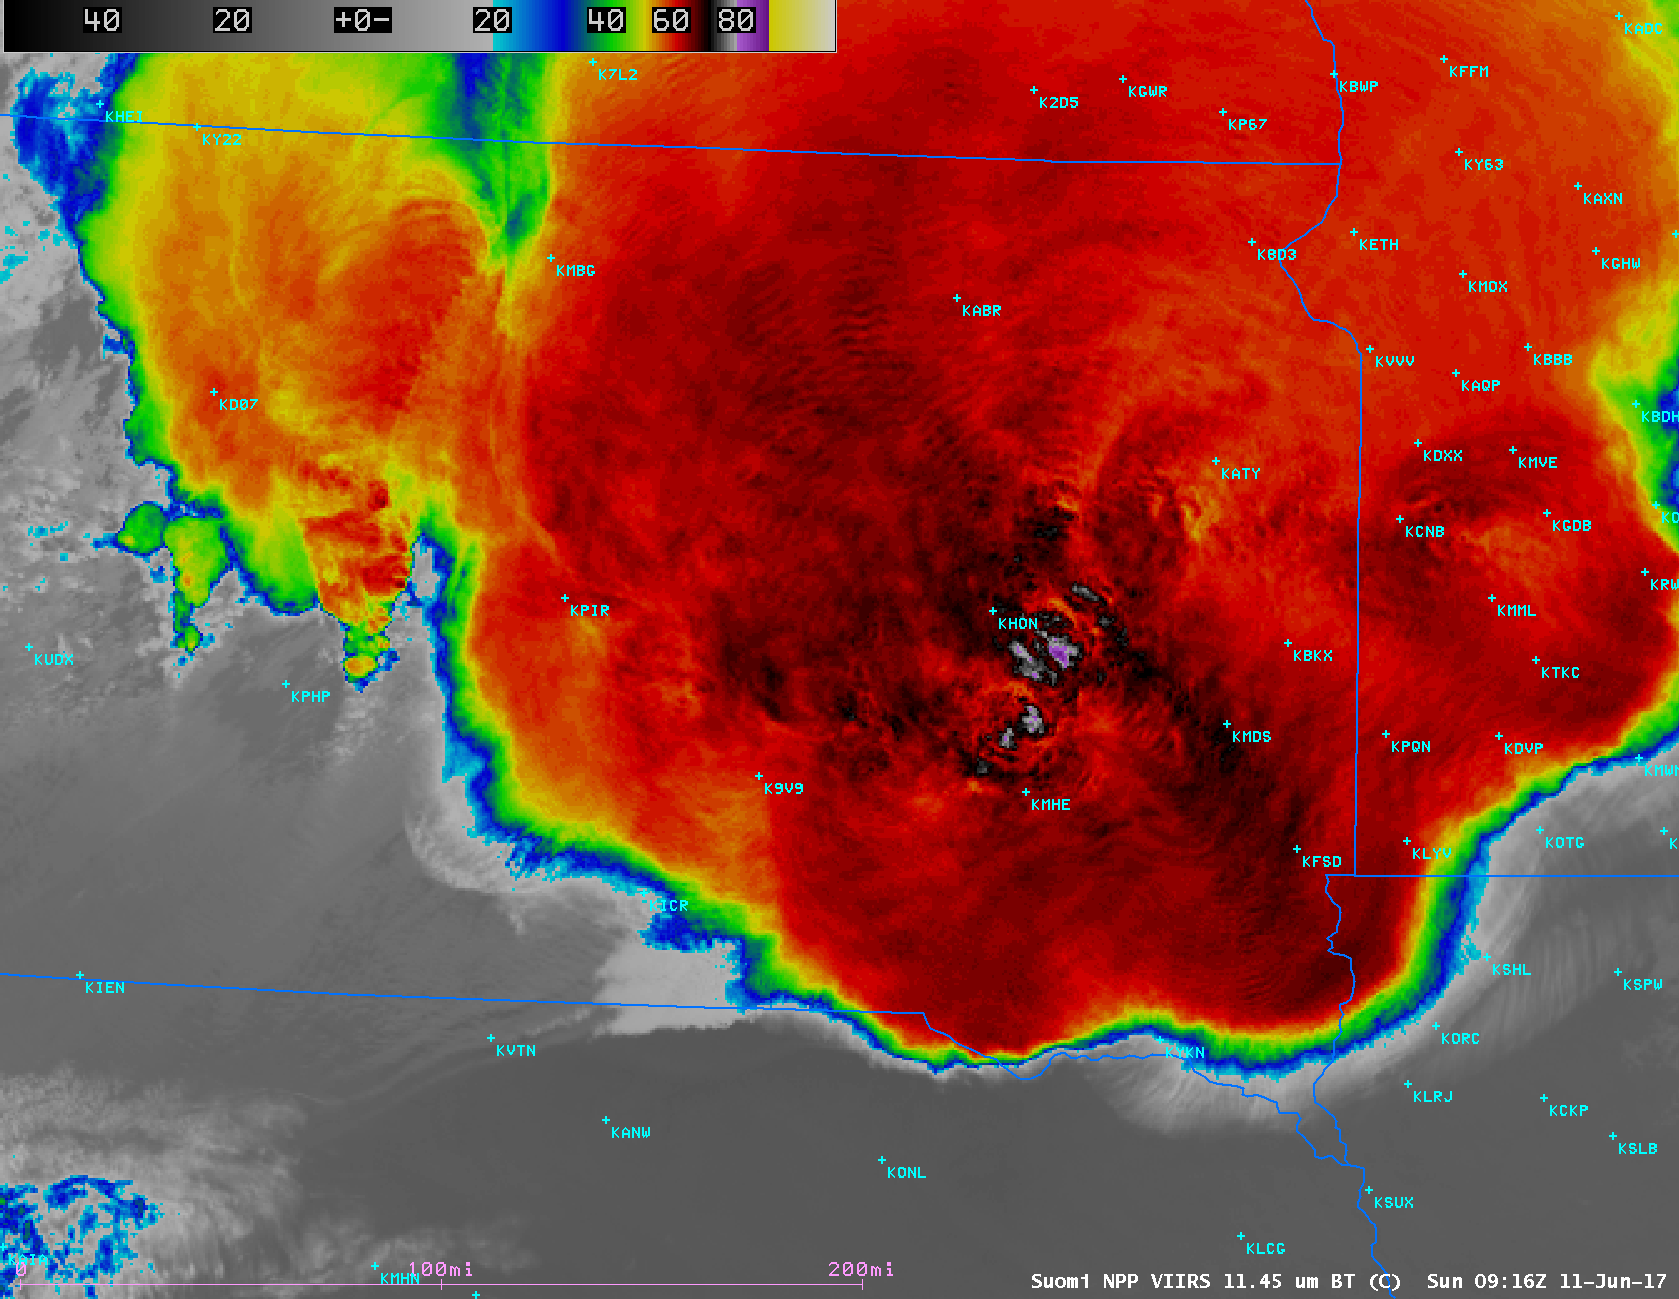
![Suomi NPP VIIRS Day/Night Band (0.7 µm) and Infrared Window (11.45 µm) images, with SPC storm reports of hail and wind damage [click to enlarge]](https://cimss.ssec.wisc.edu/satellite-blog/wp-content/uploads/sites/5/2017/06/170611_0734utc_suomi_npp_viirs_dnb_infrared_SD_mcs_anim.gif)
![Suomi NPP VIIRS Day/Night Band (0.7 µm) and Infrared Window (11.45 µm) images, with SPC storm reports of hail and wind damage [click to enlarge]](https://cimss.ssec.wisc.edu/satellite-blog/wp-content/uploads/sites/5/2017/06/170611_0916utc_suomi_npp_viirs_dnb_infrared_SD_mcs_anim.gif)
![GOES-16 Visible (0.64 µm, top) and Infrared Window (10.3 µm, bottom), with SPC storm reports of hail and wind plotted in yellow [click to play animation]](https://cimss.ssec.wisc.edu/satellite-blog/wp-content/uploads/sites/5/2017/06/170611_goes16_visible_infrared_spc_storm_reports_MN_WI_anim.gif)
![GOES-16 Water Vapor (6.2 µm, top; 6.9 µm, middle; 7.3 µm, bottom) images [click to play animation]](https://cimss.ssec.wisc.edu/satellite-blog/wp-content/uploads/sites/5/2017/06/170607_goes16_water_vapor_Great_Lakes_shear_vortices_anim.gif)
![GOES-16 Water Vapor (6.9 µm) images [click to play animation]](https://cimss.ssec.wisc.edu/satellite-blog/wp-content/uploads/sites/5/2017/06/170607_goes16_water_vapor_Great_Lakes_shear_vortices_pireps_anim.gif)
![GOES-13 Mid-Level Wind Shear product [click to enlarge]](https://cimss.ssec.wisc.edu/satellite-blog/wp-content/uploads/sites/5/2017/06/170607_Mid_Level_Wind_Shear_anim.gif)
![Meteosat-10 Visible (0.8 µm, left) and Infrared Window (10.8 µm, right) images [click to play animation]](https://cimss.ssec.wisc.edu/satellite-blog/wp-content/uploads/sites/5/2017/05/170529_meteosat10_visible_infrared_Moscow_anim.gif)
![Meteosat-10 Water Vapor (6.25 µm) images [click to play animation]](https://cimss.ssec.wisc.edu/satellite-blog/wp-content/uploads/sites/5/2017/05/170529_meteosat10_water_vapor_Moscow_anim.gif)
![Time series of surface observations at Sheremetyevo International Airport UUEE [click to enlarge]](https://cimss.ssec.wisc.edu/satellite-blog/wp-content/uploads/sites/5/2017/05/170529_UUEE_SFCMG.GIF)
![Time series of surface observations at Vnukovo International Airport UUWW [click to enlarge]](https://cimss.ssec.wisc.edu/satellite-blog/wp-content/uploads/sites/5/2017/05/170529_UUWW_SFCMG.GIF)
![Time series of surface observations at Domodedovo International Airport UUDD [click to enlarge]](https://cimss.ssec.wisc.edu/satellite-blog/wp-content/uploads/sites/5/2017/05/170529_UUDD_SFCMG.GIF)
![Himawari-8 Visible (0.64 µm, left) and Infrared Window (10.4 µm, right) images, with hourly surface and ship reports plotted in yellow [click to play animation]](https://cimss.ssec.wisc.edu/satellite-blog/wp-content/uploads/sites/5/2017/05/170528_himawari8_visible_infrared_Bogoslof_AK_anim.gif)
![Himawari-8 false-color RGB images [click to play animation]](https://cimss.ssec.wisc.edu/satellite-blog/wp-content/uploads/sites/5/2017/05/170528_himawari8_Bogoslof_rgb_1_anim.gif)
![Himawari-8 false-color images [click to play animation]](https://cimss.ssec.wisc.edu/satellite-blog/wp-content/uploads/sites/5/2017/05/170528_himawari8_Bogoslof_rgb_2_anim.gif)
![Himawari-8 Infrared Window (10.4 µm) images and Ash Cloud Height retrievals [click to play animation]](https://cimss.ssec.wisc.edu/satellite-blog/wp-content/uploads/sites/5/2017/05/170528_himawari8_Bogoslof_ash_height_anim.gif)
