GOES-16 ABI Band 2 Visible (0.64 µm) Imagery, 1127 – 1324 UTC on 5 October 2017 (Click to animate)
GOES-16 Visible Imagery, above, shows convection (imagery at 1-minute intervals) surrounding Tropical Storm Nate, just onshore in northeastern Nicaragua.
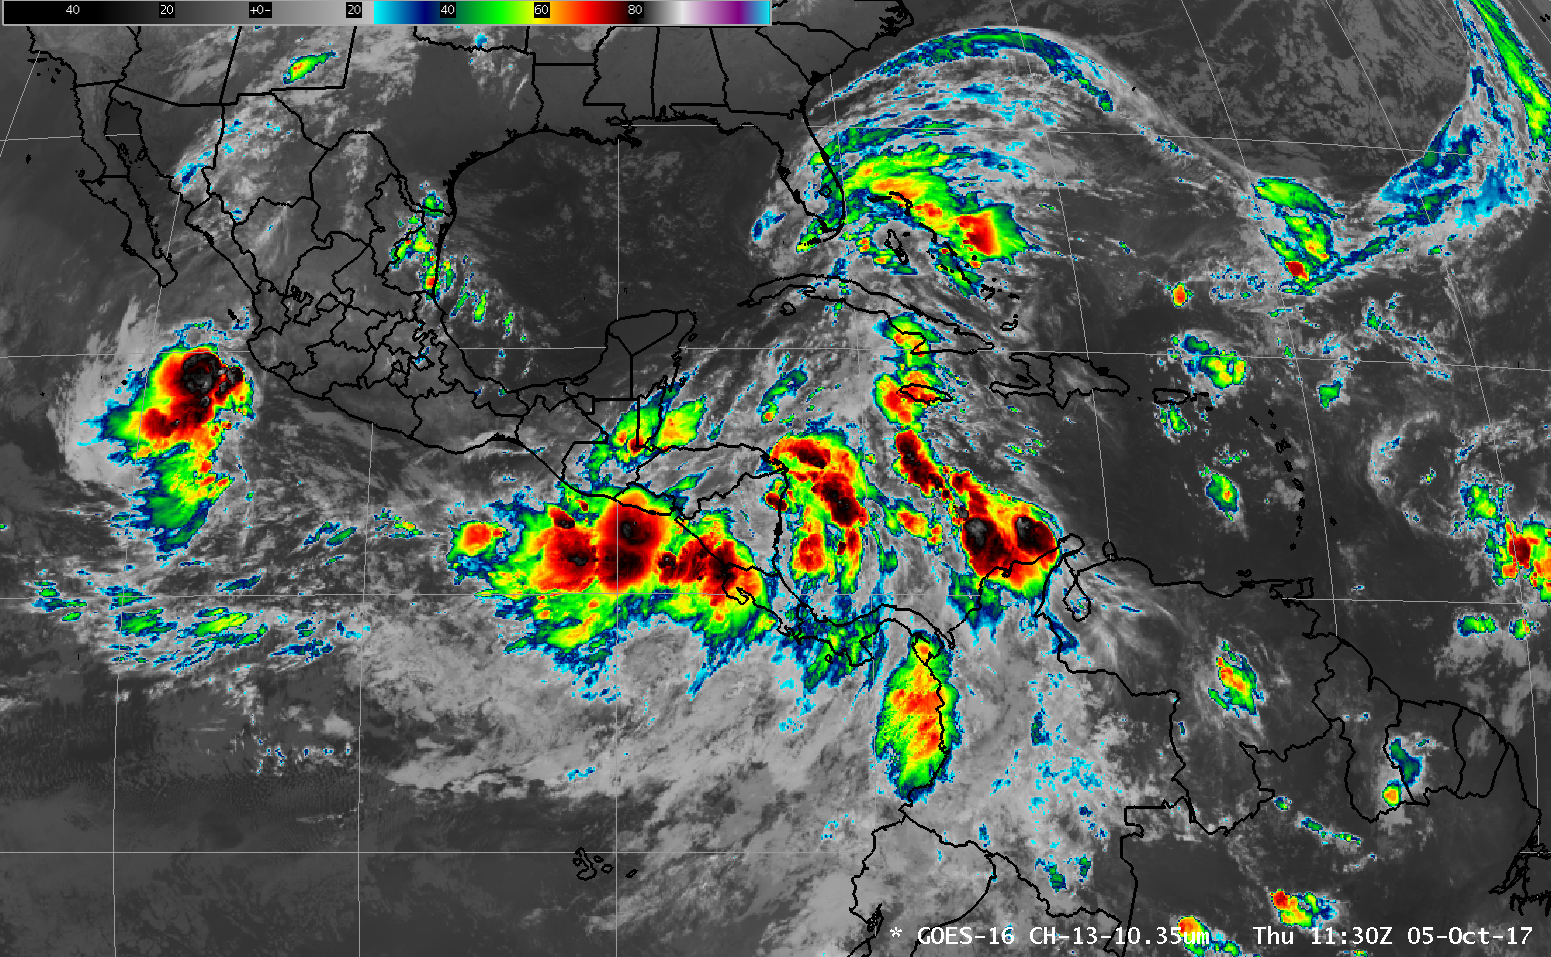
GOES-16 ABI “Clean Window” Infrared (10.3 µm) Imagery, 4 October 2017 at 2300 UTC through 1130 UTC on 5 October 2017 (Click to animate)
GOES-16 data posted on this page are preliminary, non-operational and are undergoing testing
The Tropical Depression (#16) in the western Caribbean Sea has strengthened to become a minimal Tropical Storm, acquiring the name Nate. The animation from GOES-16, above, shows disorganized convection over the entire basin, stretching into the Pacific Ocean south of central America. (The sheared remains of Pacific Tropical Storm Ramon are also present south of Mexico). The animation below, from 0000-1300 UTC on 5 October 2017, shows the mid-level Water Vapor Infrared Imagery (6.95 µm) from GOES-16. Convection develops over the center of Nate, over Nicaragua, at the end of the animation.
GOES-16 ABI “Mid-Level Water Vapor” Infrared (6.95 µm) Imagery, 0000-1300 UTC on 5 October 2017 (Click to animate)
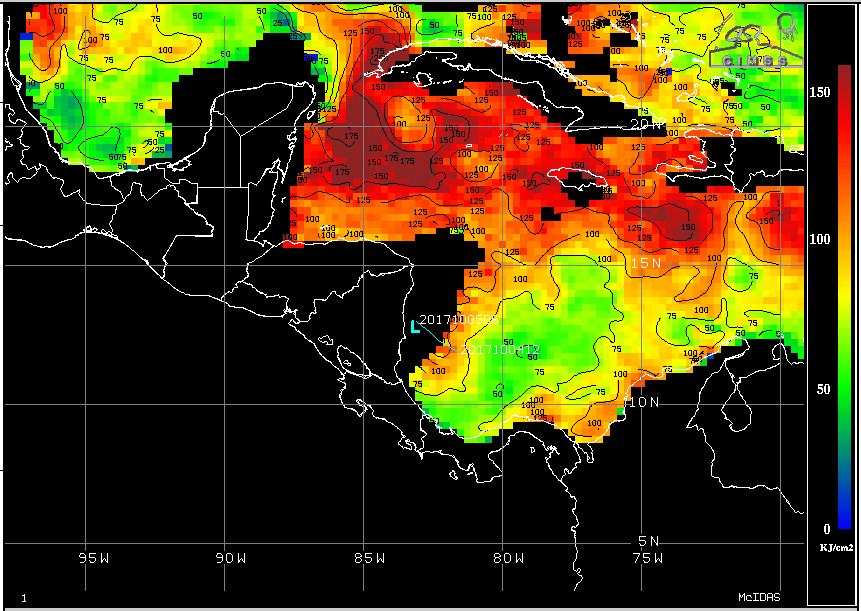
Microwave Imagery, below, from SSMI/S at around 1000 UTC on 5 October, (from this site) suggests that Nate is centered very near the coast of Nicaragua. Nate is forecast to move north into the Gulf of Mexico; its path through the northwest Caribbean suggests strengthening is possible if Nate remains far enough from land. Very warm water is present in the northwest Caribbean; that warmth extends to great depth as shown by this plot of Oceanic Heat Content; that warmth extends into the central Gulf of Mexico.
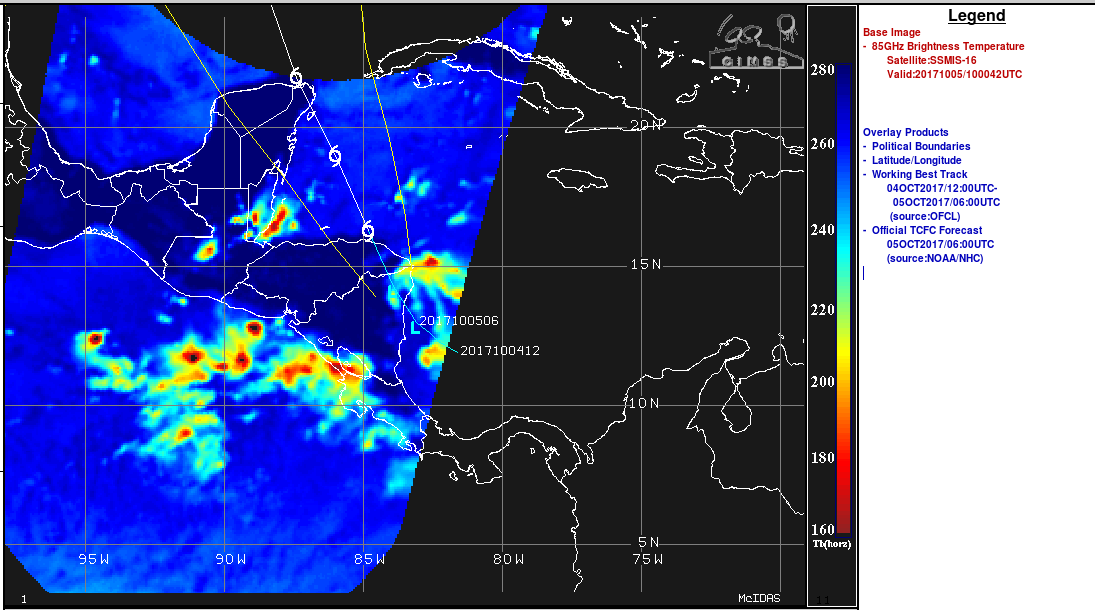
85 GHz Brightness Temperatures, 1000 UTC on 5 October 2017 (Click to enlarge)
Nate formed at a time when the Moon was Full. Thus, Suomi NPP Day Night Band Visible Imagery showed excellent illumination. The image below is from 0627 UTC on 5 October.
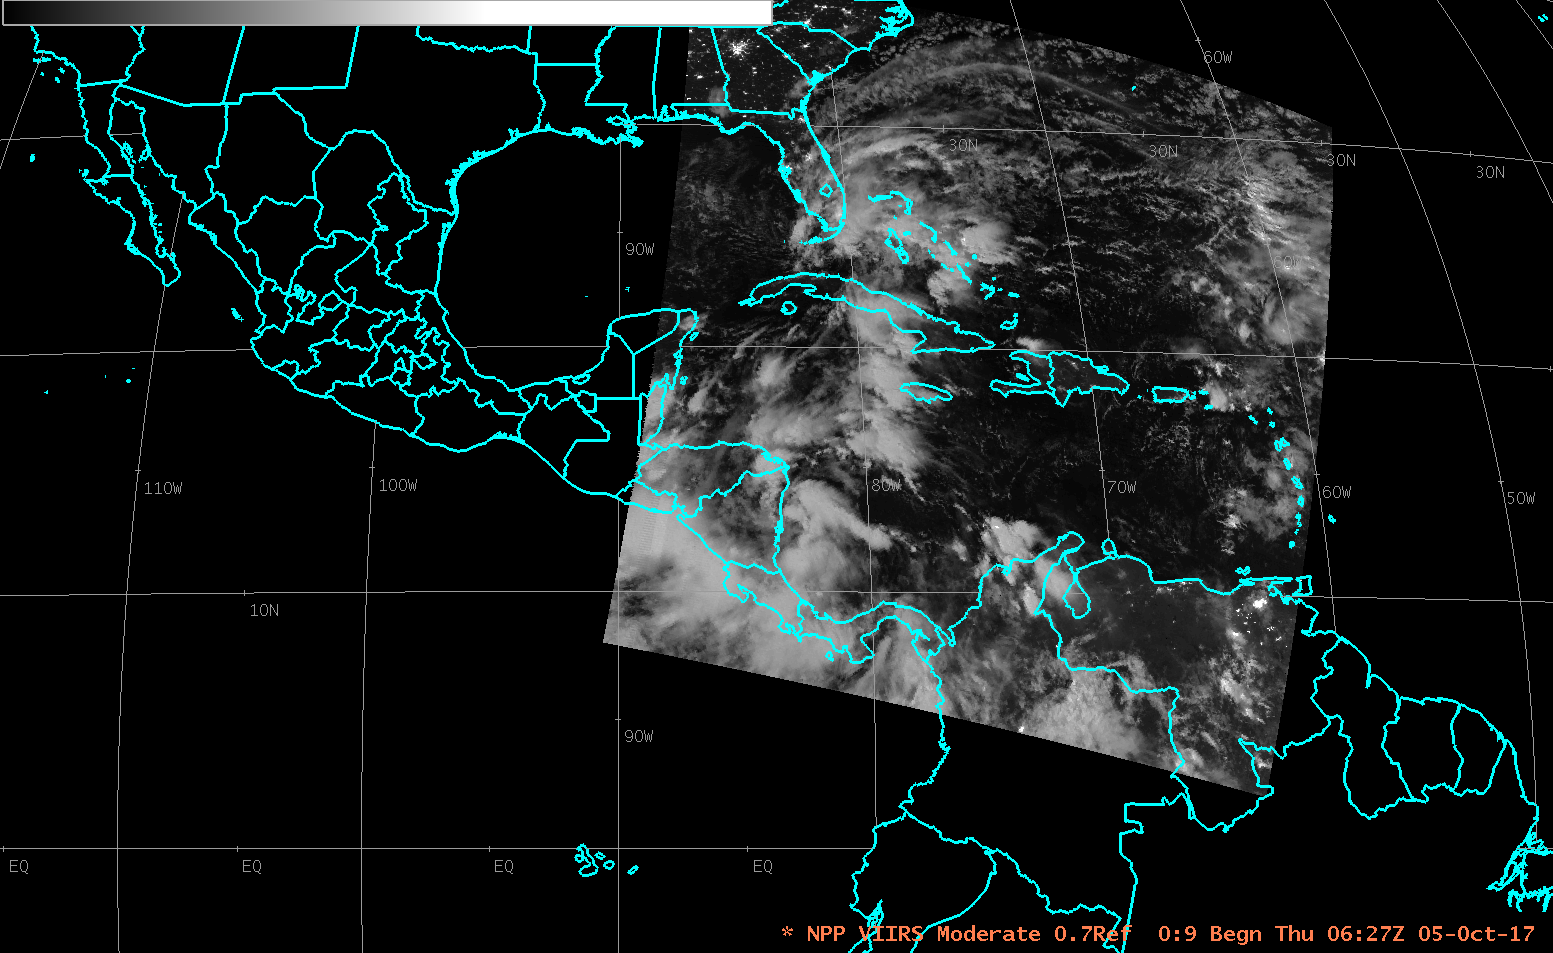
Suomi NPP Day Night Band Visible (0.7 µm) Imagery, 0627 UTC on 5 October 2017 (Click to enlarge)
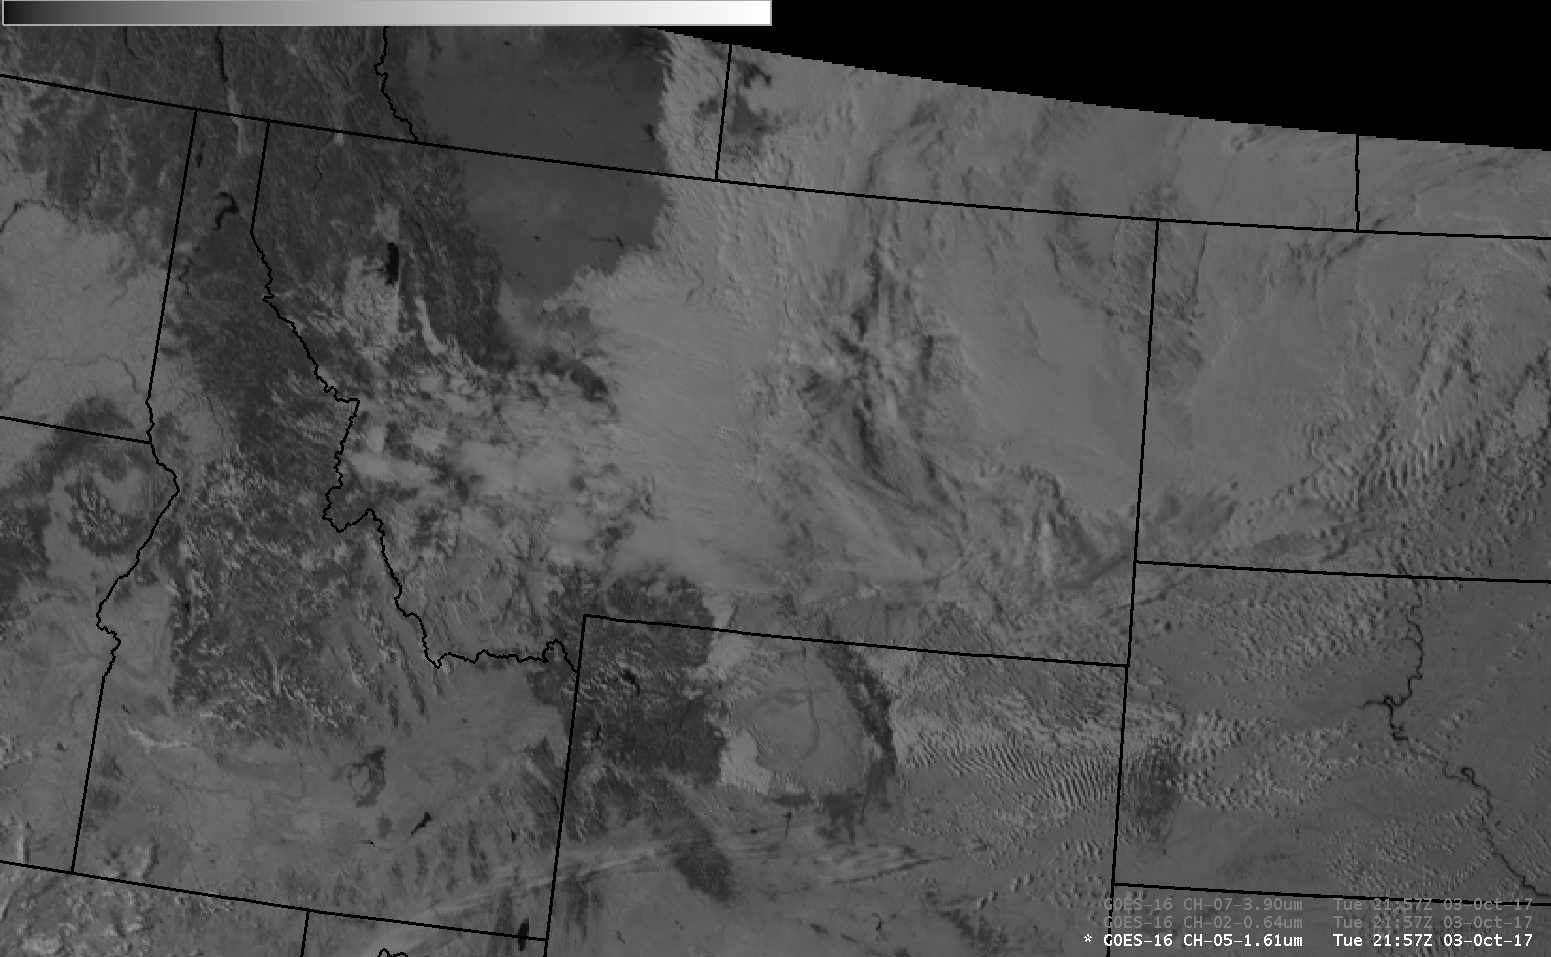
Total Precipitable Water in advance of Nate is plentiful, as shown in the loop below (from this site). There is dry air over the continental United States, however, associated with a strong High Pressure System. Easterly winds south of that system are apparent in Scatterometer winds from early in the morning on 5 October.
MIMIC Morphed Total Precipitable Water, 1200 UTC 4 October – 1100 UTC 5 October 2017 (Click to enlarge)
View only this post Read Less
![Montage of Hurricane Irma GOES-13 infrared images, with and without storm track/intensity [click to view]](https://cimss.ssec.wisc.edu/satellite-blog/wp-content/uploads/sites/5/2017/09/Irma_montage_track_anim.gif)
![GOES-16 Infrared Window (10.3 µm) images, with hourly surface reports plotted in yellow [click to play MP4 animation]](https://cimss.ssec.wisc.edu/satellite-blog/wp-content/uploads/sites/5/2017/09/960x1280_AGOES16_B13_G16_IR_IRMA_CAT5_185MPH_05-07SEP2017_2017248_180034_0001PANEL.GIF)
![Montage of Hurricane Maria GOES-13 infrared images, with and without storm track/intensity [click to view]](https://cimss.ssec.wisc.edu/satellite-blog/wp-content/uploads/sites/5/2017/09/Maria_montage_track_anim.gif)
![GOES-16 Infrared Window (10.3 µm) images, with hourly surface reports plotted in yellow [click to play MP4 animation]](https://cimss.ssec.wisc.edu/satellite-blog/wp-content/uploads/sites/5/2017/09/960x1280_AGOES16_B13_G16_IR_MARIA_MESOSCALE_JM_2_20SEP2017_2017263_090029_0001PANEL.GIF)
![Montage of Hurricane Jose GOES-13 infrared images, with and without storm track/intensity [click to view]](https://cimss.ssec.wisc.edu/satellite-blog/wp-content/uploads/sites/5/2017/09/Jose_montage_track_anim.gif)


