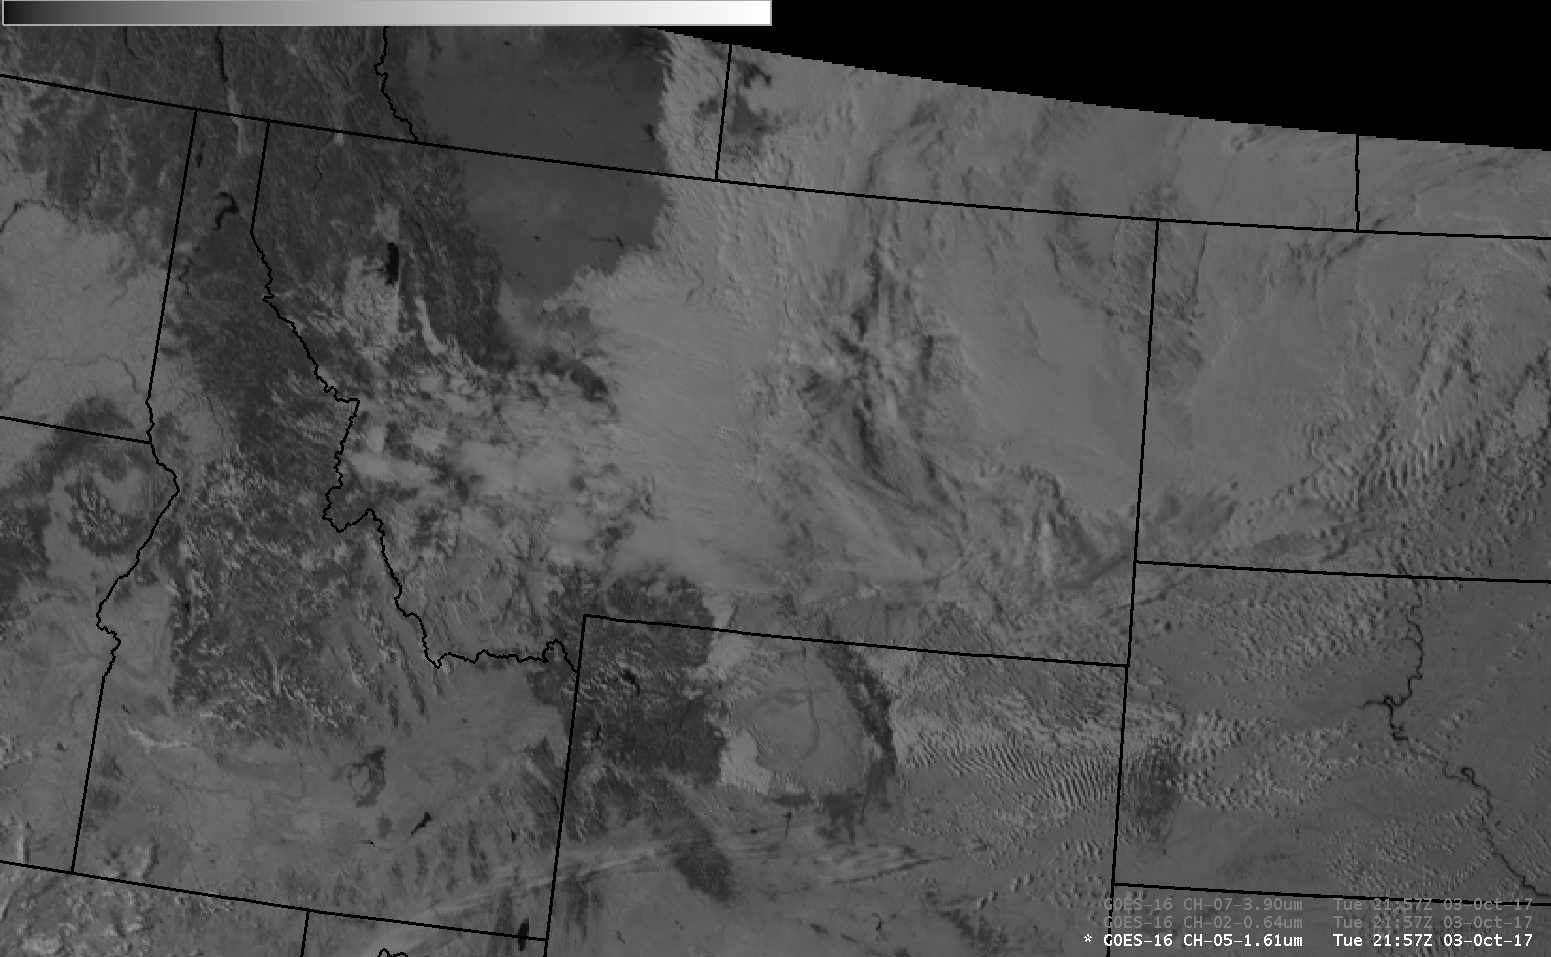

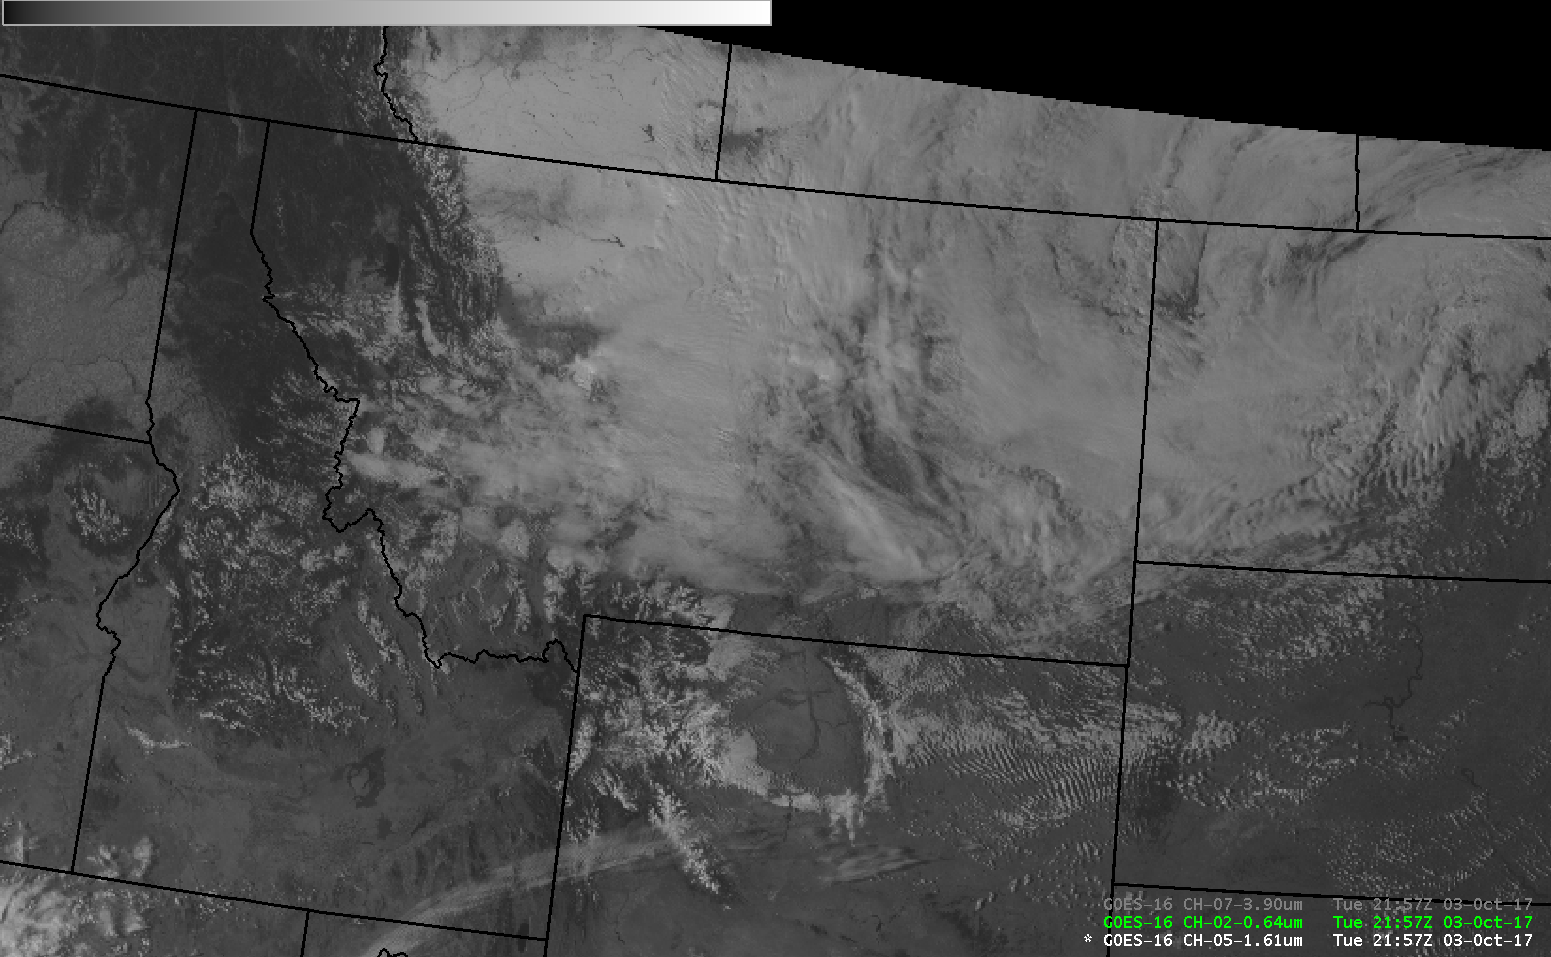
GOES-16 Visible Imagery (0.64 µm), Snow Ice Near Infrared Imagery (1.61 µm) and Shortwave Infrared Imagery (3.9 µm) all at 2157 UTC on 3 October 2017 (Click to enlarge)
GOES-16 data posted on this page are preliminary, non-operational and are undergoing testing
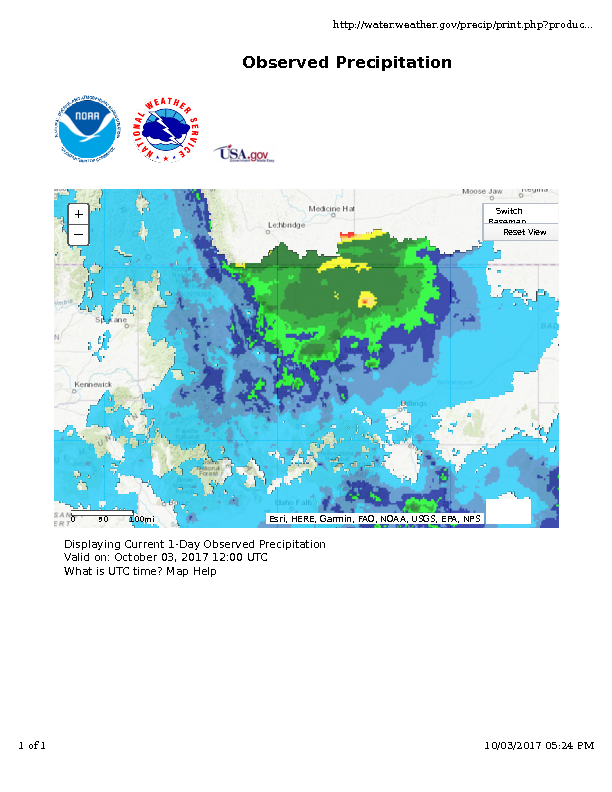
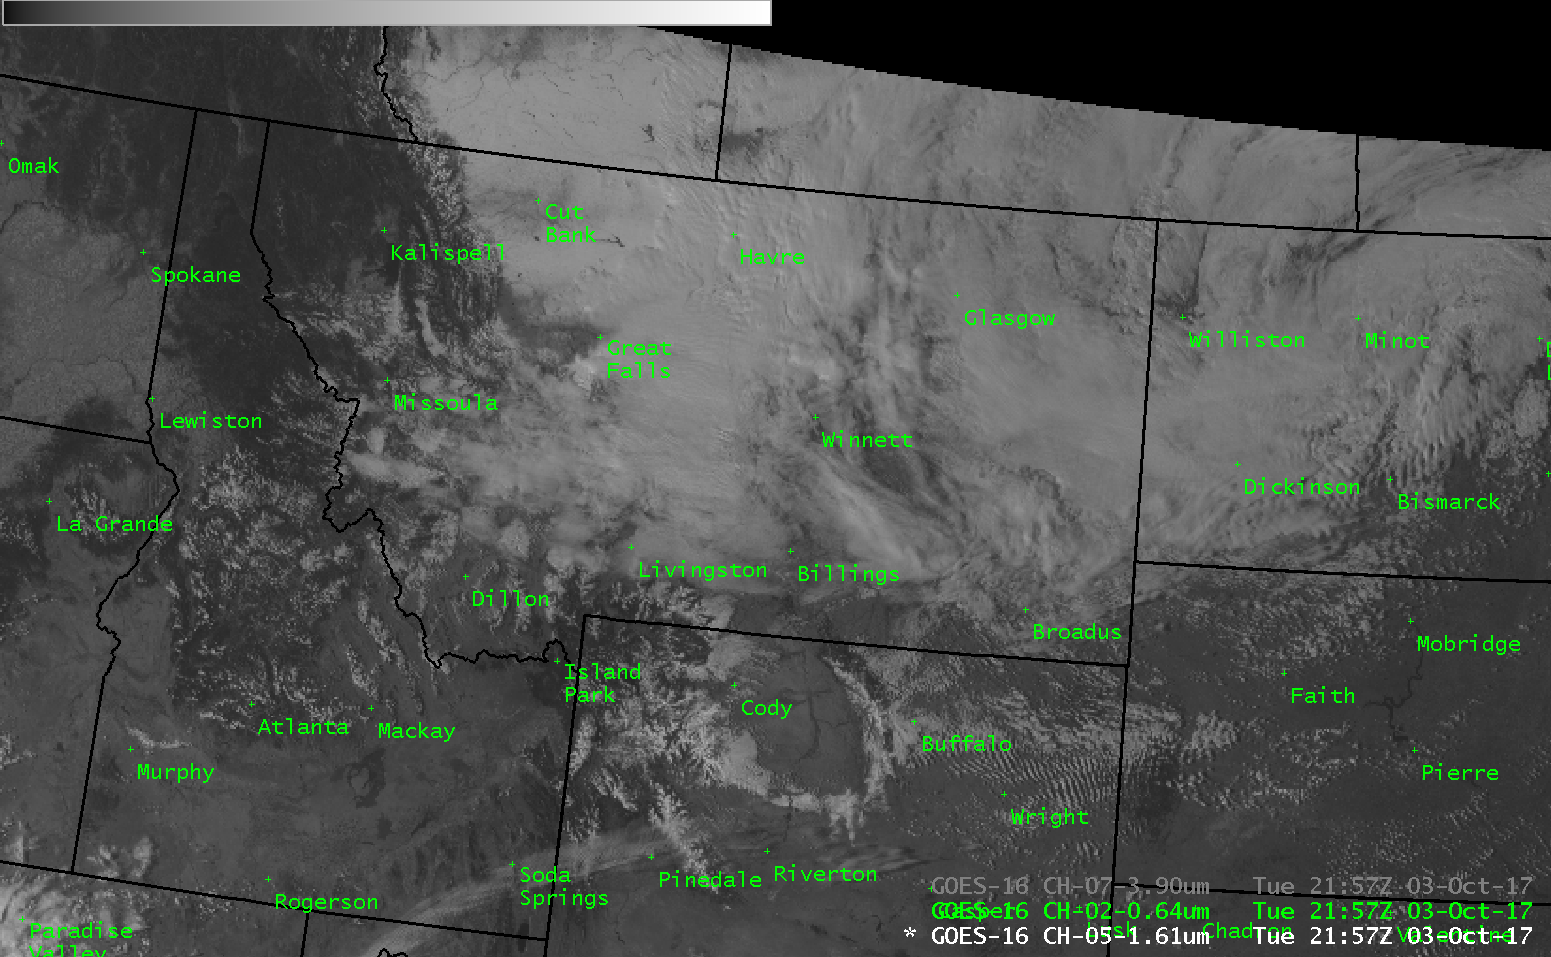
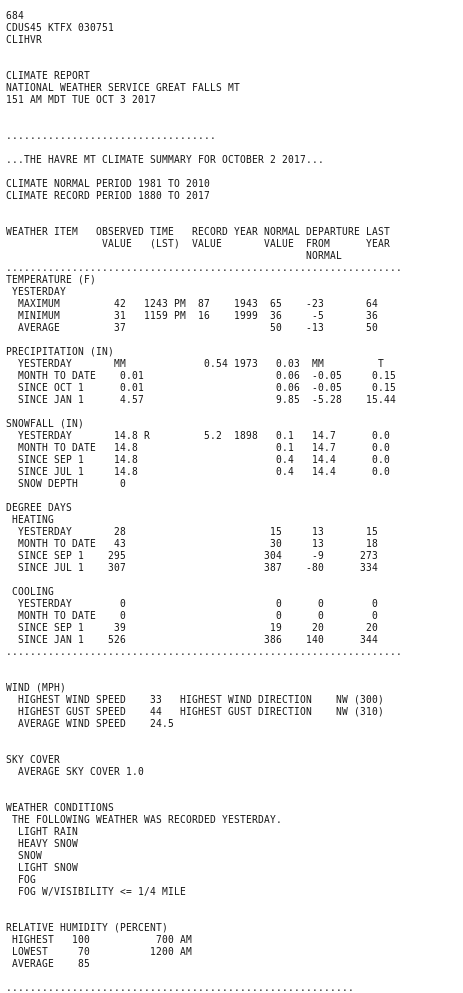
A modest early-season storm has produced a snowfall over north-central Montana and southern Alberta. This image (source) shows total precipitation, with a minimum axis over northern Montana that has an echo in the Visible Imagery above: Whereas most of the snow cover is bright, a region west of Cut Bank MT shows a greyer view, suggestive of less snow on the ground.
GOES-16 includes a channel that senses reflected solar radiation at 1.61 µm and this is a wavelength at which snow strongly absorbs radiation. Thus, snow-covered grounds (and cirrus clouds) appear dark in the 1.61 µm Channel, but very bright in the Visible (0.64 µm). Clouds made up of water droplets are bright in both channels during the day. A Toggle between just the Visible and the Snow/Ice Channel is shown below to highlight regions of snow where clouds are not present over northern Montana and southern Alberta. Note that snow can be inferred in these regions using only the Visible Imagery because rivers — still ice-free in early October — stand out very well in the Visible. Snow is also apparent in the Mountains of northeastern Wyoming: Bright in the visible, Dark in the Snow/Ice channel.
Note that the localized minimum in precipitation, that shows up somewhat dark in the visible, is comparatively bright in the Snow/Ice Channel. In addition, the 3.9 µm Infrared Imagery at the same time shows a region of relative warmth: above freezing surrounded to the north and south by sub-freezing brightness temperatures. All three channels — the visible, snow/ice and shortwave IR suggest a relative minimum in snow from Cut Bank westward to the Rocky Mountains.

GOES-16 Visible Imagery (0.64 µm), Snow Ice Near Infrared Imagery (1.61 µm) at 2157 UTC on 3 October 2017 (Click to enlarge)
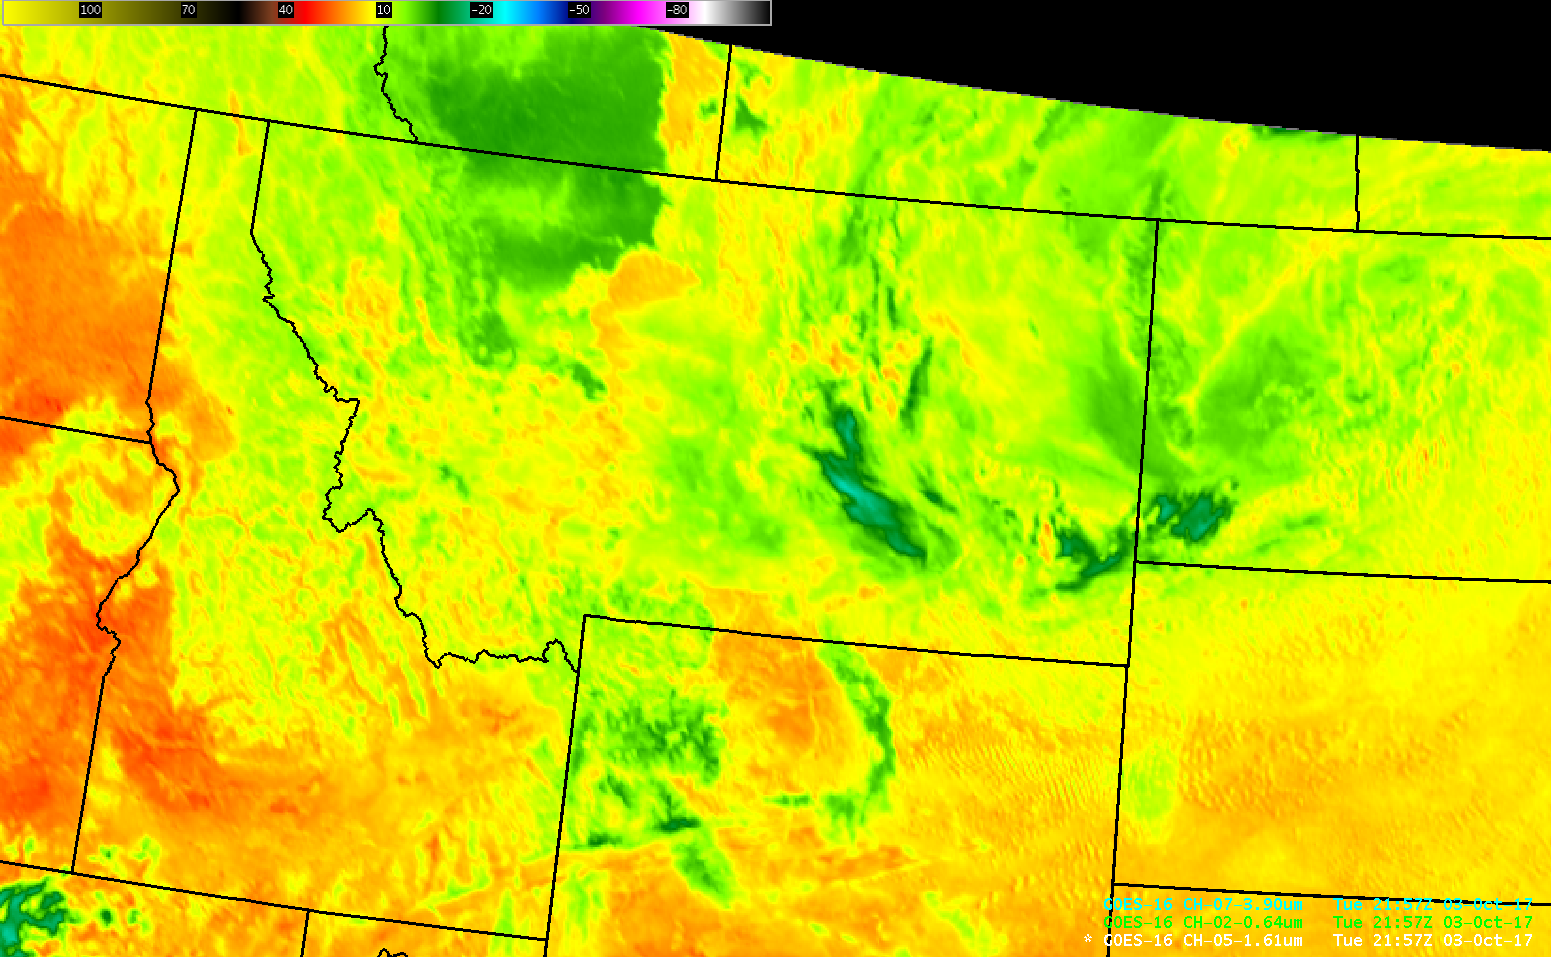
GOES-16 Baseline Products include a Land Surface Temperature Product that is shown below from 2247 UTC. Temperature warmer than Freezing are diagnosed in/around Cutbank and to th west, with subfreezing temperatures to the north and south. Previous to that time, the Cloud Mask diagnosed clouds over the snowcover and the Land Surface Temperature did not produce a value. This toggle shows the Cloud Mask at 2227 and 2237 UTC — clear skies (black) expand over the snow cover in those ten minutes.
GOES-16 derived Land Surface Temperature, 2247 UTC on 3 October 2017 (Click to enlarge)
================= Added 4 October 2017 ====================
GOES-16 derived Land Surface Temperature, 1147 UTC on 3 October 2017 (Click to enlarge)
View only this post Read Less
![GOES-13 Infrared Window (10.7 µm) image, with Deep-Layer Wind Shear product [click to enlarge]](https://cimss.ssec.wisc.edu/satellite-blog/wp-content/uploads/sites/5/2017/09/170926_2345utc_goes13_ir_shear_anim.gif)
![GOES-16 Visible (0.64 µm, left) and Infrared Window (10.3 µm, right) images [click to play MP4 animation]](https://cimss.ssec.wisc.edu/satellite-blog/wp-content/uploads/sites/5/2017/09/958x638_AGOES16_B213_G16_VIS_IR_MARIA_MESO_26SEP2017_2017269_210033_0002PANELS.GIF)
![GOES-16 Lower-level (7.3 µm), Mid-level (6.9 µm) and Upper-level (6.2 µm) Water Vapor images [click to play MP4 animation]](https://cimss.ssec.wisc.edu/satellite-blog/wp-content/uploads/sites/5/2017/09/G16_WV_MARIA_26SEP2017_960x427_B1098_2017269_210133_0003PANELS_00587.GIF)
