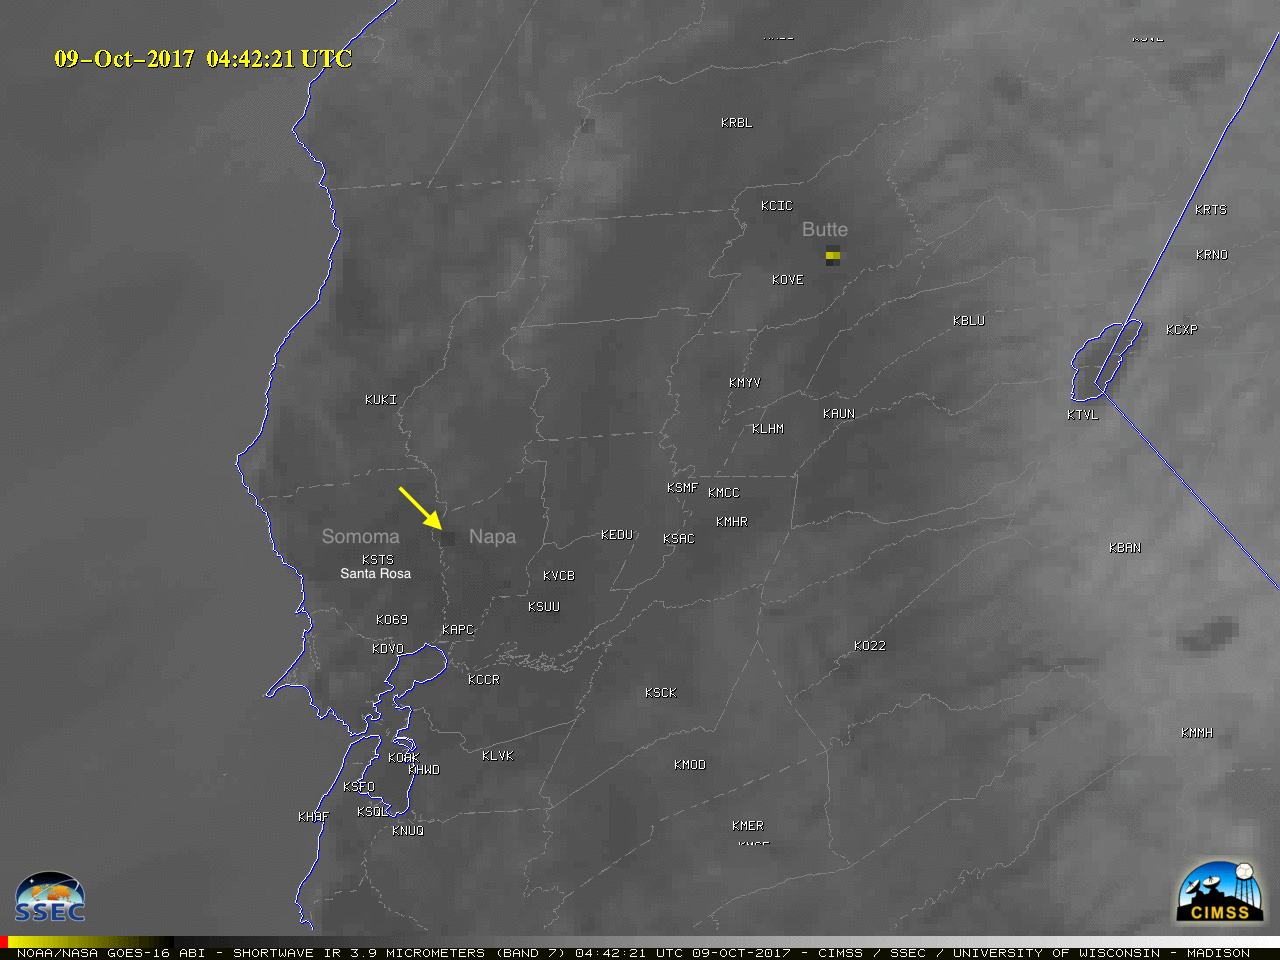
![GOES-16 Shortwave Infrared (3.9 µm) images, with county outlines plotted in gray (dashed) and surface station identifiers plotted in white [click to play MP4 animation]](https://cimss.ssec.wisc.edu/satellite-blog/wp-content/uploads/sites/5/2017/10/960x1280_GOES16A_B7_G16_CA_SWIR_B7_09OCT2017_2017282_082722_0001PANEL.GIF)
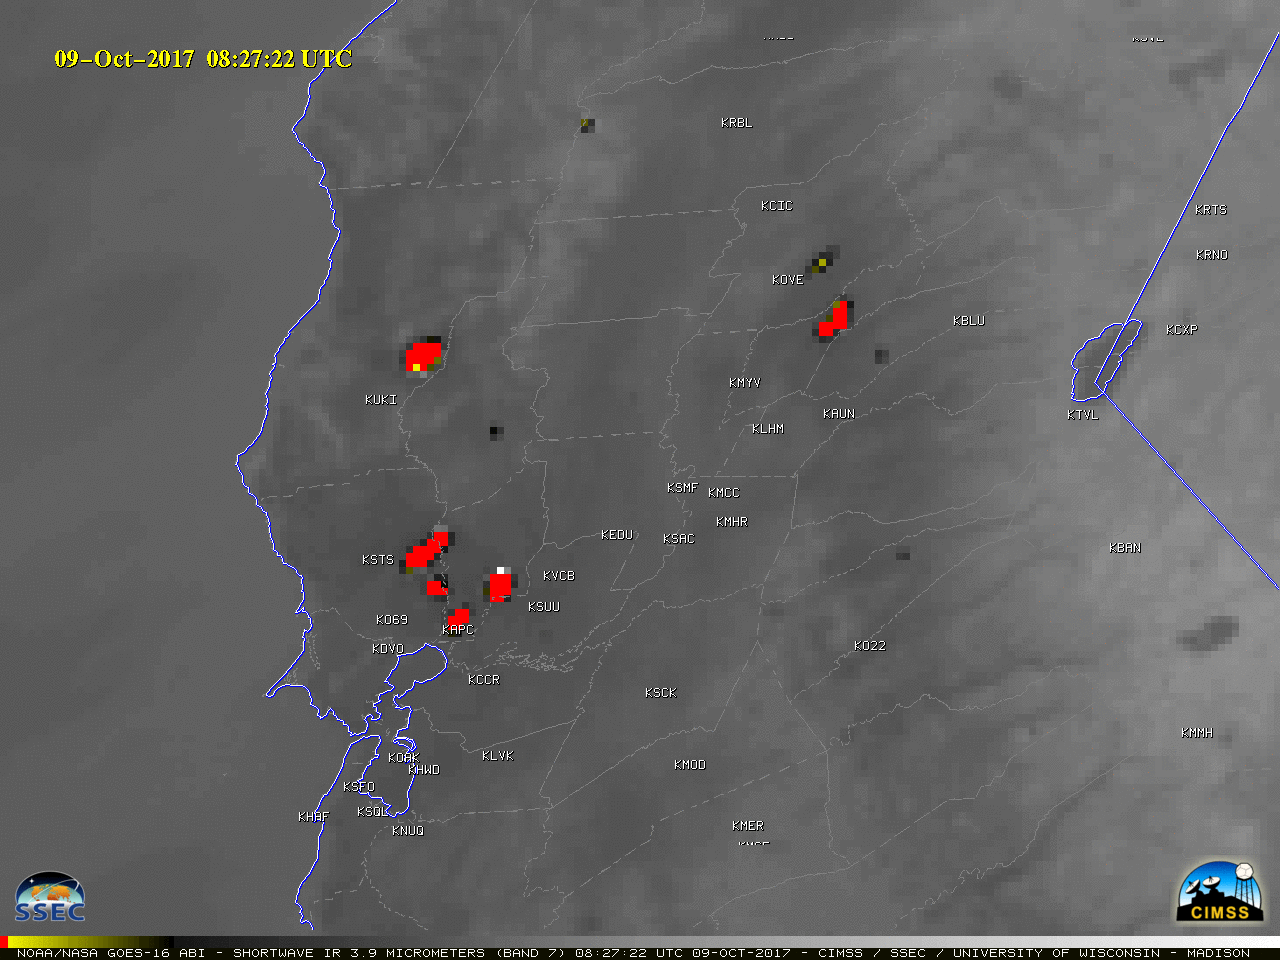
GOES-16 Shortwave Infrared (3.9 µm) images, with county outlines plotted in gray (dashed) and surface station identifiers plotted in white [click to play MP4 animation]
GOES-16 Shortwave Infrared (3.9 µm) images (above) showed the “hot spot” signatures (black to yellow to red pixels) associated with numerous wildfires that began to burn in Northern California’s Napa County around 0442 UTC on 09 October 2017 (9:42 PM local time on 08 October). A strong easterly to northeasterly Diablo wind (gusts) along with dry fuels led to extreme fire behavior, with many of the fires quickly exhibiting very hot infrared brightness temperature values and growing in size at an explosive rate (reportedly burning 80,000 acres in 18 hours).
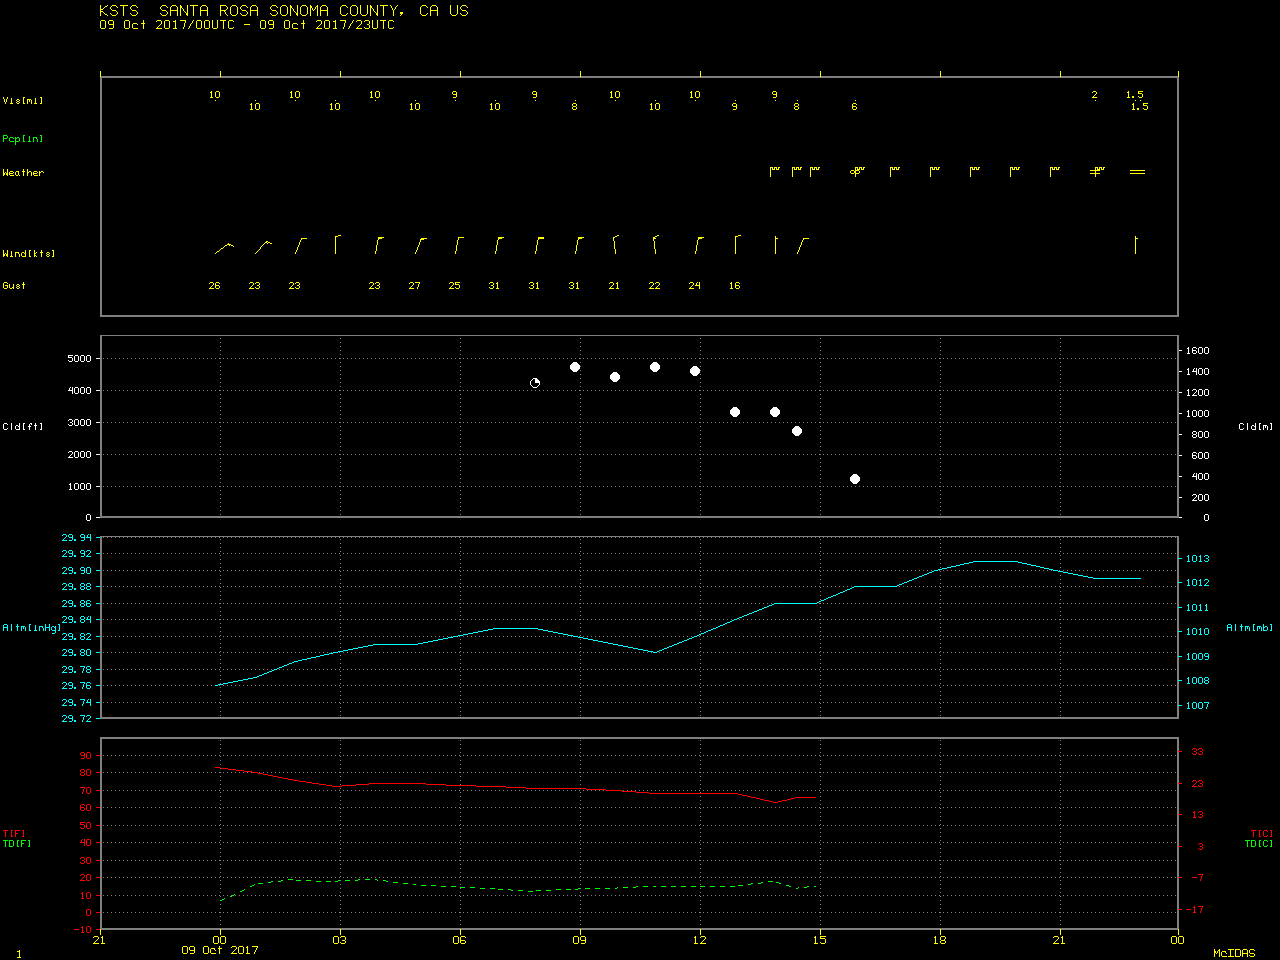
A comparison of nighttime GOES-16 Shortwave Infrared (3.9 µm) and Near-Infrared “Snow/Ice” (1.61 µm) images (below) offered another example of nocturnal fire signature identification — the bright glow of the fires showed up well on the 1-km resolution 1.61 µm imagery. Especially noteworthy was the very rapid southwestward run of the Tubbs Fire, which eventually moved just south of station identifier KSTS (Santa Rosa Sonoma County Airport; the city of Santa Rosa is located about 5 miles southeast of the airport). These Northern California fires have resulted in numerous fatalities, destroyed at least 3500 homes and businesses, and forced large-scale evacuations (media story).
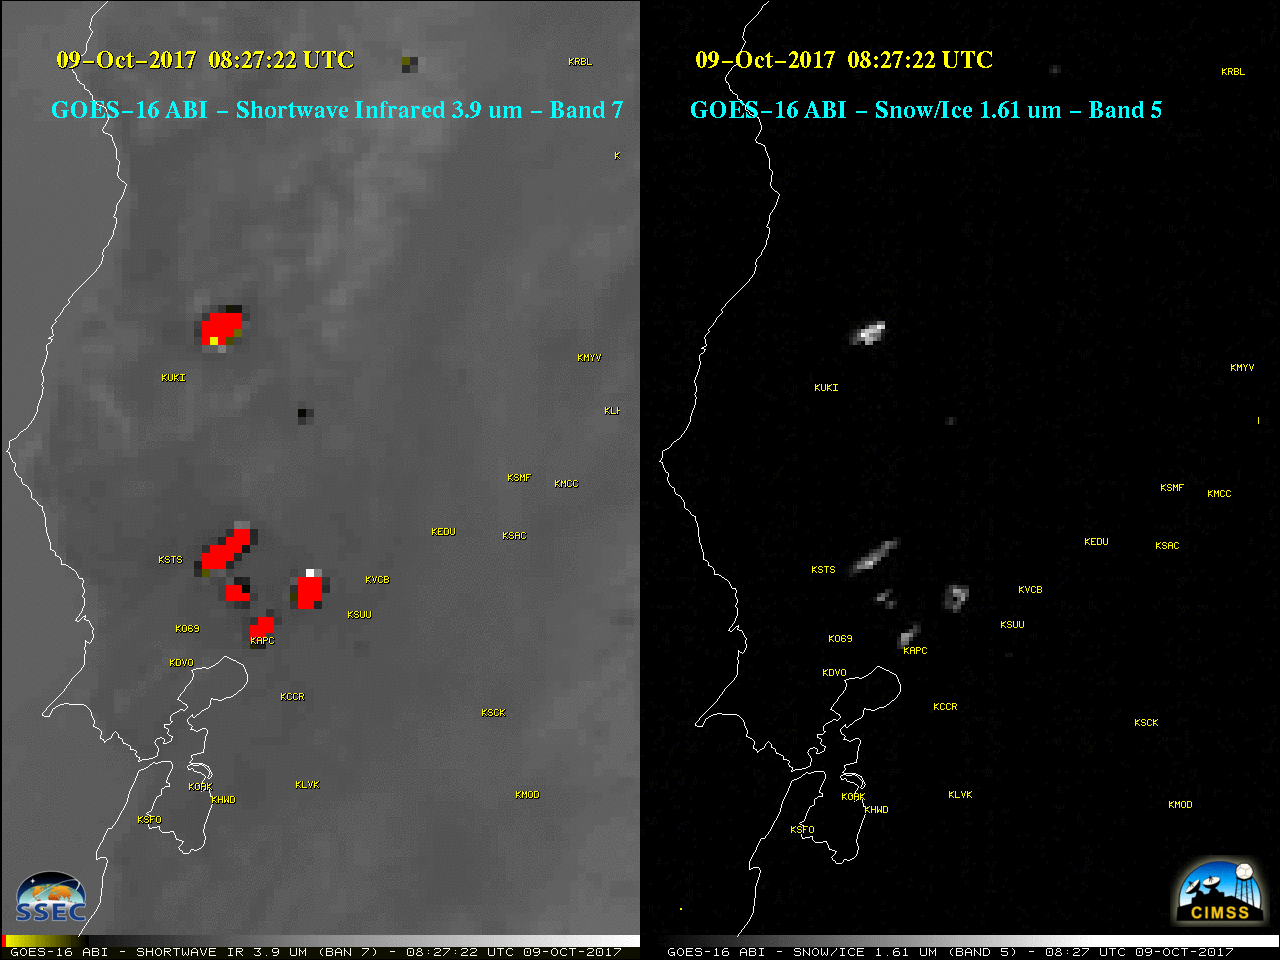
GOES-16 Shortwave Infrared (3.9 µm, left) and Near-Infrared “Snow/Ice” (1.61 µm, right) images [click to play MP4 animation]
![Suomi NPP VIIRS Shortwave Infrared (3.74 µm) and Day/Night Band (0.7 µm) images [click to enlarge]](https://cimss.ssec.wisc.edu/satellite-blog/wp-content/uploads/sites/5/2017/10/171009_1007utc_viirs_swir_dnb_CA_fires_anim.gif)
Suomi NPP VIIRS Shortwave Infrared (3.74 µm) and Day/Night Band (0.7 µm) images [click to enlarge]
![Suomi NPP VIIRS Shortwave Infrared (3.74 µm) and Day/Night Band (0.7 µm) images [click to enlarge]](https://cimss.ssec.wisc.edu/satellite-blog/wp-content/uploads/sites/5/2017/10/171009_1007utc_viirs_swir_dnb_CA_fires_zoom_anim.gif)
Suomi NPP VIIRS Shortwave Infrared (3.74 µm) and Day/Night Band (0.7 µm) images [click to enlarge]
![Suomi NPP VIIRS True-color and False-color RGB images [click to enlarge]](https://cimss.ssec.wisc.edu/satellite-blog/wp-content/uploads/sites/5/2017/10/171009_2131utc_viirs_truecolor_falsecolor_CA_fires_anim.gif)
Suomi NPP VIIRS True-color and False-color RGB images [click to enlarge]
![Suomi NPP VIIRS true-color and false-color images [click to enlarge]](https://cimss.ssec.wisc.edu/satellite-blog/wp-content/uploads/sites/5/2017/10/171010_2113utc_viirs_truecolor_falsecolor_NorCal_fires_anim.gif)
Suomi NPP VIIRS true-color and false-color images [click to enlarge]
===== 11 October Update =====
![Landsat-8 false-color RGB images, from 04 October (before the Tubbs Fire) and 11 October (after the Tubbs Fire) [click to enlarge]](https://cimss.ssec.wisc.edu/satellite-blog/wp-content/uploads/sites/5/2017/10/171004_171011_landsat8_falsecolor_Santa_Rosa_CA_fire_before_after_anim.gif)
Landsat-8 false-color RGB images, from 04 October (before the Tubbs Fire) and 11 October (after the Tubbs Fire) [click to enlarge]
![Suomi NPP VIIRS true-color RGB images, with VIIRS-detected fire locations [click to enlarge]](https://cimss.ssec.wisc.edu/satellite-blog/wp-content/uploads/sites/5/2017/10/171012_suomi_npp_viirs_truecolor_NorCal_fire_smoke_anim.gif)
Suomi NPP VIIRS true-color RGB images, with VIIRS-detected fire locations [click to enlarge]
![Time series plot of surface observations at San Francisco International Airport [click to enlarge]](https://cimss.ssec.wisc.edu/satellite-blog/wp-content/uploads/sites/5/2017/10/171012_171013_KSFO_SFCMG.GIF)
Time series plot of surface observations at San Francisco International Airport [click to enlarge]
![Suomi NPP VIIRS true-color RGB image and Aerosol Optical Depth product [click to enlarge]](https://cimss.ssec.wisc.edu/satellite-blog/wp-content/uploads/sites/5/2017/10/171012_viirs_truecolor_aod_CA_smoke_anim.gif)
Suomi NPP VIIRS true-color RGB image and Aerosol Optical Depth product [click to enlarge]
View only this post Read Less
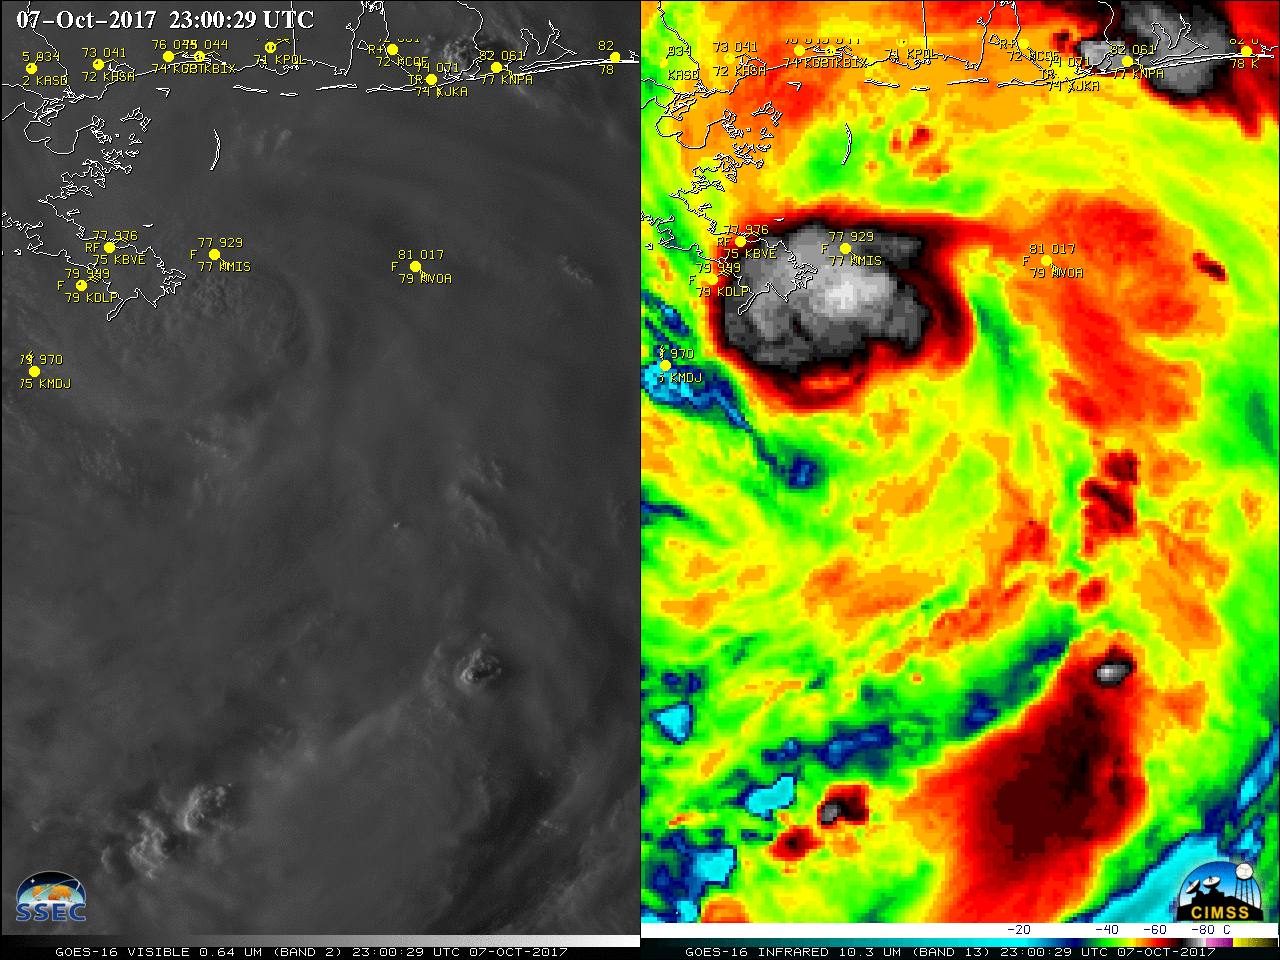
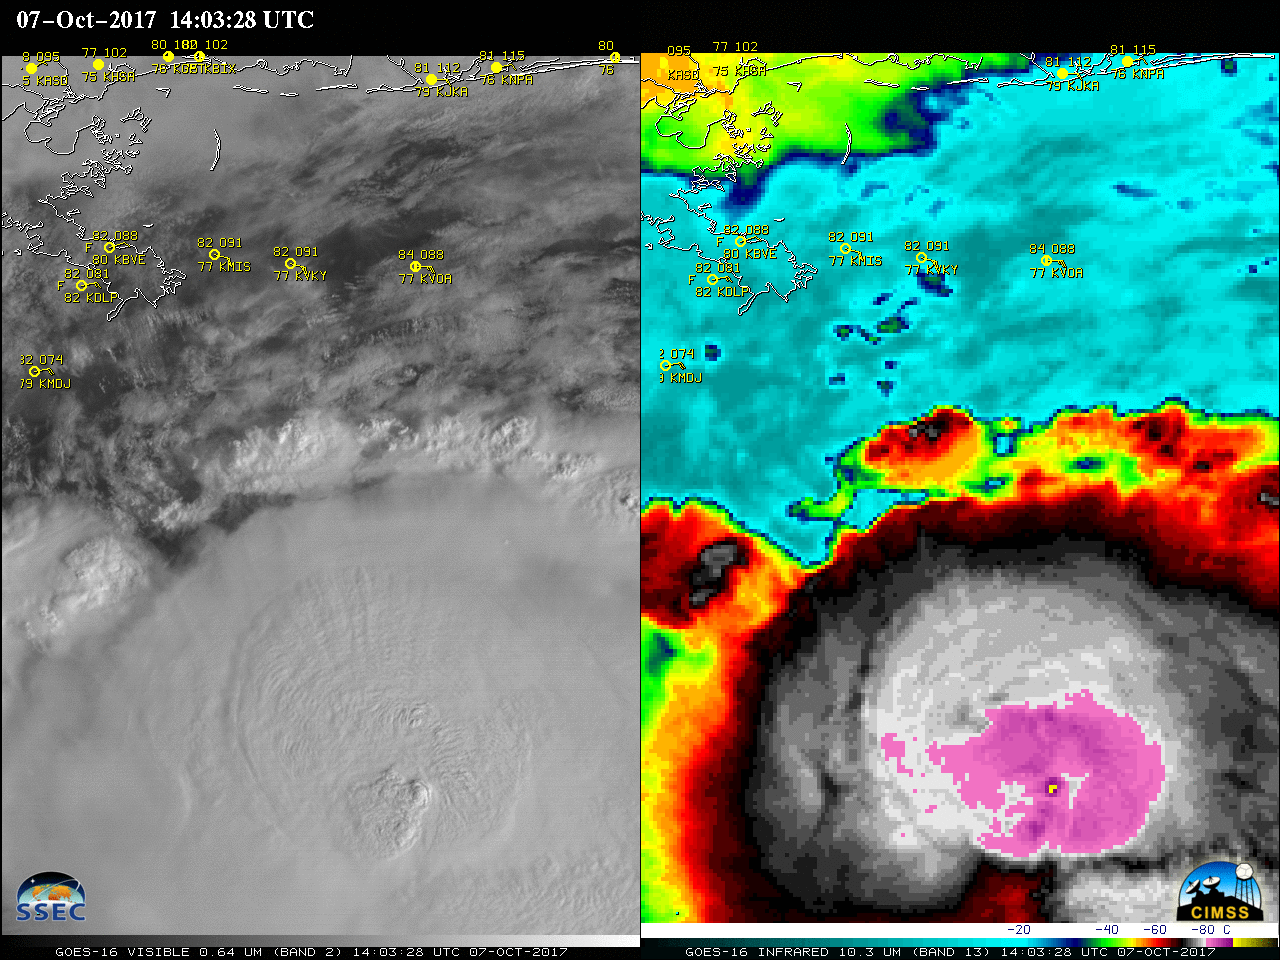
![GOES-16 Visible (0.64 µm. left) and Infrared Window (10.3 µm, right) images, with hourly surface reports plotted in yellow [click to play MP4 animation]](https://cimss.ssec.wisc.edu/satellite-blog/wp-content/uploads/sites/5/2017/10/958x638_AGOES16_B213_G16_VIS_IR_NATE_MESO2_07OCT2017_2017280_230029_0002PANELS.GIF)
![GOES-13 Infrared Window (10.7 µm) and DMSP-17 SSMIS Microwave (85 GHz) images around 1215 UTC [click to enlarge]](https://cimss.ssec.wisc.edu/satellite-blog/wp-content/uploads/sites/5/2017/10/171007_1215utc_goes13_infrared_1213utc_dmsp17_ssmis_85ghz_microwave_Nate_anim.gif)
![Sea Surface Temperature and Ocean Heat Content analyses from 06 October, with an overlay of the 07 October path of Hurricane Nate ending at 12 UTC [click to enlarge]](https://cimss.ssec.wisc.edu/satellite-blog/wp-content/uploads/sites/5/2017/10/171006_ohc_sst_Nate_anim.gif)
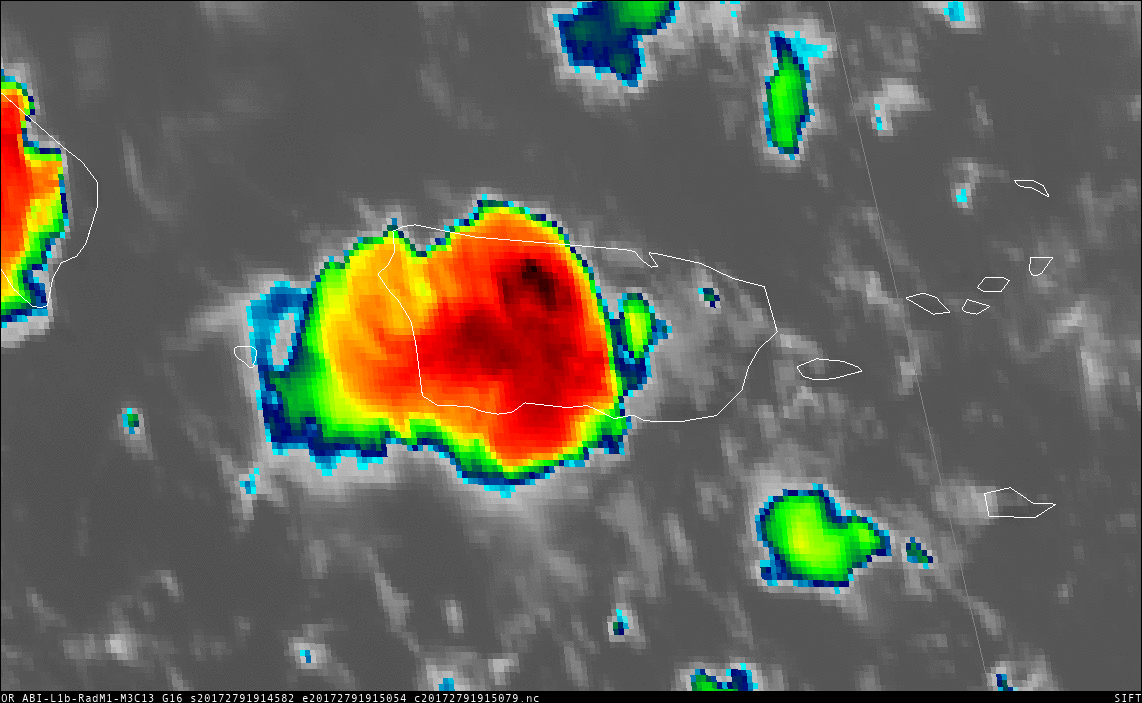
![GOES-16 Visible (0.64 µm, left) and Infrared Window (10.3 µm, right) images, with hourly San Juan surface data plotted in yellow [click to play MP4 animation]](https://cimss.ssec.wisc.edu/satellite-blog/wp-content/uploads/sites/5/2017/10/958x638_AGOES16_B213_G16_VIS_IR_MESO_TJSJ_PR_06OCT2017_2017279_202558_0002PANELS.GIF)
