Himawari-8 Visible (0.64 µm) and Infrared Window (10.4 µm) images (above) showed Cyclone Kelvin as it made landfall in Western Australia as a Category 1 storm on 18 February 2018. Kelvin continued to intensify shortly after making landfall, with estimated winds of 80 gusting to 100 knots — and a distinct eye feature could be seen... Read More
![Himawari-8 Visible (0.64 µm, left) and Infrared Window (10.4 µm, right) images, with hourly surface plots at Broome [click to play Animated GIF | MP4 also available]](https://cimss.ssec.wisc.edu/satellite-blog/wp-content/uploads/sites/5/2018/02/HIM08_VIS_IR_KELVIN_18FEB2018_960x640_B313_2018048_235000_0002PANELS_00012.GIF)
Himawari-8 Visible (0.64 µm, left) and Infrared Window (10.4 µm, right) images, with hourly surface plots at Broome, Australia [click to play Animated GIF | MP4 also available]
Himawari-8 Visible (0.64 µm) and Infrared Window (10.4 µm) images
(above) showed Cyclone Kelvin as it made landfall in Western Australia as a
Category 1 storm on 18 February 2018. Kelvin continued to intensify shortly after making landfall, with estimated winds of
80 gusting to 100 knots — and a distinct eye feature could be seen in the Visible and Infrared imagery (as well as
Broome radar data).
A longer animation of Himawari-8 Infrared Window (10.4 µm) images (below) revealed a very large convective burst as Kelvin meandered near the coast early on 17 February — periodic cloud-top infrared brightness temperatures of -90 ºC or colder were seen. After making landfall, the eye structure eventually deteriorated by 18 UTC on 18 February.
![Himawari-8 Infrared Window (10.4 µm) images, with hourly surface plots [click to play MP4 | Animated GIF also available]](https://cimss.ssec.wisc.edu/satellite-blog/wp-content/uploads/sites/5/2018/02/HIM08_IR_KELVIN_17_18FEB2018_960x1280_B13_2018049_040000_0001PANEL_00131.GIF)
Himawari-8 Infrared Window (10.4 µm) images, with hourly surface plots [click to play MP4 | Animated GIF also available]
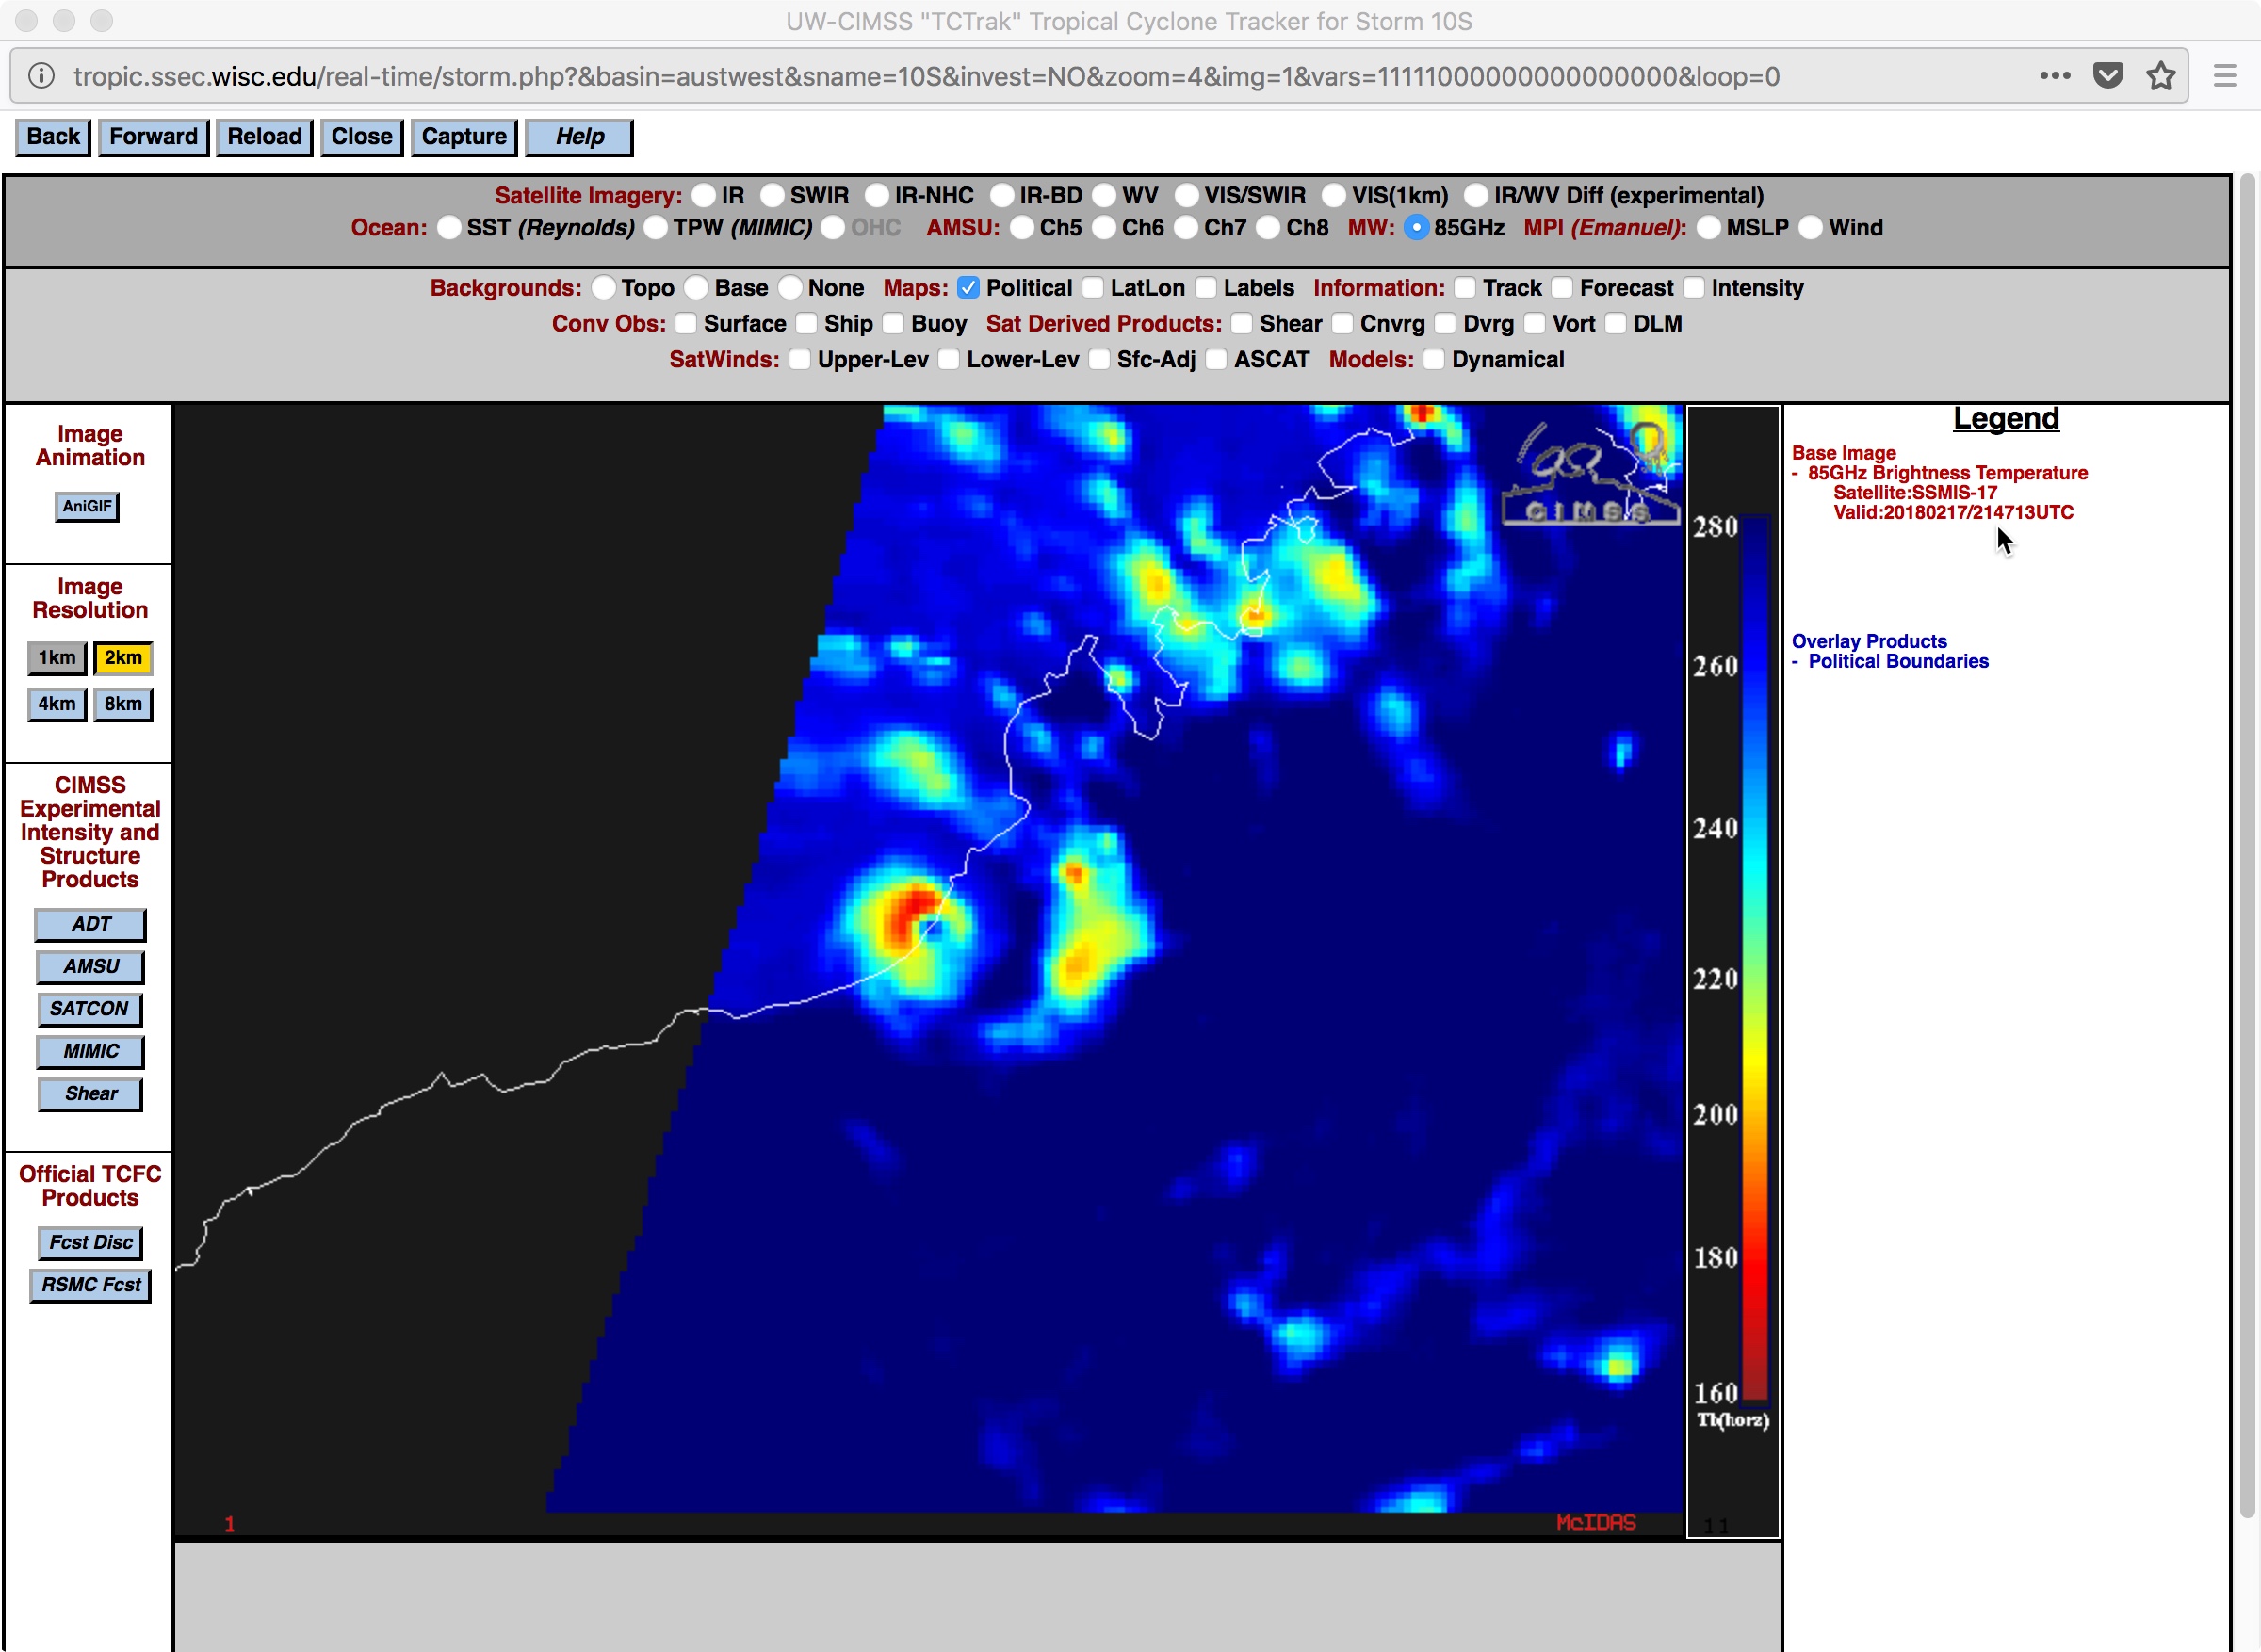
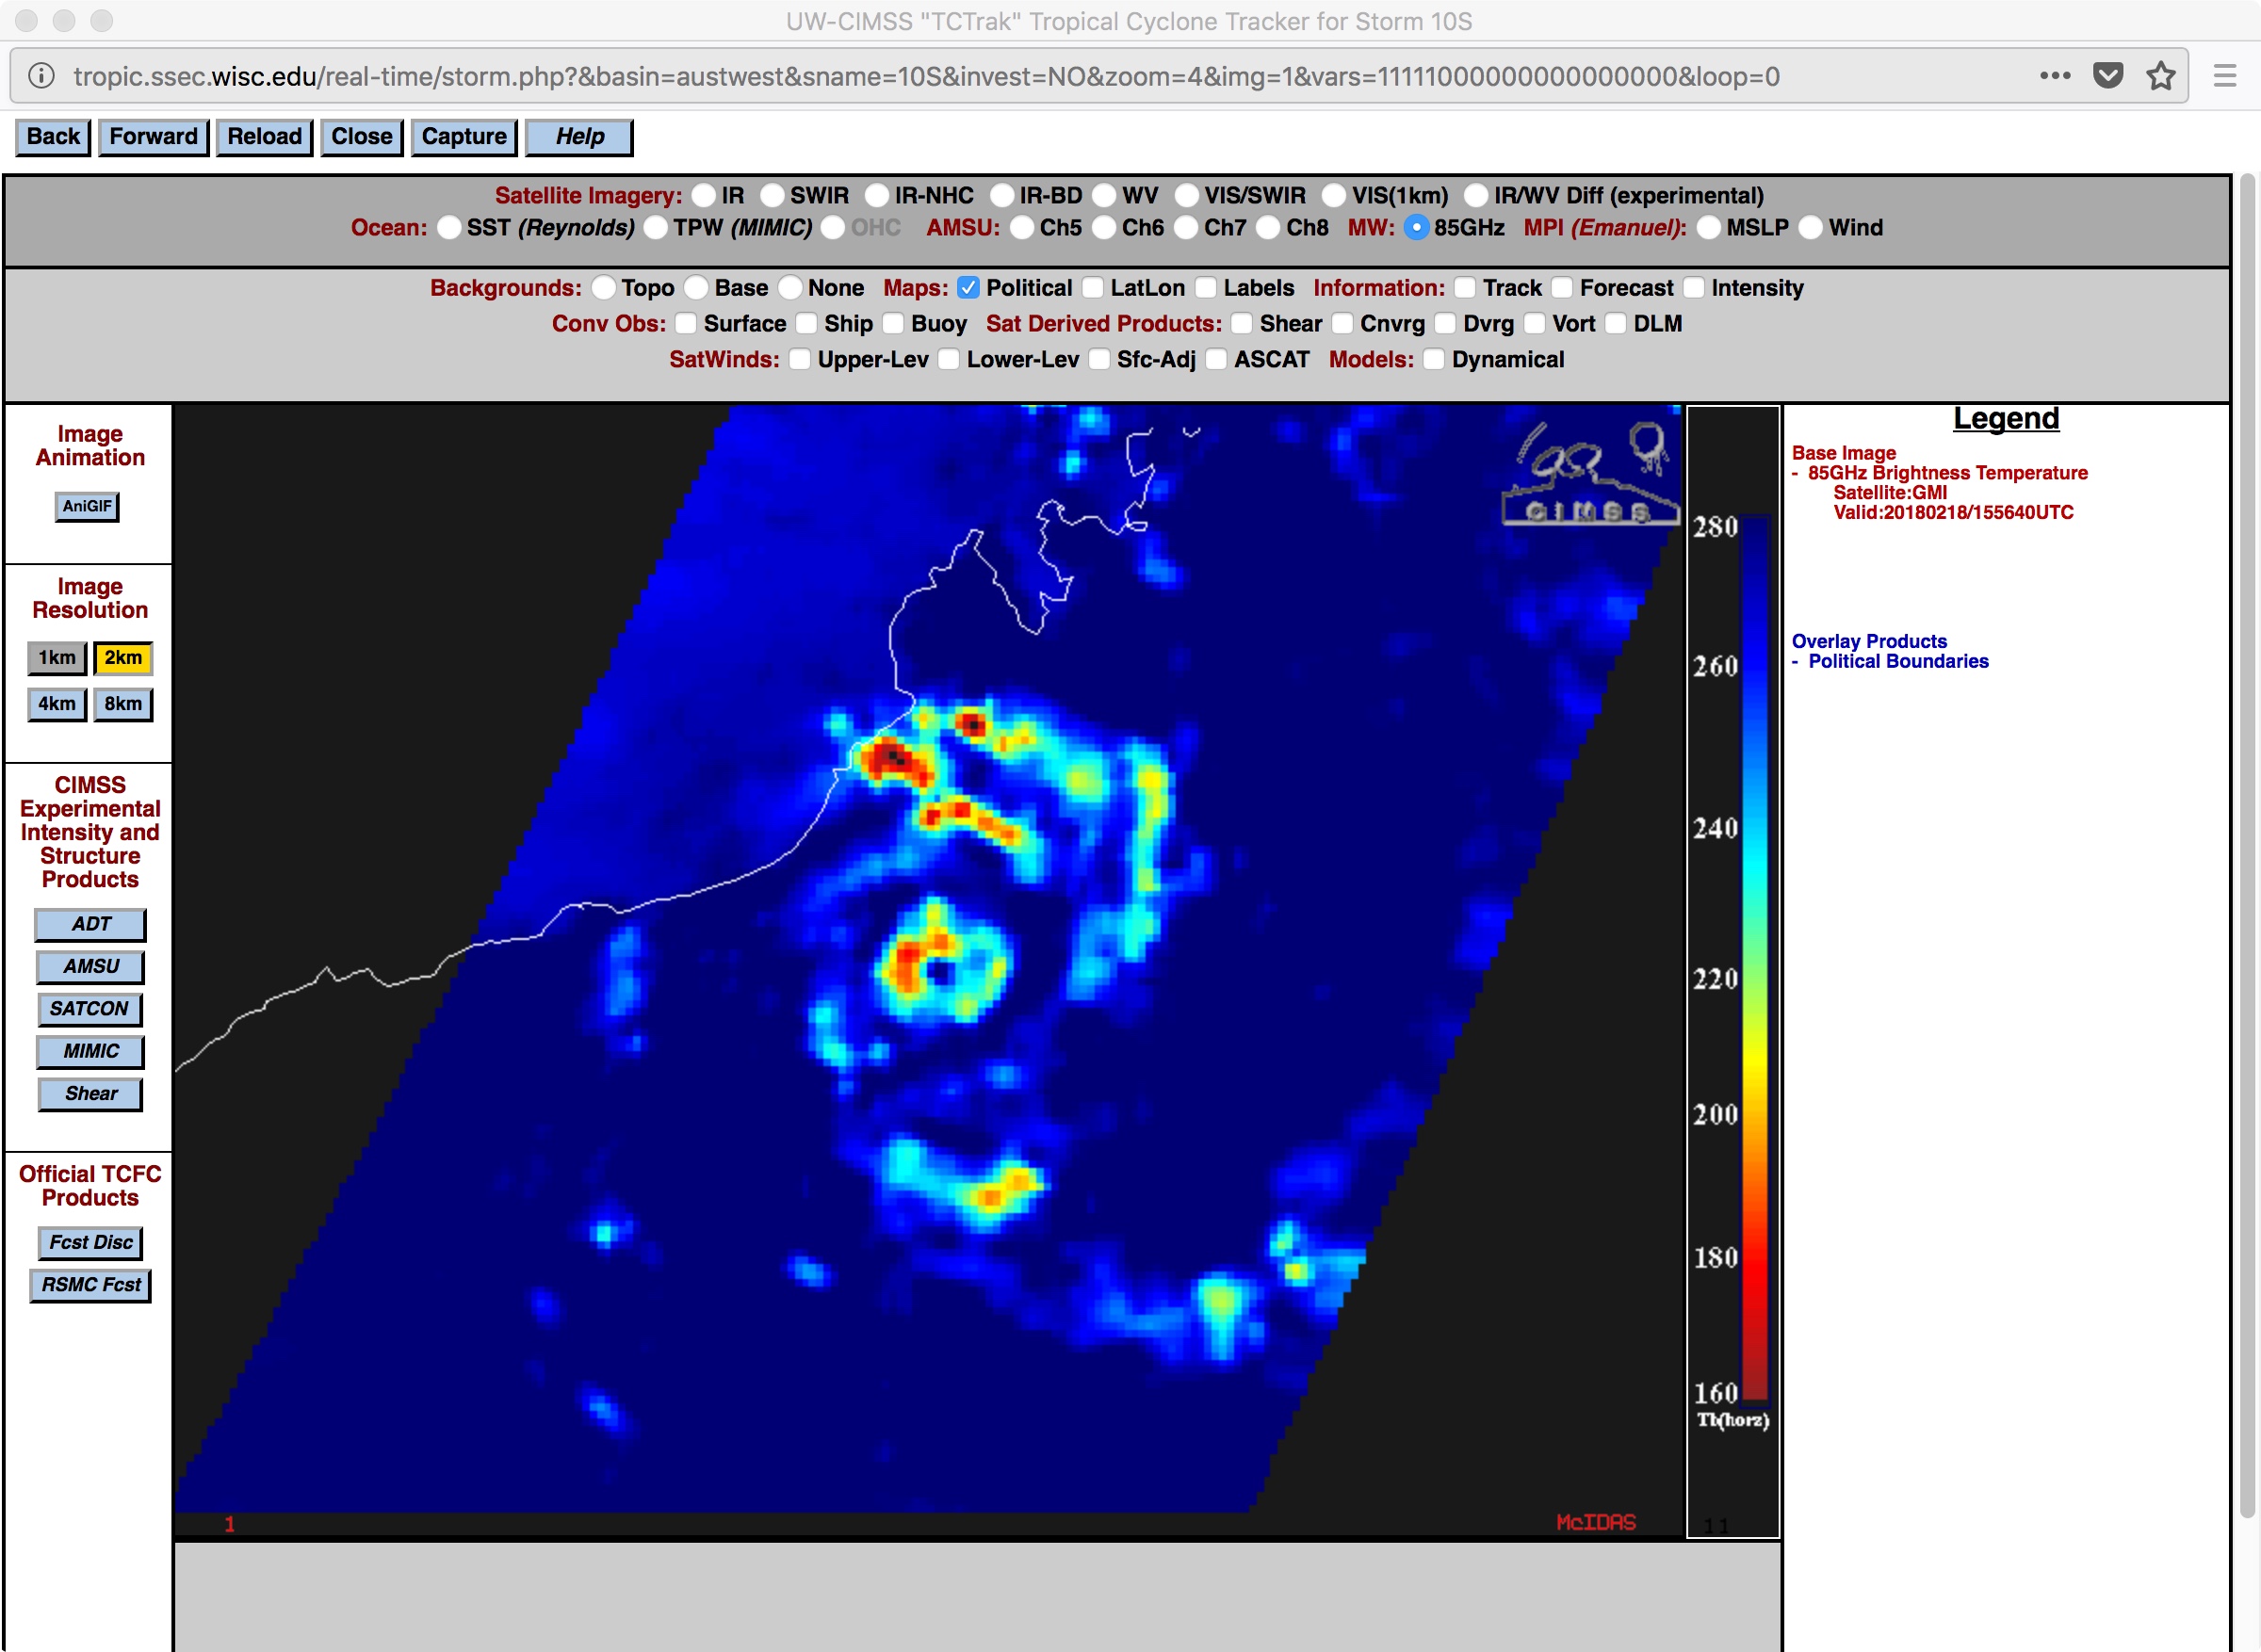
The
MIMIC-TC product
(below) showed the development of Kelvin’s compact eye during the 17 February – 18 February period; the eye was well-defined around the time of landfall (
2147 UTC image on 17 February), and persisted for at least 18 hours (
1556 UTC image on 18 February) until rapidly dissipating by
21 UTC.
![MIMIC-TC morphed microwave imagery [click to enlarge]](https://cimss.ssec.wisc.edu/satellite-blog/wp-content/uploads/sites/5/2018/02/180217_180218_mimic_tc_Kelvin_anim.gif)
MIMIC-TC morphed microwave imagery [click to enlarge]
Himawari-8
Deep Layer Wind Shear values remained very low — generally 5 knots or less — prior to, during and after the landfall of Kelvin, which also contributed to the slow rate of weakening. In addition, an upward moisture flux from the warm/wet sandy soil of that region helped Kelvin to intensify after landfall; land surface friction was also small, since that portion of Western Australia is rather flat.
![Himawari-8 Water Vapor images, with Deep Layer Wind Shear product [click to enlarge]](https://cimss.ssec.wisc.edu/satellite-blog/wp-content/uploads/sites/5/2018/02/180217_18_himawari8_water_vapor_shear_Cyclone_Kelvin_anim.gif)
Himawari-8 Water Vapor images, with Deep Layer Wind Shear product [click to enlarge]
The eye of Cyclone Kelvin could also be seen in Terra MODIS and Suomi NPP VIIRS True-color Red-Green-Blue (RGB) images, viewed using
RealEarth (below). The actual times of the Terra and Suomi NPP satellite overpasses were 0154 UTC and 0452 UTC on 18 February, respectively.
![Terra MODIS and Suomi NPP VIIRS True-color RGB images [click to enlarge]](https://cimss.ssec.wisc.edu/satellite-blog/wp-content/uploads/sites/5/2018/02/180218_modis_viirs_truecolor_Kelvin_anim.gif)
Terra MODIS and Suomi NPP VIIRS True-color RGB images [click to enlarge]
View only this post
Read Less
![Himawari-8 Visible (0.64 µm, left) and Infrared Window (10.4 µm, right) images, with hourly surface plots at Broome [click to play Animated GIF | MP4 also available]](https://cimss.ssec.wisc.edu/satellite-blog/wp-content/uploads/sites/5/2018/02/180218_himawari8_visible_infrared_Cyclone_Kelvin_anim.gif)
![Terra and Aqua MODIS True-color RGB images of southern Lake Michigan [click to enlarge]](https://cimss.ssec.wisc.edu/satellite-blog/wp-content/uploads/sites/5/2018/02/180214_terra_aqua_modis_truecolor_Lake_Michigan_anim.gif)
![Terra and Aqua MODIS True-color RGB images of southern Lake Huron [click to enlarge]](https://cimss.ssec.wisc.edu/satellite-blog/wp-content/uploads/sites/5/2018/02/180214_terra_aqua_modis_truecolor_Lake_Huron_anim.gif)
![Terra and Aqua MODIS True-color RGB images of western Lake Erie [click to enlarge]](https://cimss.ssec.wisc.edu/satellite-blog/wp-content/uploads/sites/5/2018/02/180214_terra_aqua_modis_truecolor_Lake_Erie_anim.gif)
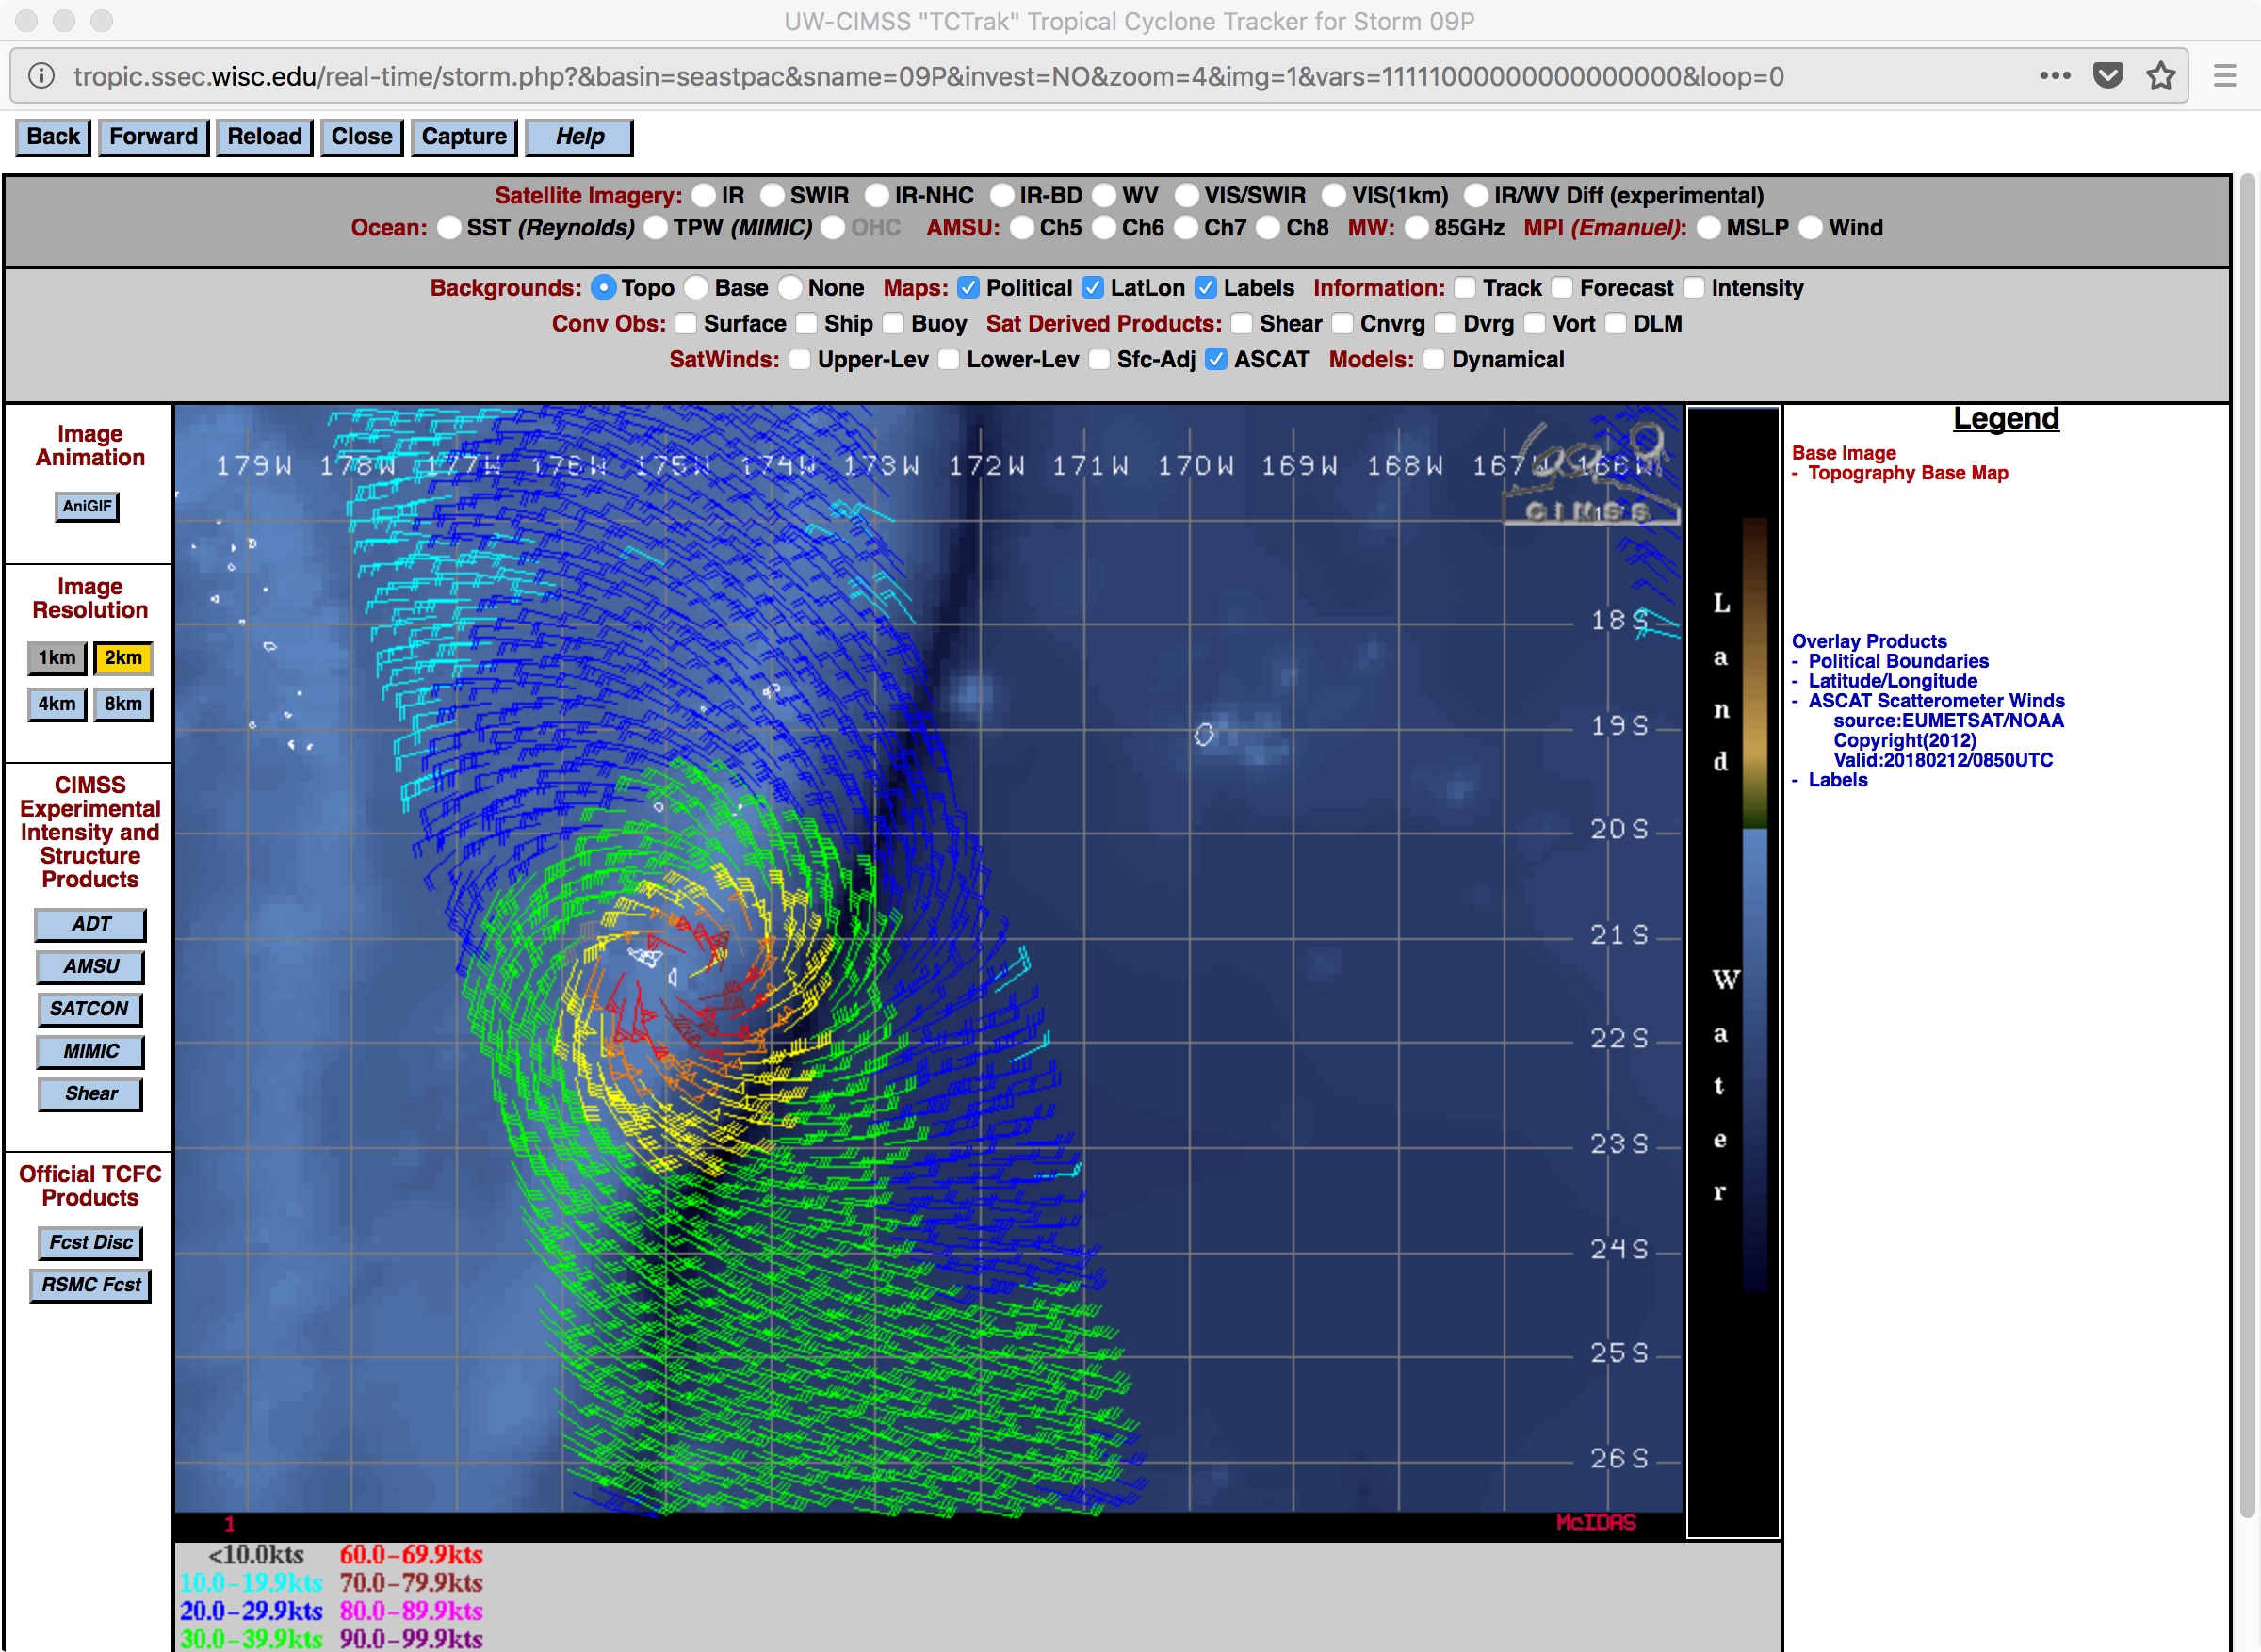
![Metop ASCAT scatterometer surface winds [click to enlarge]](https://cimss.ssec.wisc.edu/satellite-blog/wp-content/uploads/sites/5/2018/02/180212_0850utc_ascat_Gita.jpeg)
