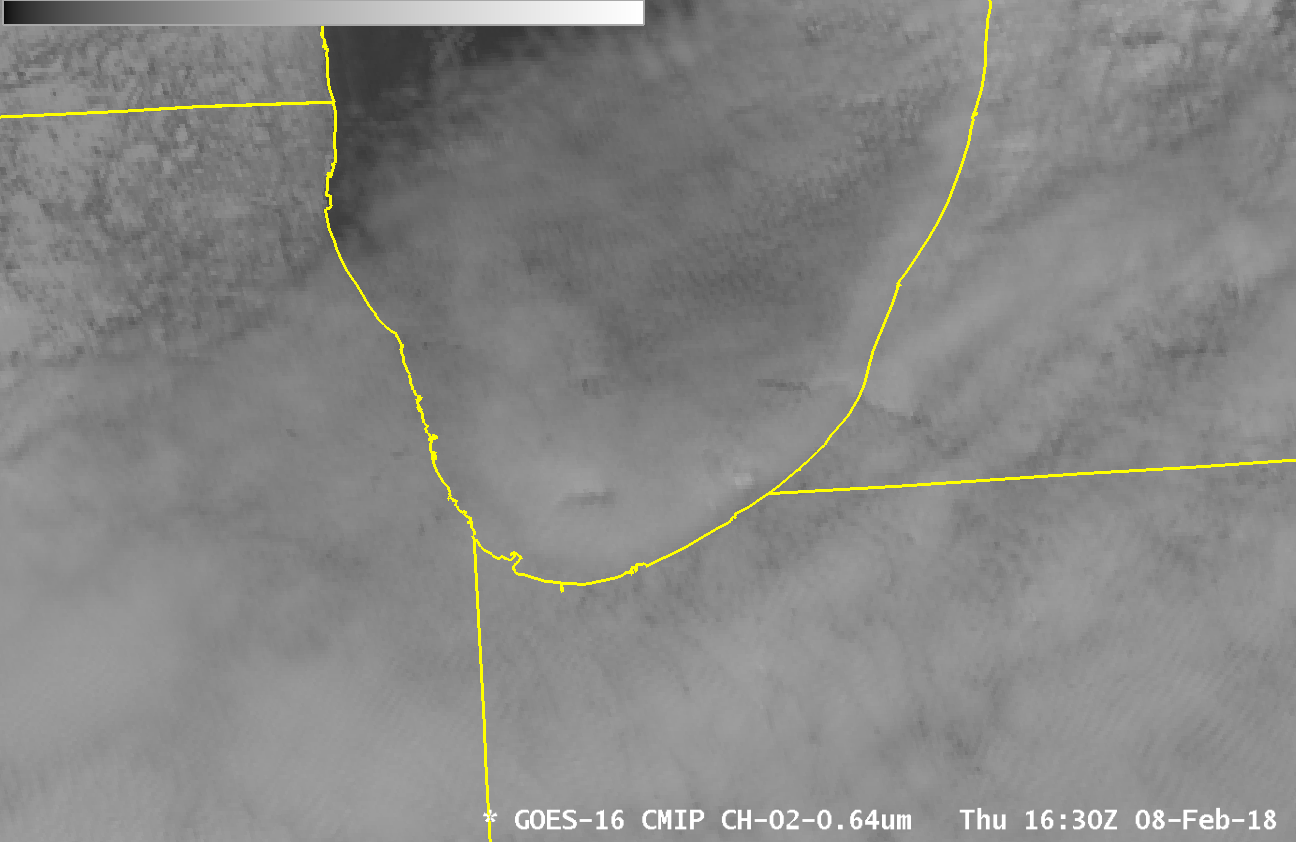
The animation above shows visible imagery from GOES-16 (0.64 µm) over Pennsylvania on 8 February 2018. Northwest flow over the ridges of the Appalachians is causing stable waves clouds that are parallel to the topography. However, the animation shows point sources over Somerset and Cambria counties — in southwestern Pennsylvania... Read More

GOES-16 ABI Band 2 (0.64 µm) Visible Imagery, 1222 – 1712 UTC on 8 February 2018 (Click to animate)
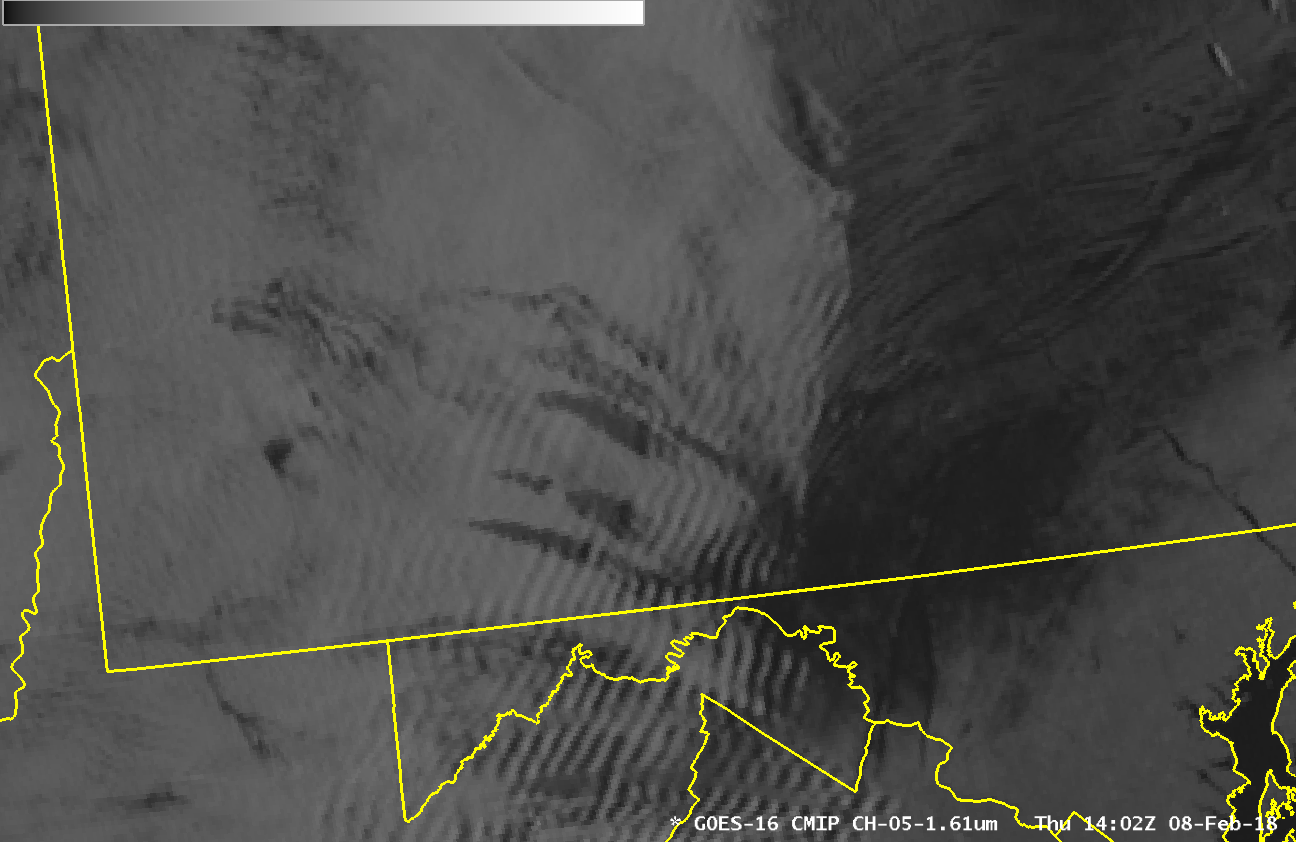
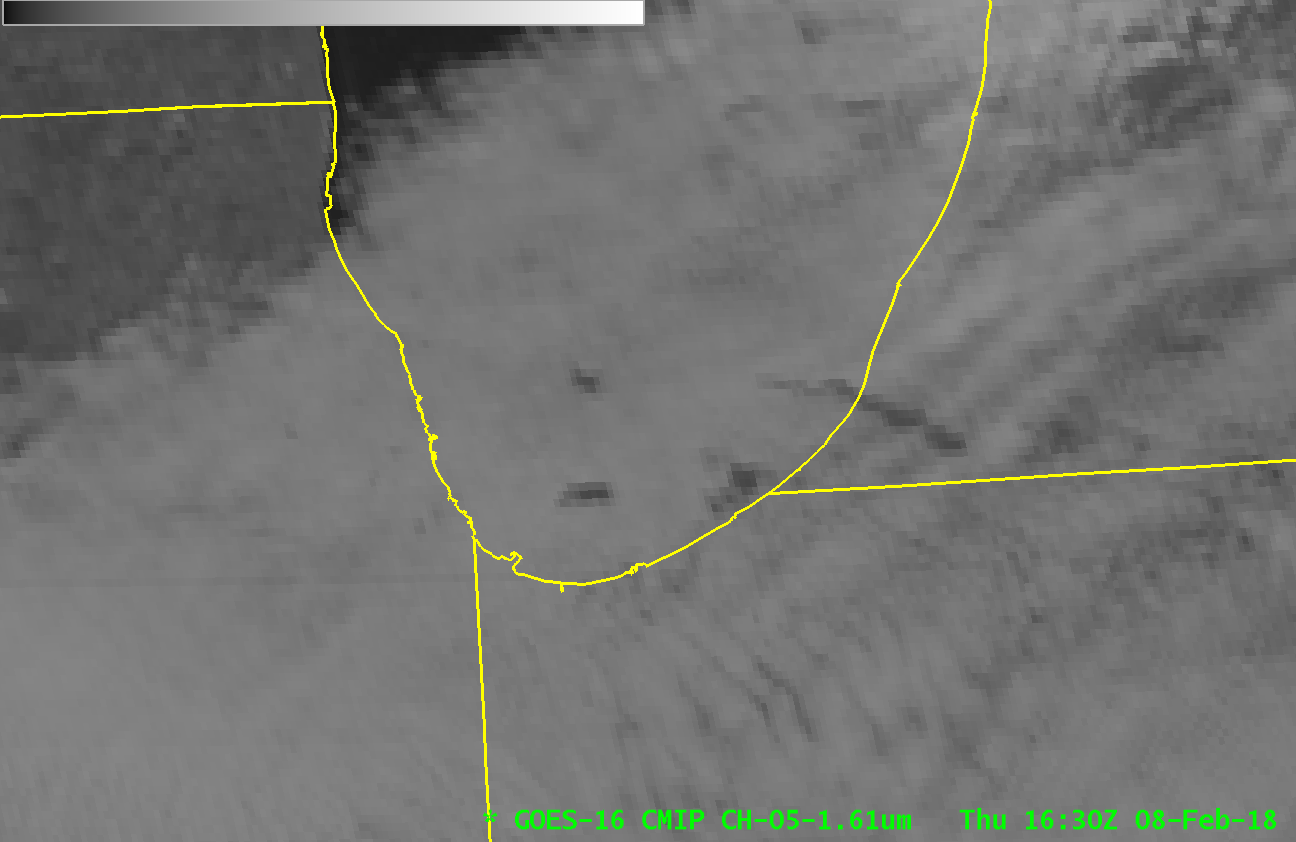
The animation above shows visible imagery from GOES-16 (0.64 µm) over Pennsylvania on 8 February 2018. Northwest flow over the ridges of the Appalachians is causing stable waves clouds that are parallel to the topography. However, the animation shows point sources over Somerset and Cambria counties — in southwestern Pennsylvania — that are changing the character of the clouds and disrupting the linear cloud features. The animation of the GOES-16 ABI 1.61 µm “Snow/Ice” channel, below, shows that the point sources are causing glaciation in the clouds. Glaciated clouds contain ice, and ice strongly absorbs energy at 1.61 µm, so glaciated clouds appear dark. The point sources, likely smokestacks, are perturbing the flow and likely introducing freezing nuclei into the supercooled clouds. As a result, supercooled cloud liquid water droplets freeze. The toggle between visible 0.64 µm and near-infrared 1.61 µm at 1312 UTC and at 1402 UTC suggests that different smokestacks are operating at different times of the day. Note that later in the animations, mid-level clouds move in that obscure the view of the lowest clouds.
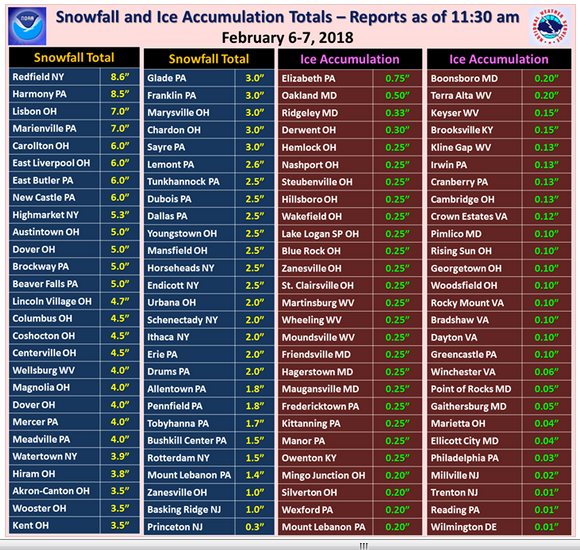
In addition to glaciated clouds, snow on the ground appears dark as well. Snow on the ground in the Susquehanna River Valley, is very bright in the 0.64 µm imagery, and darker in the 1.61 µm. The darkest regions over south central Pennsylvania and northern Maryland are likely regions where snowfall was followed by freezing rain: the layer of ice on top of the snow will absorb 1.61 µm energy more readily than the snow itself. This chart from the National Weather Service Eastern Region shows ice accumulations less than 0.10″ in that region.
GOES-16 ABI 1.61 µm Near-Infrared Imagery, 1222 – 1712 UTC on 8 February 2018 (Click to animate)
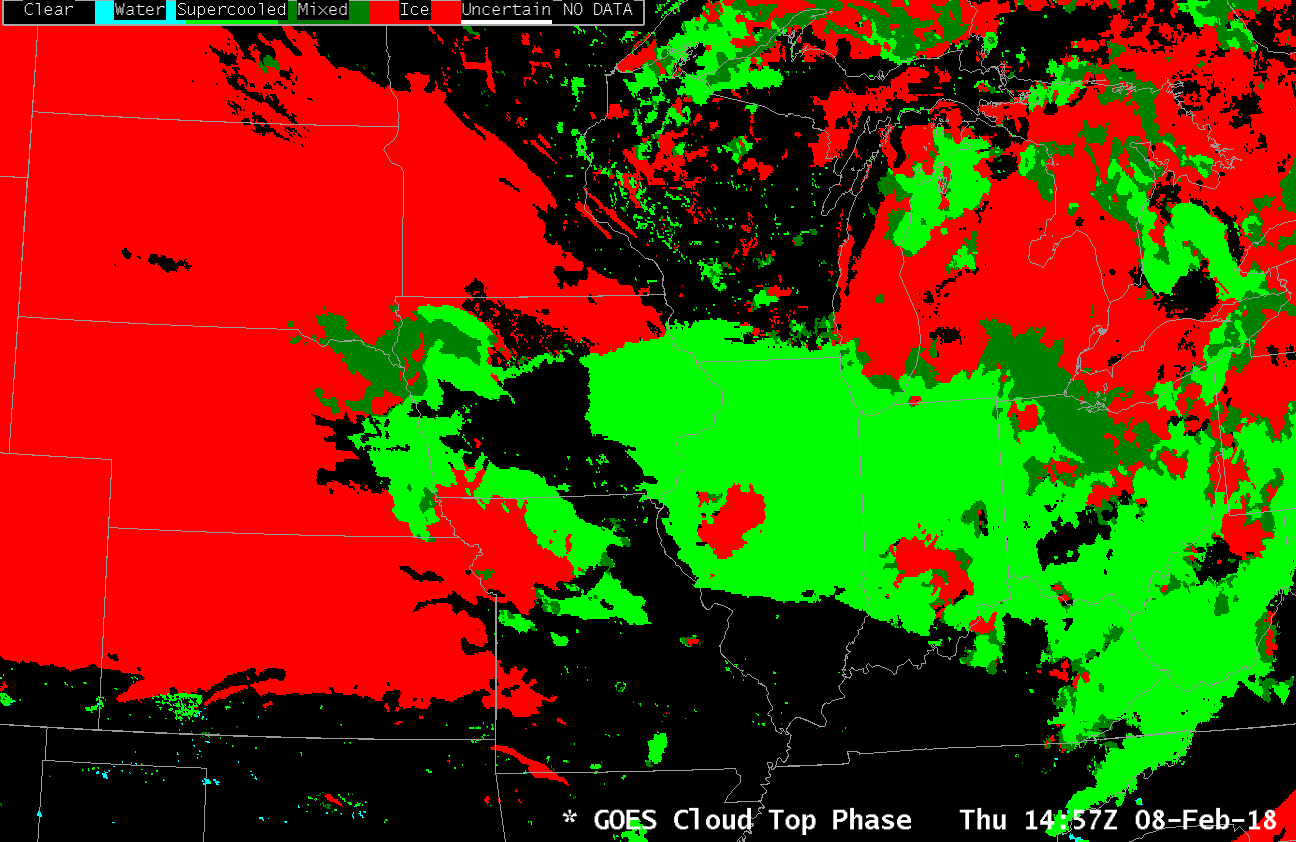
There is a GOES-16 Baseline Product that determines cloud-top phase. The toggle below, showing imagery 1412 UTC on 8 February, suggests a change from supercooled (bright green) to mixed phase (dark green) to ice (red) in the region. The 2-km native resolution of the Cloud Phase product (ATBD can be read here) vs. 1-km for 1.61 µm (and 0.5-km for 0.64 µm ) might account for some of the differences between what the 1.61 µm channel suggests over southwestern Pennsylvania and what the Cloud Phase product diagnoses. (In addition, the GOES-16 Baseline Cloud Phase product has not yet reached Provisional Maturity Status).
GOES-16 Baseline Cloud Phase Product and GOES-16 Snow/Ice 1.61 µm Near-Infrared Imagery, 1412 UTC on 8 February 2018. (Click to enlarge)
So, glaciation of clouds can be induced as shown above by turbulence/freezing nuclei introduced by large smokestacks. The 1-minute animations below shows a region of supercooled clouds from 1515 UTC to 1715 UTC. Note the periodic appearance of hole-punch clouds. In this case, aircraft to/from Chicago O’Hare are likely penetrating the thin supercooled cloud layer, and the passage of the planes is causing glaciation. The clouds within the hole punch cloud are glaciated, and therefore dark in the 1.61 µm imagery: energy at that wavelength is absorbed, not reflected as happens in the visible wavelengths.
Ice in Lake Michigan is visible in the 0.64 µm, but not apparent in the 1.61 µm. Lake Ice and water both absorb 1.61 µm energy. Lake ice reflects 0.64 µm energy.
GOES-16 ABI Visible (0.64 µm) Imagery, 1515-1715 UTC on 8 February 2018 (Click to animate)
GOES-16 ABI Near-Infrared “Snow/Ice” (1.61 µm) Imagery, 1515-1715 UTC on 8 February 2018 (Click to animate)
View only this post
Read Less

![Aqua MODIS True Color RGB image [click to enlarge]](https://cimss.ssec.wisc.edu/satellite-blog/wp-content/uploads/sites/5/2018/02/180208_1850utc_aqua_modis_truecolor_Argentina_anim.gif)
![Aqua MODIS True-color and Infrared Window (11.0 µm) images [click to enlarge]](https://cimss.ssec.wisc.edu/satellite-blog/wp-content/uploads/sites/5/2018/02/180208_1850utc_aqua_modis_truecolor_ir_worldview_anim.gif)
![Time series of surface observations at Córdoba, Argentina [click to enlarge]](https://cimss.ssec.wisc.edu/satellite-blog/wp-content/uploads/sites/5/2018/02/180208_SACO_SFCMG.GIF)
![GOES-16 Upper-level (6.2 µm, top), Mid-level (6.9 µm, middle) and Low-level (7.3 µm) images [click to play animation]](https://cimss.ssec.wisc.edu/satellite-blog/wp-content/uploads/sites/5/2018/02/180206_goes16_water_vapor_Falcon_Heavy_anim.gif)
![GOES-16 Upper-level (6.2 µm, top), Mid-level (6.9 µm, middle) and Shortwave Infrared (3.9 µm, bottom) image [click to enlarge]](https://cimss.ssec.wisc.edu/satellite-blog/wp-content/uploads/sites/5/2018/02/G16_WATER_VAPOR_SWIR_FALCON_HEAVY_06FEB2018_380x1280_B897_2018037_204728_0003PANELS_00003.GIF)
![GOES-16 Low-level (7.3 µm) Water Vapor images [click to play animation]](https://cimss.ssec.wisc.edu/satellite-blog/wp-content/uploads/sites/5/2018/02/180206_goes16_water_vapor_band10_Great_Lakes_anim.gif)
![Weighting function plots for the three GOES-16 Water Vapor bands, calculated using rawinsonde data from Green Bay, Wisconsin [click to enlarge]](https://cimss.ssec.wisc.edu/satellite-blog/wp-content/uploads/sites/5/2018/02/180206_12utc_kgrb_wv_wf.jpeg)
![Weighting function plots for the three GOES-16 Water Vapor bands, calculated using rawinsonde data from Gaylord, Michigan [click to enlarge]](https://cimss.ssec.wisc.edu/satellite-blog/wp-content/uploads/sites/5/2018/02/180206_12utc_kapx_wv_wf.jpeg)
![GOES-16 Mid-level (6.9 µm) Water Vapor images [click to play animation]](https://cimss.ssec.wisc.edu/satellite-blog/wp-content/uploads/sites/5/2018/02/180206_goes16_water_vapor_band9_Great_Lakes_anim.gif)

/SA2018_02_08_039_aqua.gif)
![<img class="thumbnail" src="https://cimss.ssec.wisc.edu/satellite-blog/wp-content/uploads/sites/5/2018/02/G16_VIS_NIR_FALCON_HEAVY_XMR_06FEB2018_380x1280_B215_2018037_204728_0003PANELS_00003.gif" alt="GOES-16 "Red" Visible (0.64 µm, top), Near-Infrared "Snow/Ice" (1.61 µm, middle) and Shortwave Infrared (3.9 µm, bottom) images, with plots of surface reports [click to play animation]” width=”640″ height=”480″>](https://cimss.ssec.wisc.edu/satellite-blog/wp-content/uploads/sites/5/2018/02/180206_goes16_vis_nir_Falcon_Heavy_plume_anim.gif)