
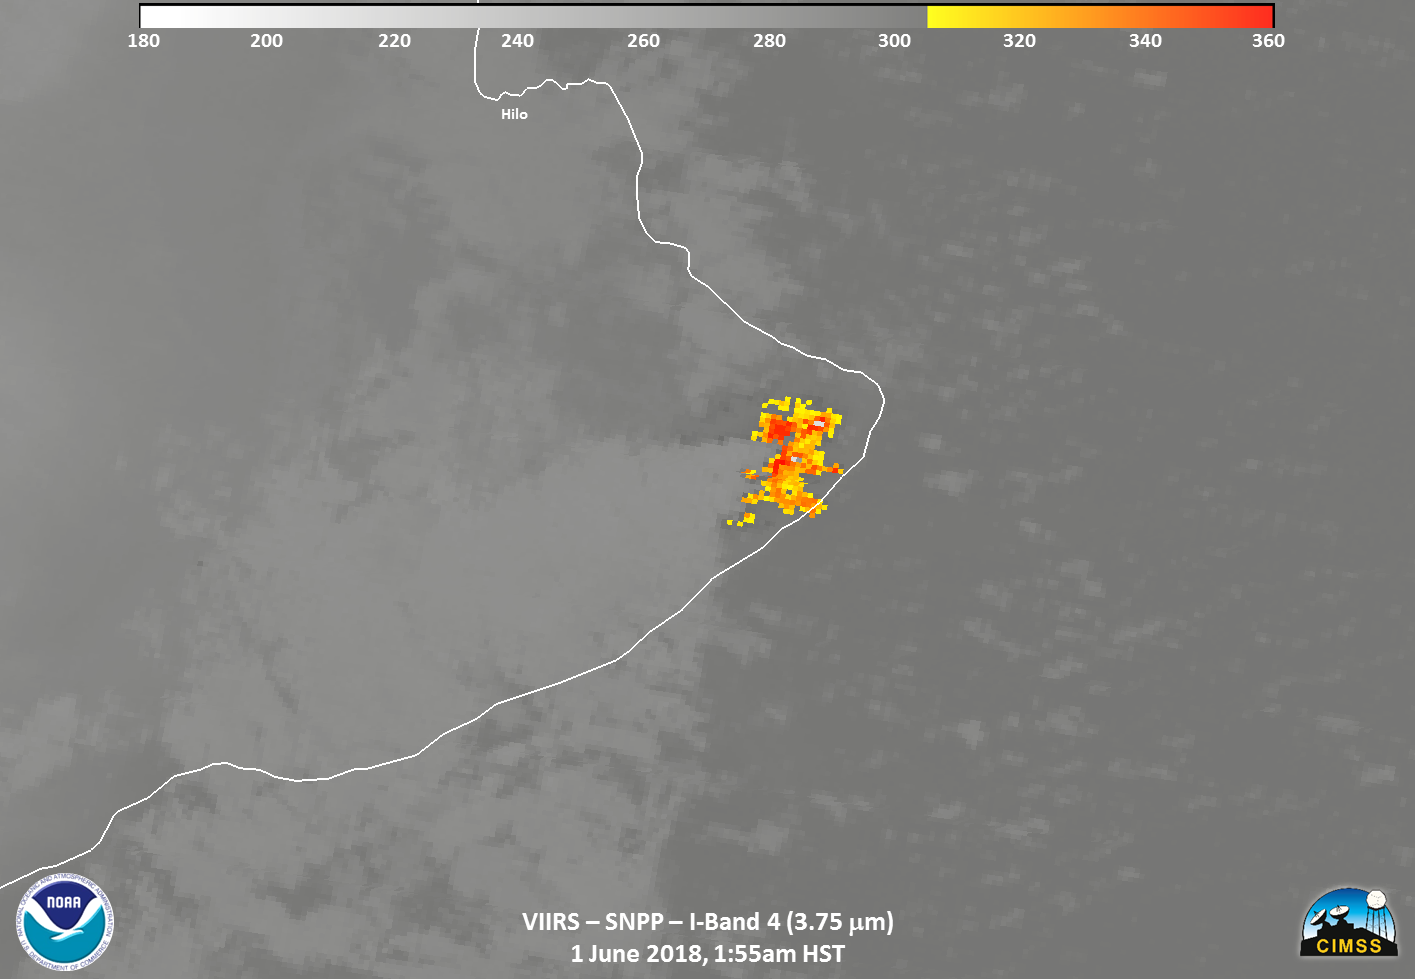
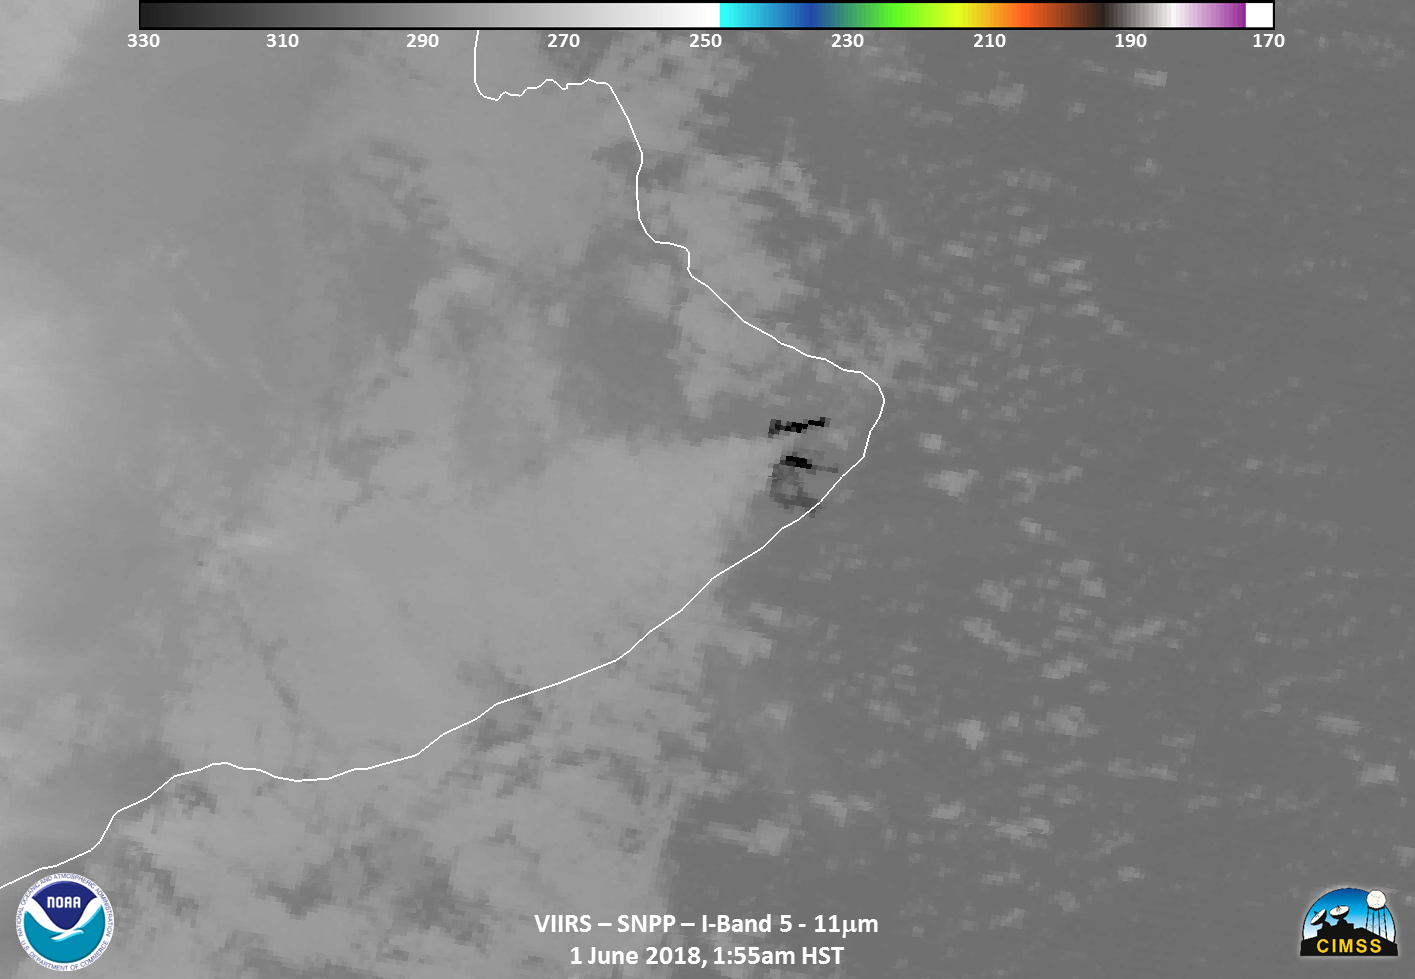
Suomi-NPP Views of the eastern tip of the island of Hawai’i at 1155 UTC on 1 June 2018. VIIRS Day Night Band Visible (0.70) and Shortwave Infrared (3.75) and Longwave Infrared (11.45) (Click to enlarge)
Early on 1 June 2018, clear skies allowed an unobstructed view of the still-erupting Kilauea from Suomi-NPP. (Orbit paths from this link). The image above steps through the Day Night Band 0.7 µm Visible Image, the 3.75 µm Shortwave Infrared, and the 11.45 µm Longwave Infrared. The warm signatures of the lava extend all the way into the ocean.
=========================================================================
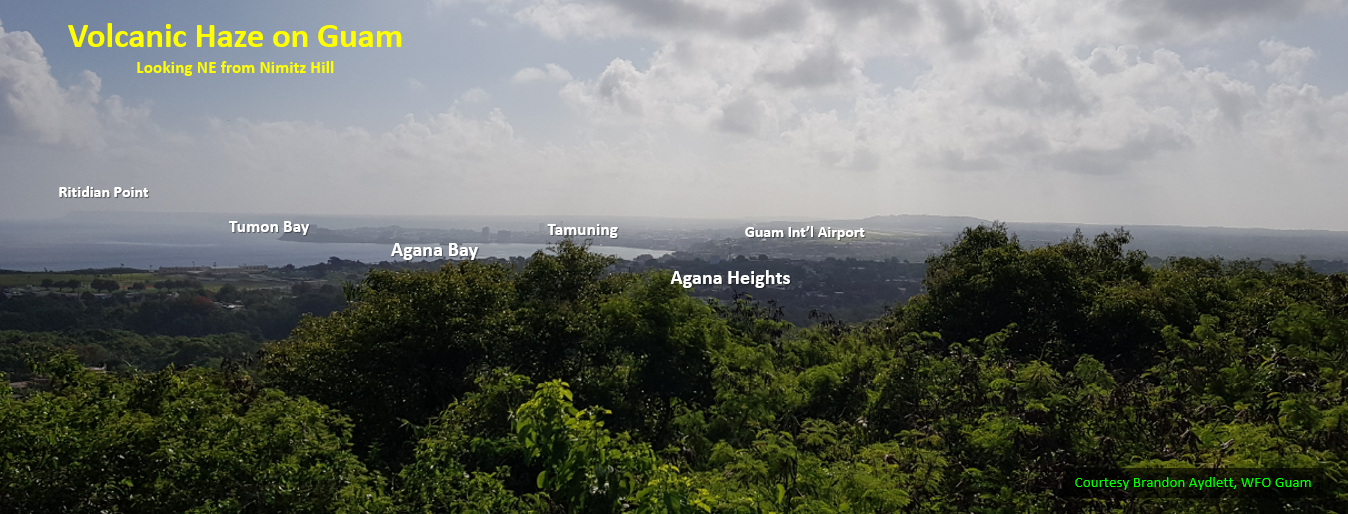
Photo showing Volcanic Haze on the Island of Guam (photo courtesy Brandon Aydlett, NWS GUM)
On 30 May 2018, hazy skies were widespread over the Mariana Islands, haze that could be traced back to Hawaii. (The picture above looks northeast from Nimitz Hill on the island of Guam).
The visible imagery below shows a pall of haze entrenched within the tropical easterlies from south and west of Hawai’i all the way across the Pacific Basin to Guam — a distance of some 4000 miles! (Himawari imagery courtesy Brandon Aydlett, NWS GUM, where the National Weather Service day begins!)

Himawari-8 Band 3 (0.64 µm) Imagery on Wednesday 30 May 2018 (Click to enlarge)
View only this post Read Less

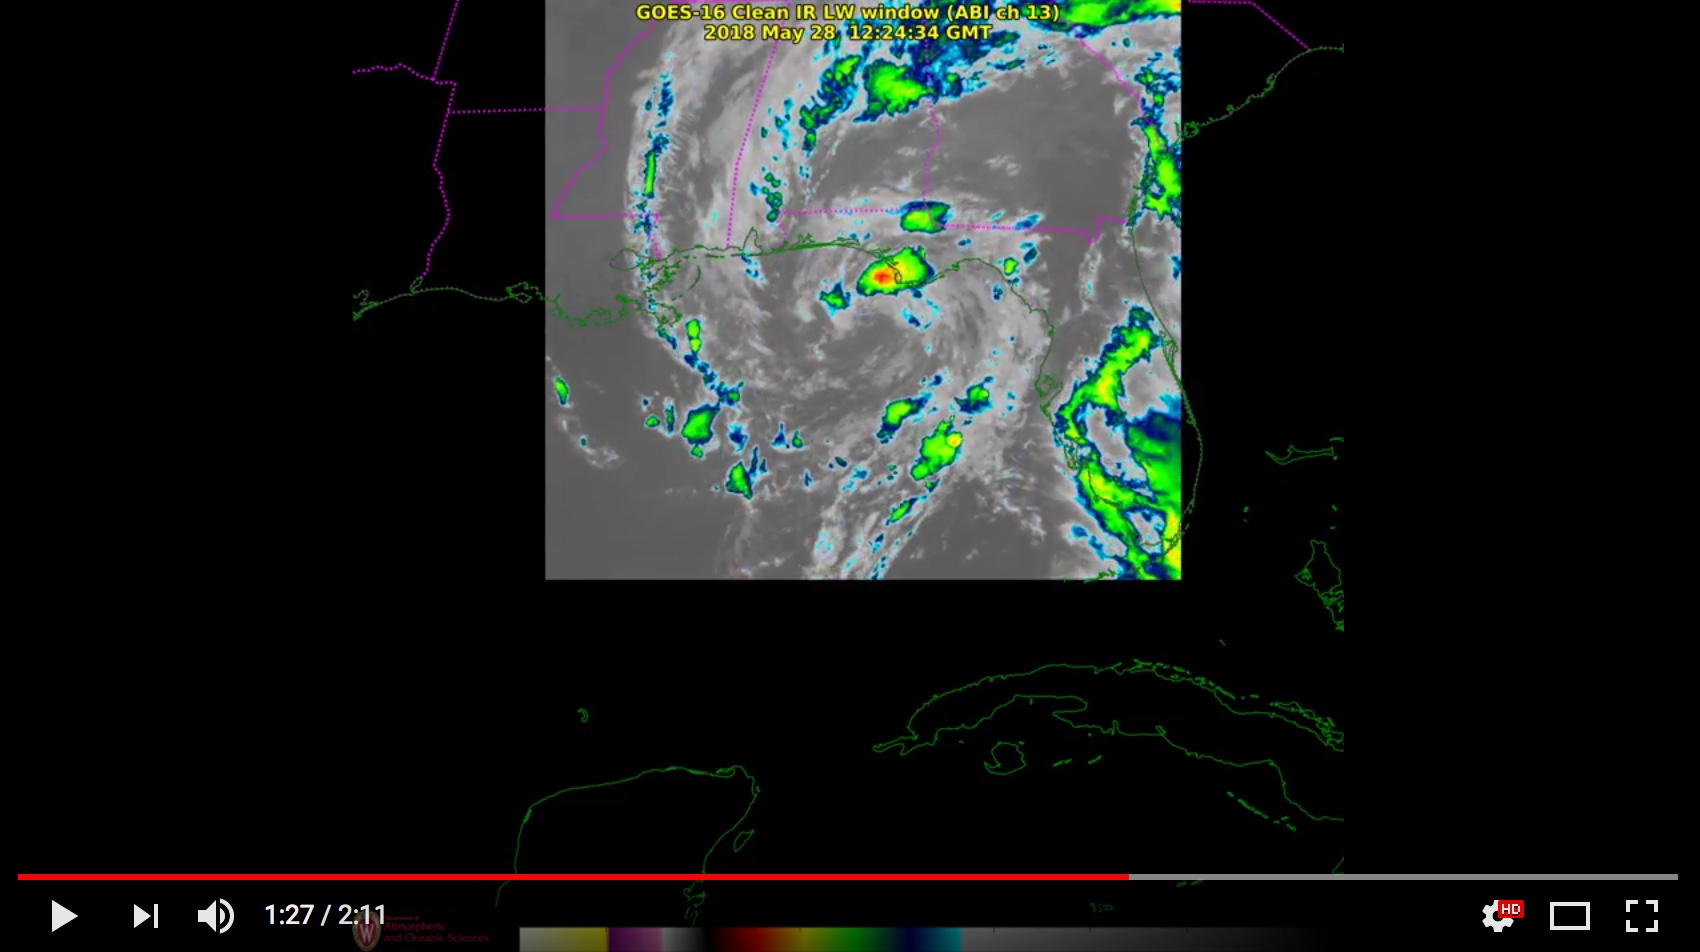
![GOES-16 Lower-level (7.3 µm, left), Mid-level (6.9 µm, center) and Upper-level (6.2 µm, right) Water Vapor images [click to play MP4 animation]](https://cimss.ssec.wisc.edu/satellite-blog/wp-content/uploads/sites/5/2018/05/G16_WATER_VAPOR_ID_SVR_31MAY2018_960x427_B1098_2018151_180228_0003PANELS_00037.GIF)
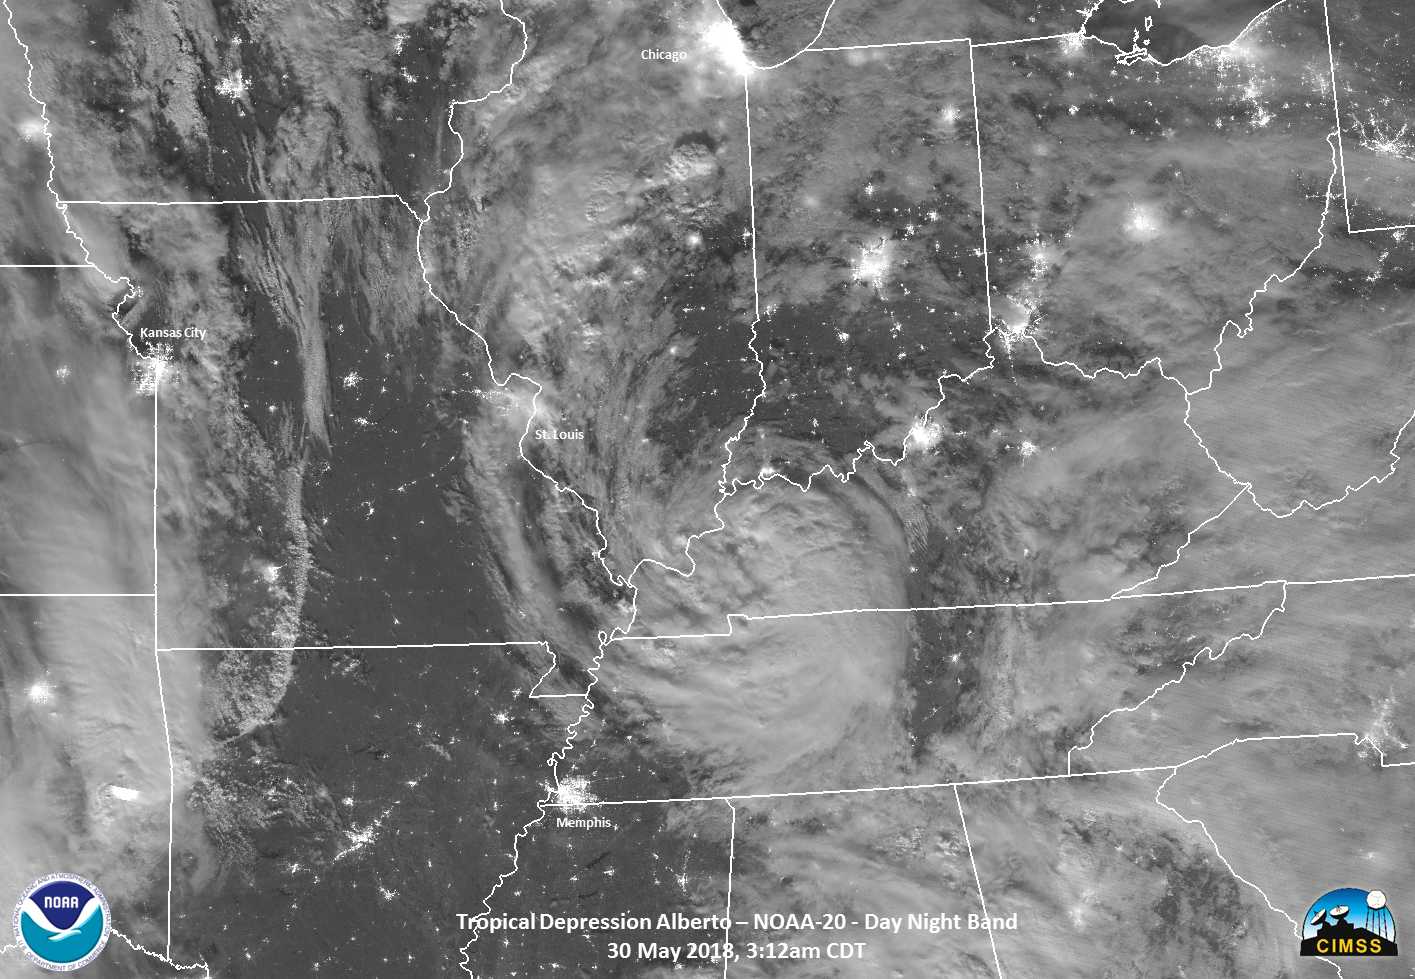


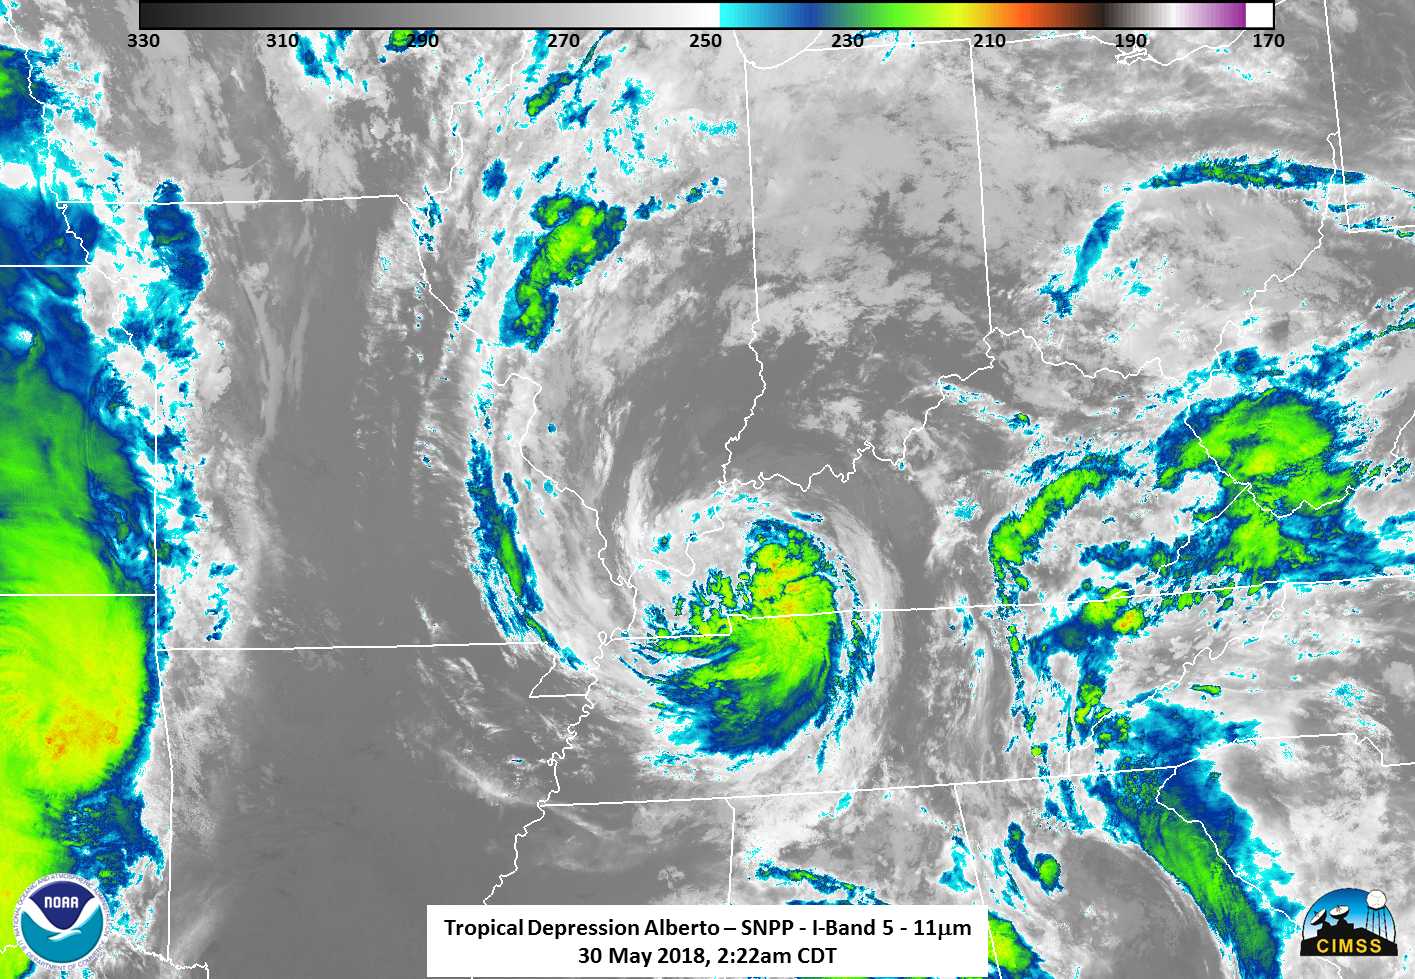
![NOAA-20 VIIRS Day/Night Band (0.7 µm) and Infrared Window (11.45 µm) images [click to enlarge]](https://cimss.ssec.wisc.edu/satellite-blog/wp-content/uploads/sites/5/2018/05/180527_noaa20_viirs_DayNightBand_Infrared_Alberto_anim.gif)
