Subtropical Storm Alberto gradually intensifies
![NOAA-20 VIIRS Day/Night Band (0.7 µm) and Infrared Window (11.45 µm) images [click to enlarge]](https://cimss.ssec.wisc.edu/satellite-blog/wp-content/uploads/sites/5/2018/05/180527_noaa20_viirs_DayNightBand_Infrared_Alberto_anim.gif)
NOAA-20 VIIRS Day/Night Band (0.7 µm) and Infrared Window (11.45 µm) images [click to enlarge]
GOES-16 (GOES-East) Low-level (7.3 µm), Mid-level (6.9 µm) and Upper-level (6.2 µm) Water Vapor images (below) revealed that dry air was wrapping into the circulation of Alberto during the day.
GOES-16 Low-level (7.3 µm, left), Mid-level (6.9 µm, center) and Upper-level (6.2 µm, right) Water Vapor images [click to play MP4 animation]
GOES-16 “Red” Visible (0.64 µm) images, with hourly plots of ship and buoy reports [click to play MP4 animation]
GOES-16 “Clean” Infrared Window (10.3 µm) images, with hourly plots of ship and buoy reports [click to play MP4 animation]
===== 29 May Update =====
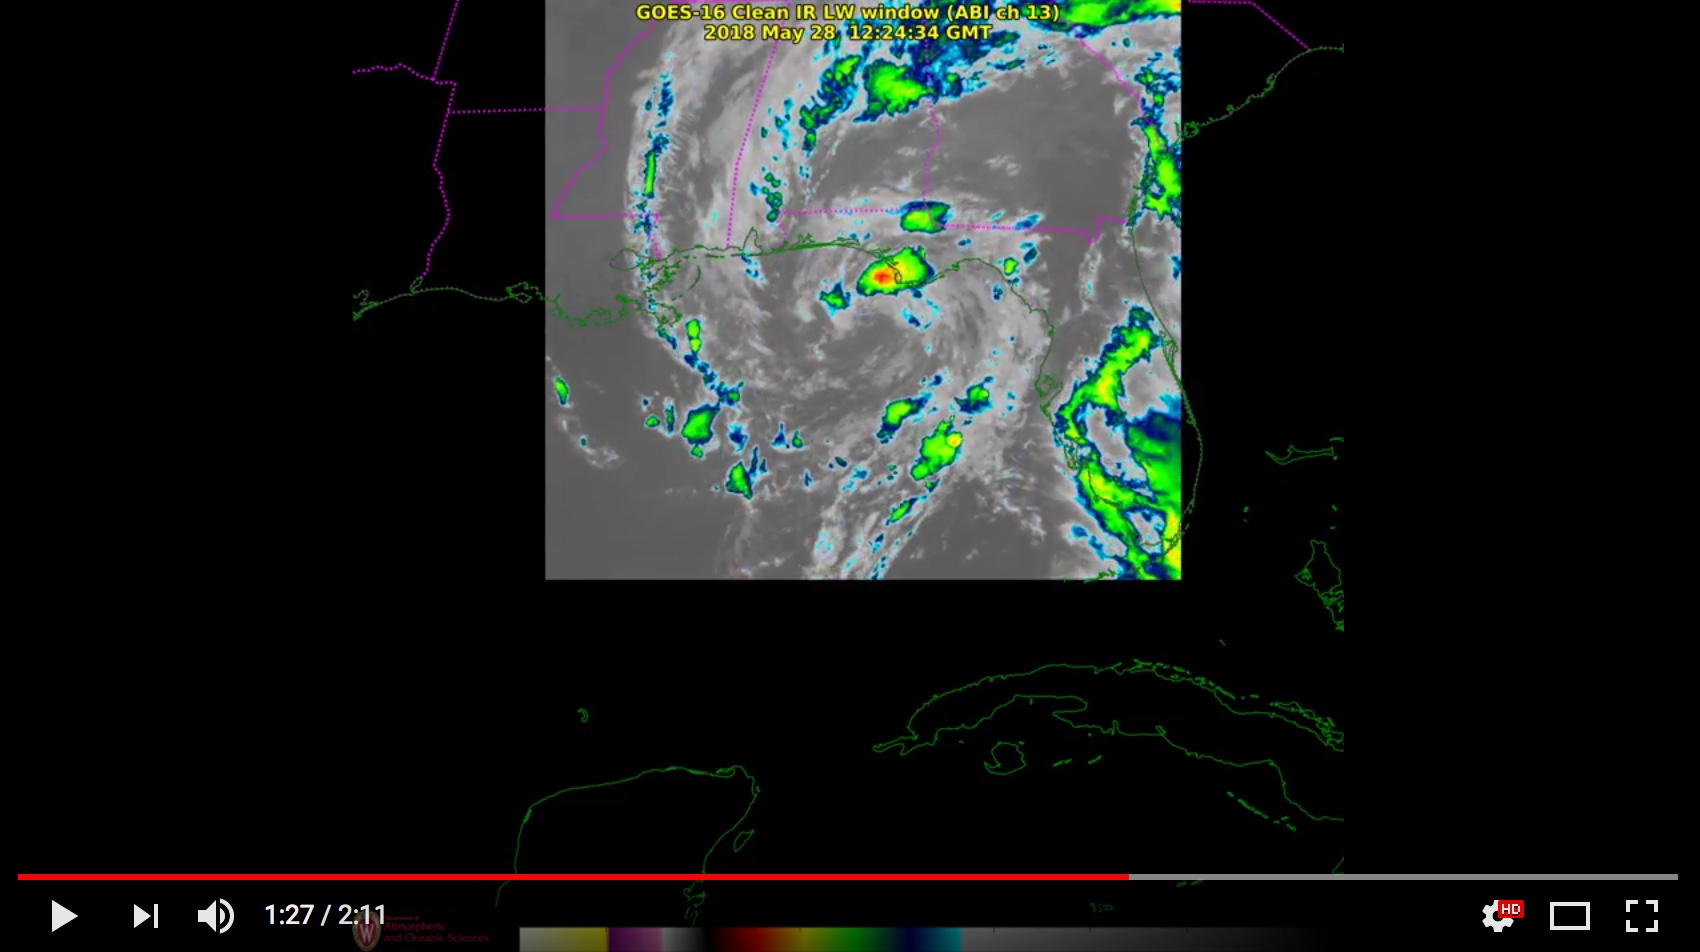
Composite of GOES-16 1-minute Mesoscale Domain Sector “Clean” Infrared Window (10.3 µm) images for the period 1630 UTC on 26 May to 1000 UTC on 29 May 2018 [click to play YouTube video]