Cyclone Mekunu in the northwest Indian Ocean was approaching Oman and Yemen on the Arabian Peninsula on 23 May 2018, as shown in the animation above. Morphed Microwave Imagery, below, (from this site) for the 24 hours ending at 1900 UTC on 23 May 2018, shows the storm at the periphery of... Read More
Meteosat-8 Infrared 10.8 µm imagery, 1630 UTC 22 May – 1715 UTC 23 May 2018 (Click to animate)
Cyclone Mekunu in the northwest Indian Ocean was approaching Oman and Yemen on the Arabian Peninsula on 23 May 2018, as shown in the animation above. Morphed Microwave Imagery, below, (from this site) for the 24 hours ending at 1900 UTC on 23 May 2018, shows the storm at the periphery of deep tropical moisture. This moisture will likely lead to devastating floods in the desert regions of Oman and Yemen as the storm approaches. (News Link 1, 2 and 3). Cyclone Chapala that affected the region in 2015 also caused devastating floods.
Microwave-based Total Precipitable Water for 24 hours ending 1900 UTC on 23 May 2018 (Click to enlarge)
Microwave imagery, below, (from this site) shows how the organization of the storm changed in the 24 hours ending around 1600 UTC on 23 May 2018. AMSU microwave imagery for this storm can be found here (off of this website).
Morphed Microwave Imagery over Mekunu for the 24 hours ending at 1600 UTC (Click to enlarge)
Satellite intensity estimates for the storm are shown below (taken from this website). The Meteosat-8 infrared animation, above, shows a periodic increase and decay in the strong convection near the center. Satellite estimates of strength (below) show a consistent lowering of the central pressure of the storm, however; winds have consistently increased.

Satellite-based estimates of Mekunu’s central pressure (Click to enlarge)
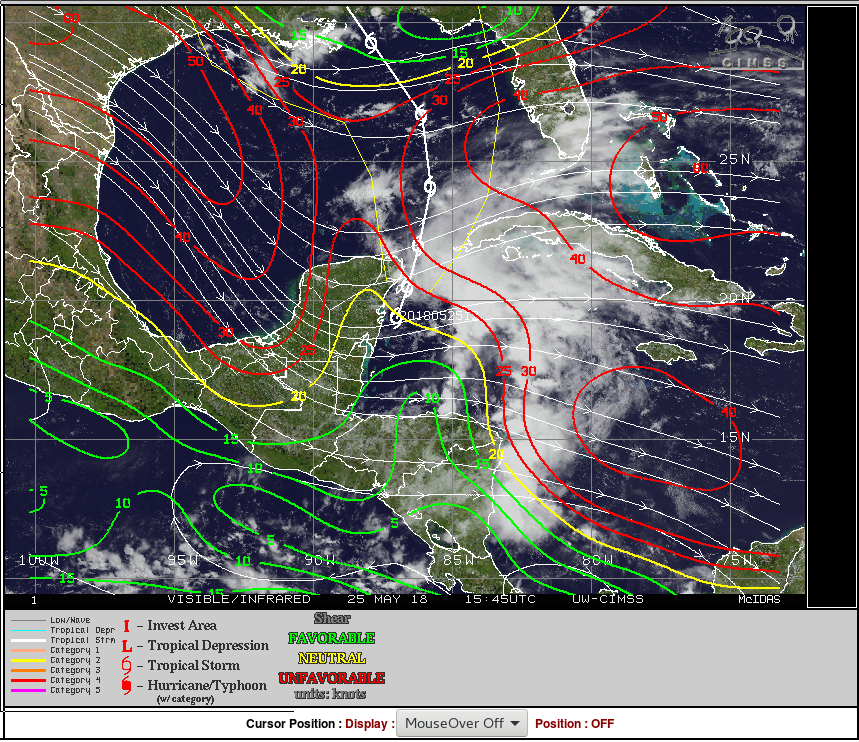
Mekunu is traversing a region with very high Sea Surface Temperatures and modest shear. Significant weakening is not forecast.
Sea Surface Temperatures and Shear over the northwest Indian Ocean (Click to enlarge)
More information on this unusual tropical cyclone can be found at the CIMSS Tropical Weather Website (link) and the CIRA Tropical Weather Website (link).
=============== Added, 24 May 2018 ==============
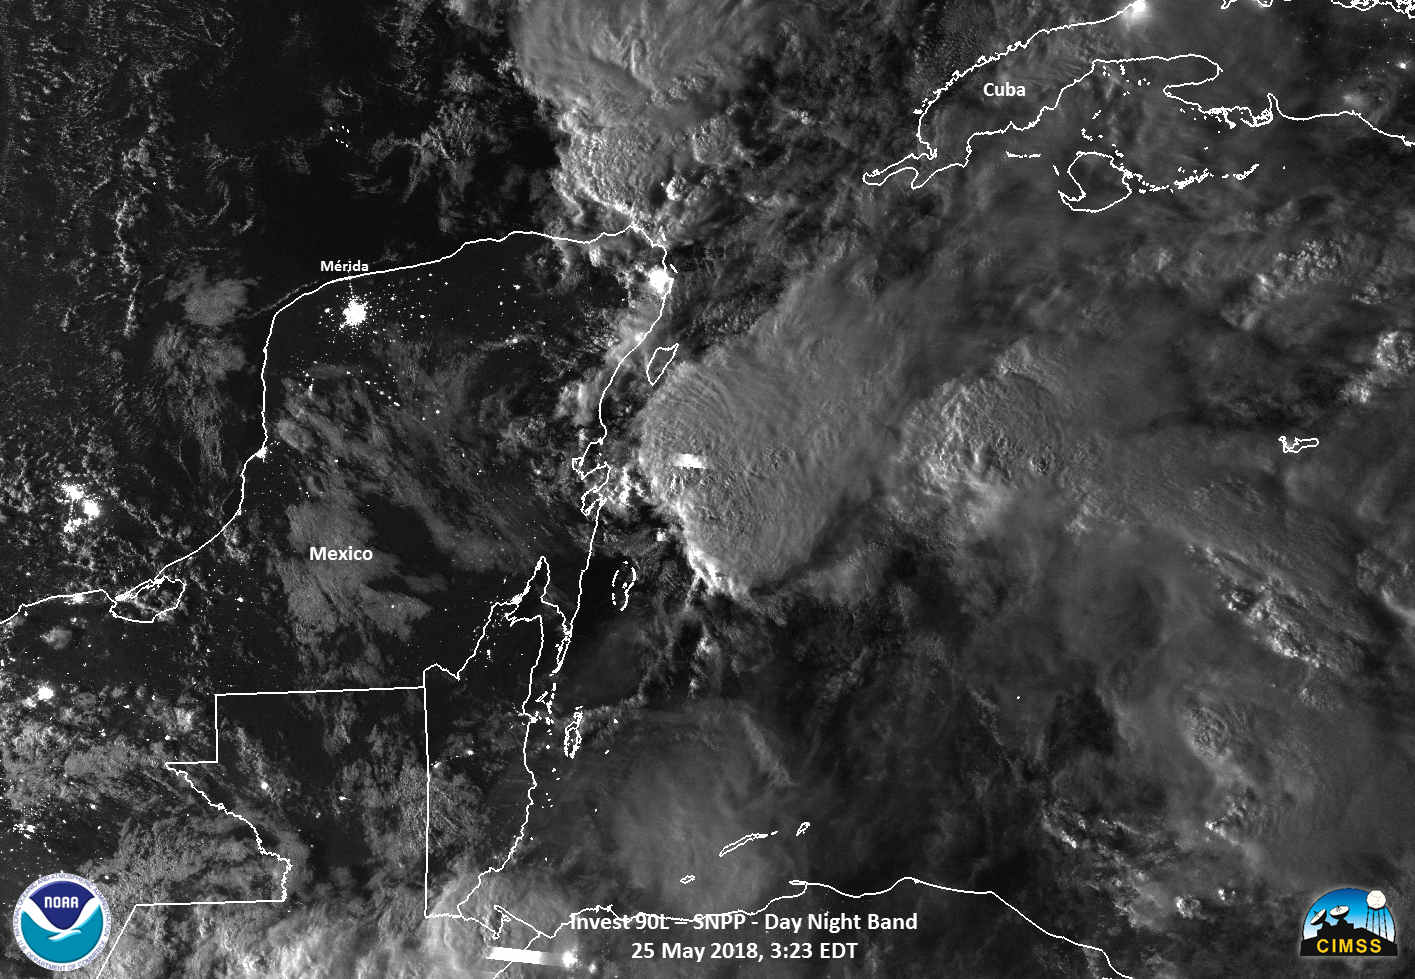
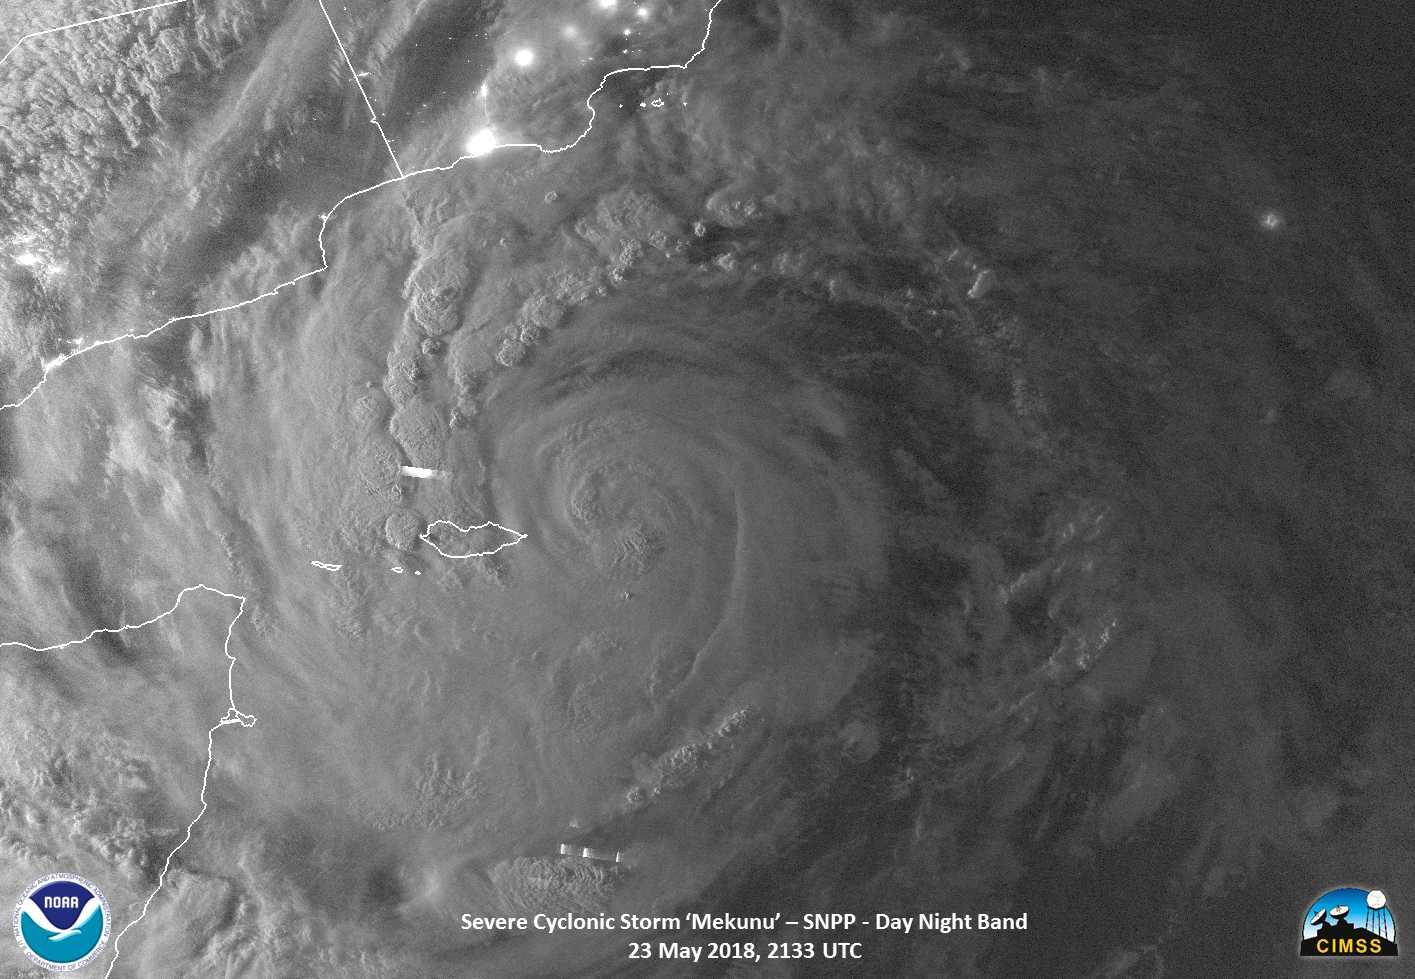
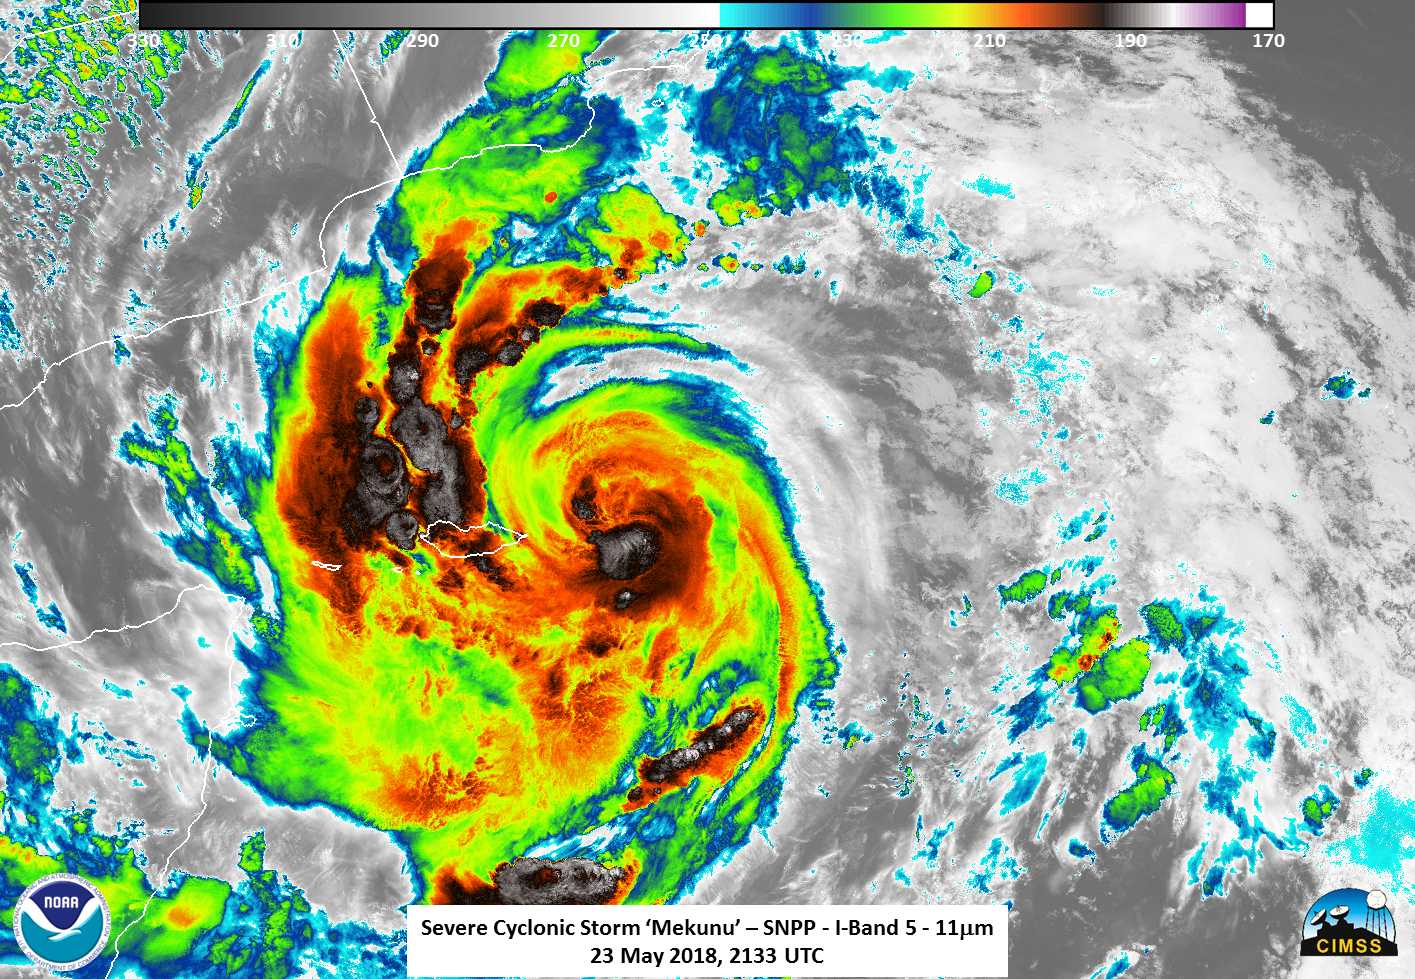
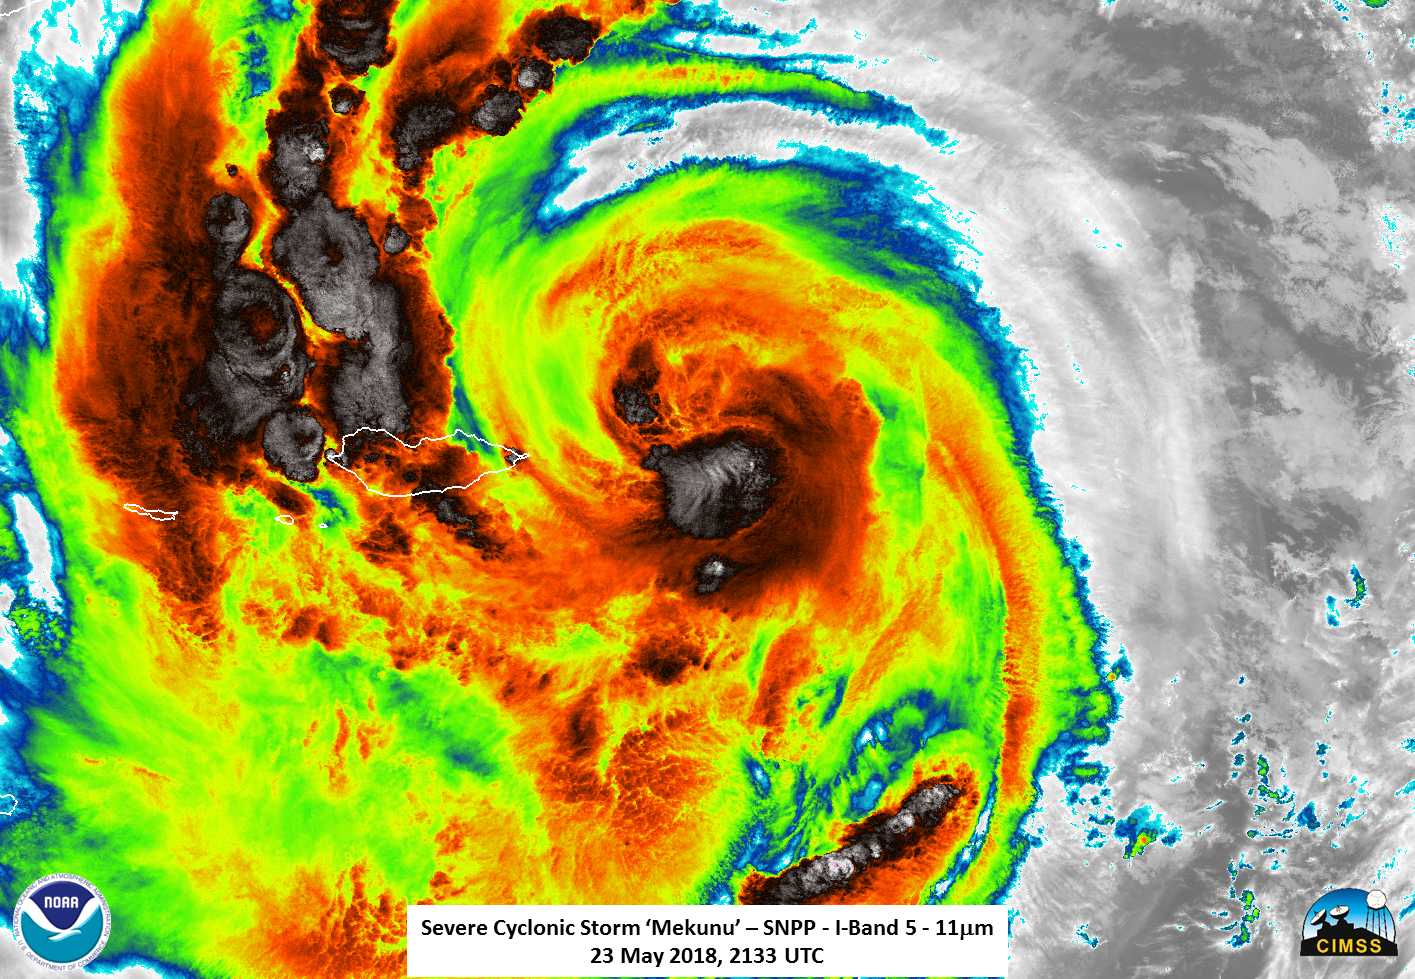
Suomi-NPP overflew Mekunu at 2133 UTC on 23 May 2018, and the toggle below (between the Day Night Band and the 11.45 µm infrared; Click here for a zoomed-in toggle between the Day Night Band and the 11.35 µm infrared image) shows the storm well-illuminated by a waxing gibbous Moon. Strong convection with lightning is apparent north of the island of Socotra. (VIIRS imagery courtesy Will Straka, CIMSS)

Suomi NPP VIIRS Infrared (11.45 µm) and Day Night Band Visible (0.70 µm) imagery over Mekunu, 2133 UTC on 23 May 2018 (Click to enlarge)
=============== Added, 25 May 2018 ==============
Mekunu is approaching the coast of Oman on 25 May 2018 from the southeast. The animation below of visible (0.6 µm, left) and Infrared (10.8 µm ,right) imagery shows a compact storm with deep convection around an eye. Microwave Imagery for the 24 hours ending at 1300 UTC on 25 May (here, from this site) suggest Mekunu is strengthening as it nears the coast. (Satellite-estimated winds and pressure also suggest strengthening near landfall).
Meteosat-8 Visible (0.6 µm, left) and Infrared (10.8 µm, right) imagery over Mekunu, 1145 UTC on 24 May to 1215 UTC on 25 May 2018 (Click to animate)
Visible Imagery from 1045 to 1430 UTC, below, suggests landfall will occur shortly after sunset east of the Oman/Yemen border. Infrared Imagery (at bottom) shows a landfall near 1800 UTC.
Meteosat-8 Visible (0.6 µm, left) imagery over Mekunu, 1045 UTC to 1430 UTC on 25 May 2018 (Click to animate)
Meteosat-8 Infrared (10.8 µm, left) imagery over Mekunu, 1415 UTC to 1830 UTC on 25 May 2018 (Click to animate)
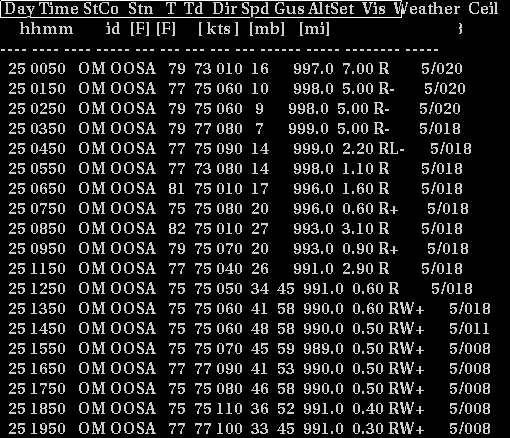
Surface observations from Salalah, in southern Oman (click here), show sustained tropical-storm force winds, with gusts to 60 knots, from the east for several hours today. Normal annual precipitation for the region is about 5″.
View only this post
Read Less
![GOES-16 Nighttime Microphysics RGB images [click to play animation | MP4]](https://cimss.ssec.wisc.edu/satellite-blog/images/2018/05/180525_goes16_nighttimeMicrophysics_TX_hail_swath_anim.gif)


![GOES-16 “Red” Visible (0.64 µm, top), Shortwave Infrared (3.9 µm, center) and “Clean” Infrared Window (10.3 µm, bottom) images, with hourly plots of surface reports [click to play MP4 animation]](https://cimss.ssec.wisc.edu/satellite-blog/wp-content/uploads/sites/5/2018/05/G16_VIS_SWIR_IR_MB_ON_PYROCB_22MAY2018_380x1280_B2713_2018142_204543_0003PANELS_00036.GIF)
![Rawinsonde data profiles from Pickle Lake, Ontario [click to enlarge]](https://cimss.ssec.wisc.edu/satellite-blog/wp-content/uploads/sites/5/2018/05/180522_CWPL_RAOBS.GIF)
![NOAA-19 Visible (0.63 µm), Shortwave Infrared (3.7 µm) and Infrared Window (10.8 µm) images [click to enlarge]](https://cimss.ssec.wisc.edu/satellite-blog/wp-content/uploads/sites/5/2018/05/180522_2210utc_noaa19_visible_shortwaveIR_IRwindow_ON_pyrocb_anim.gif)
