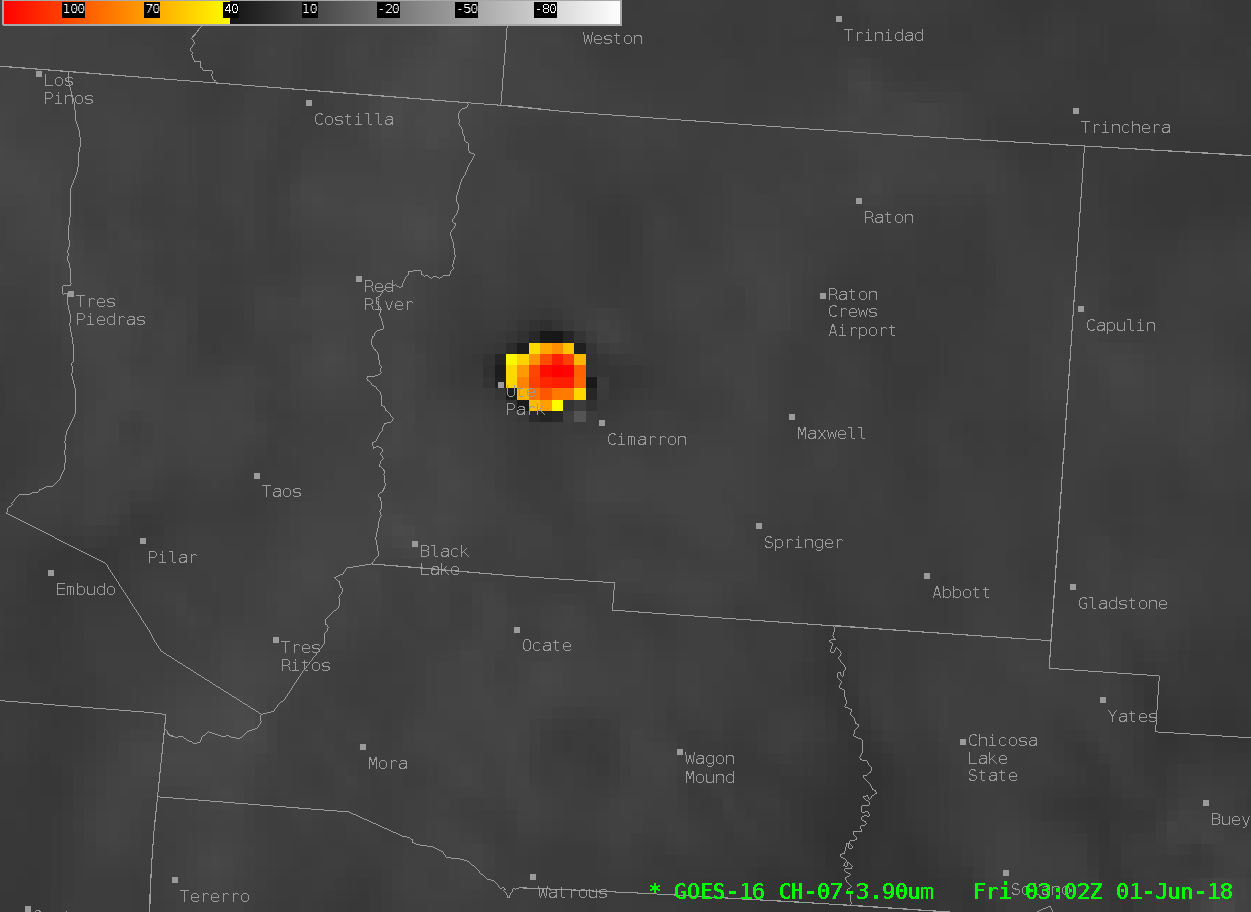
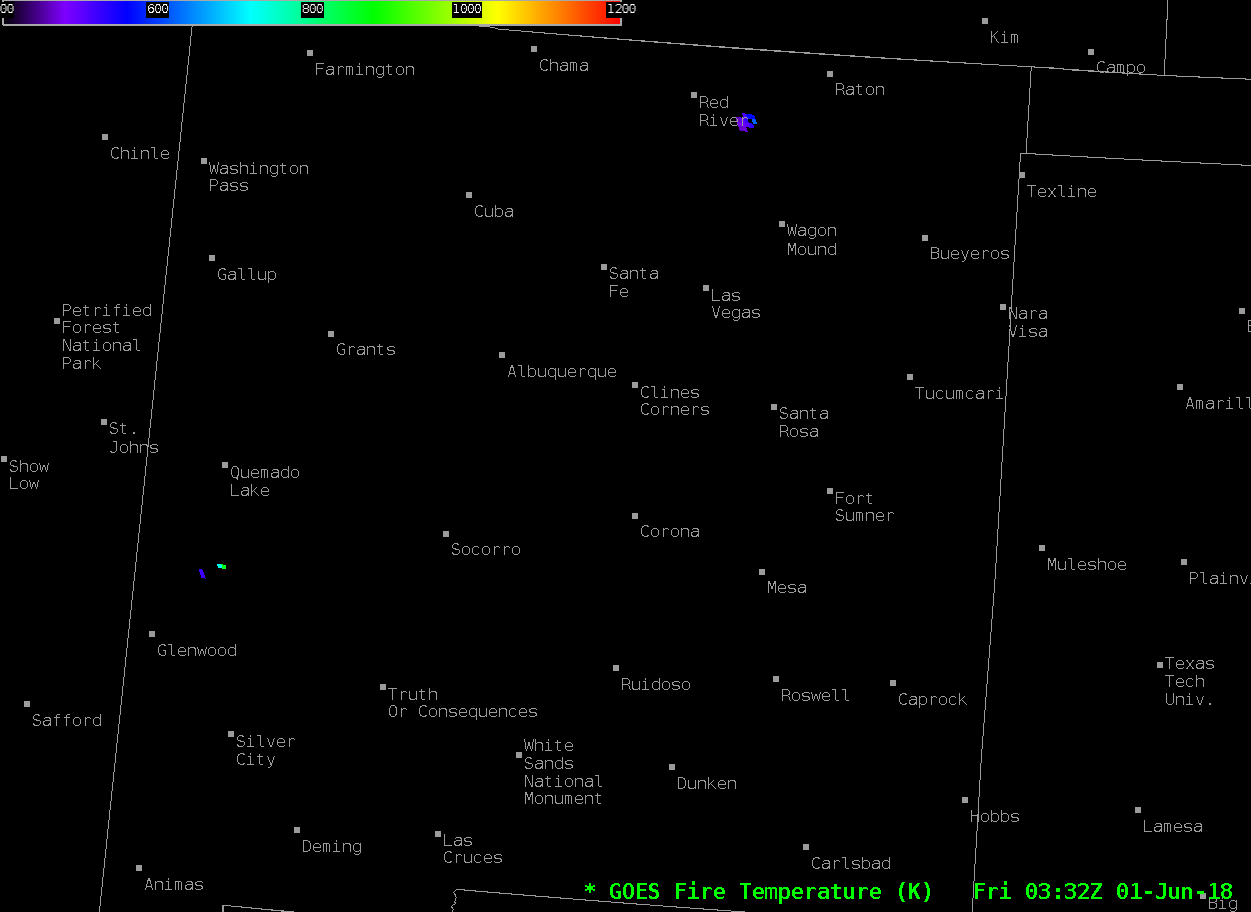
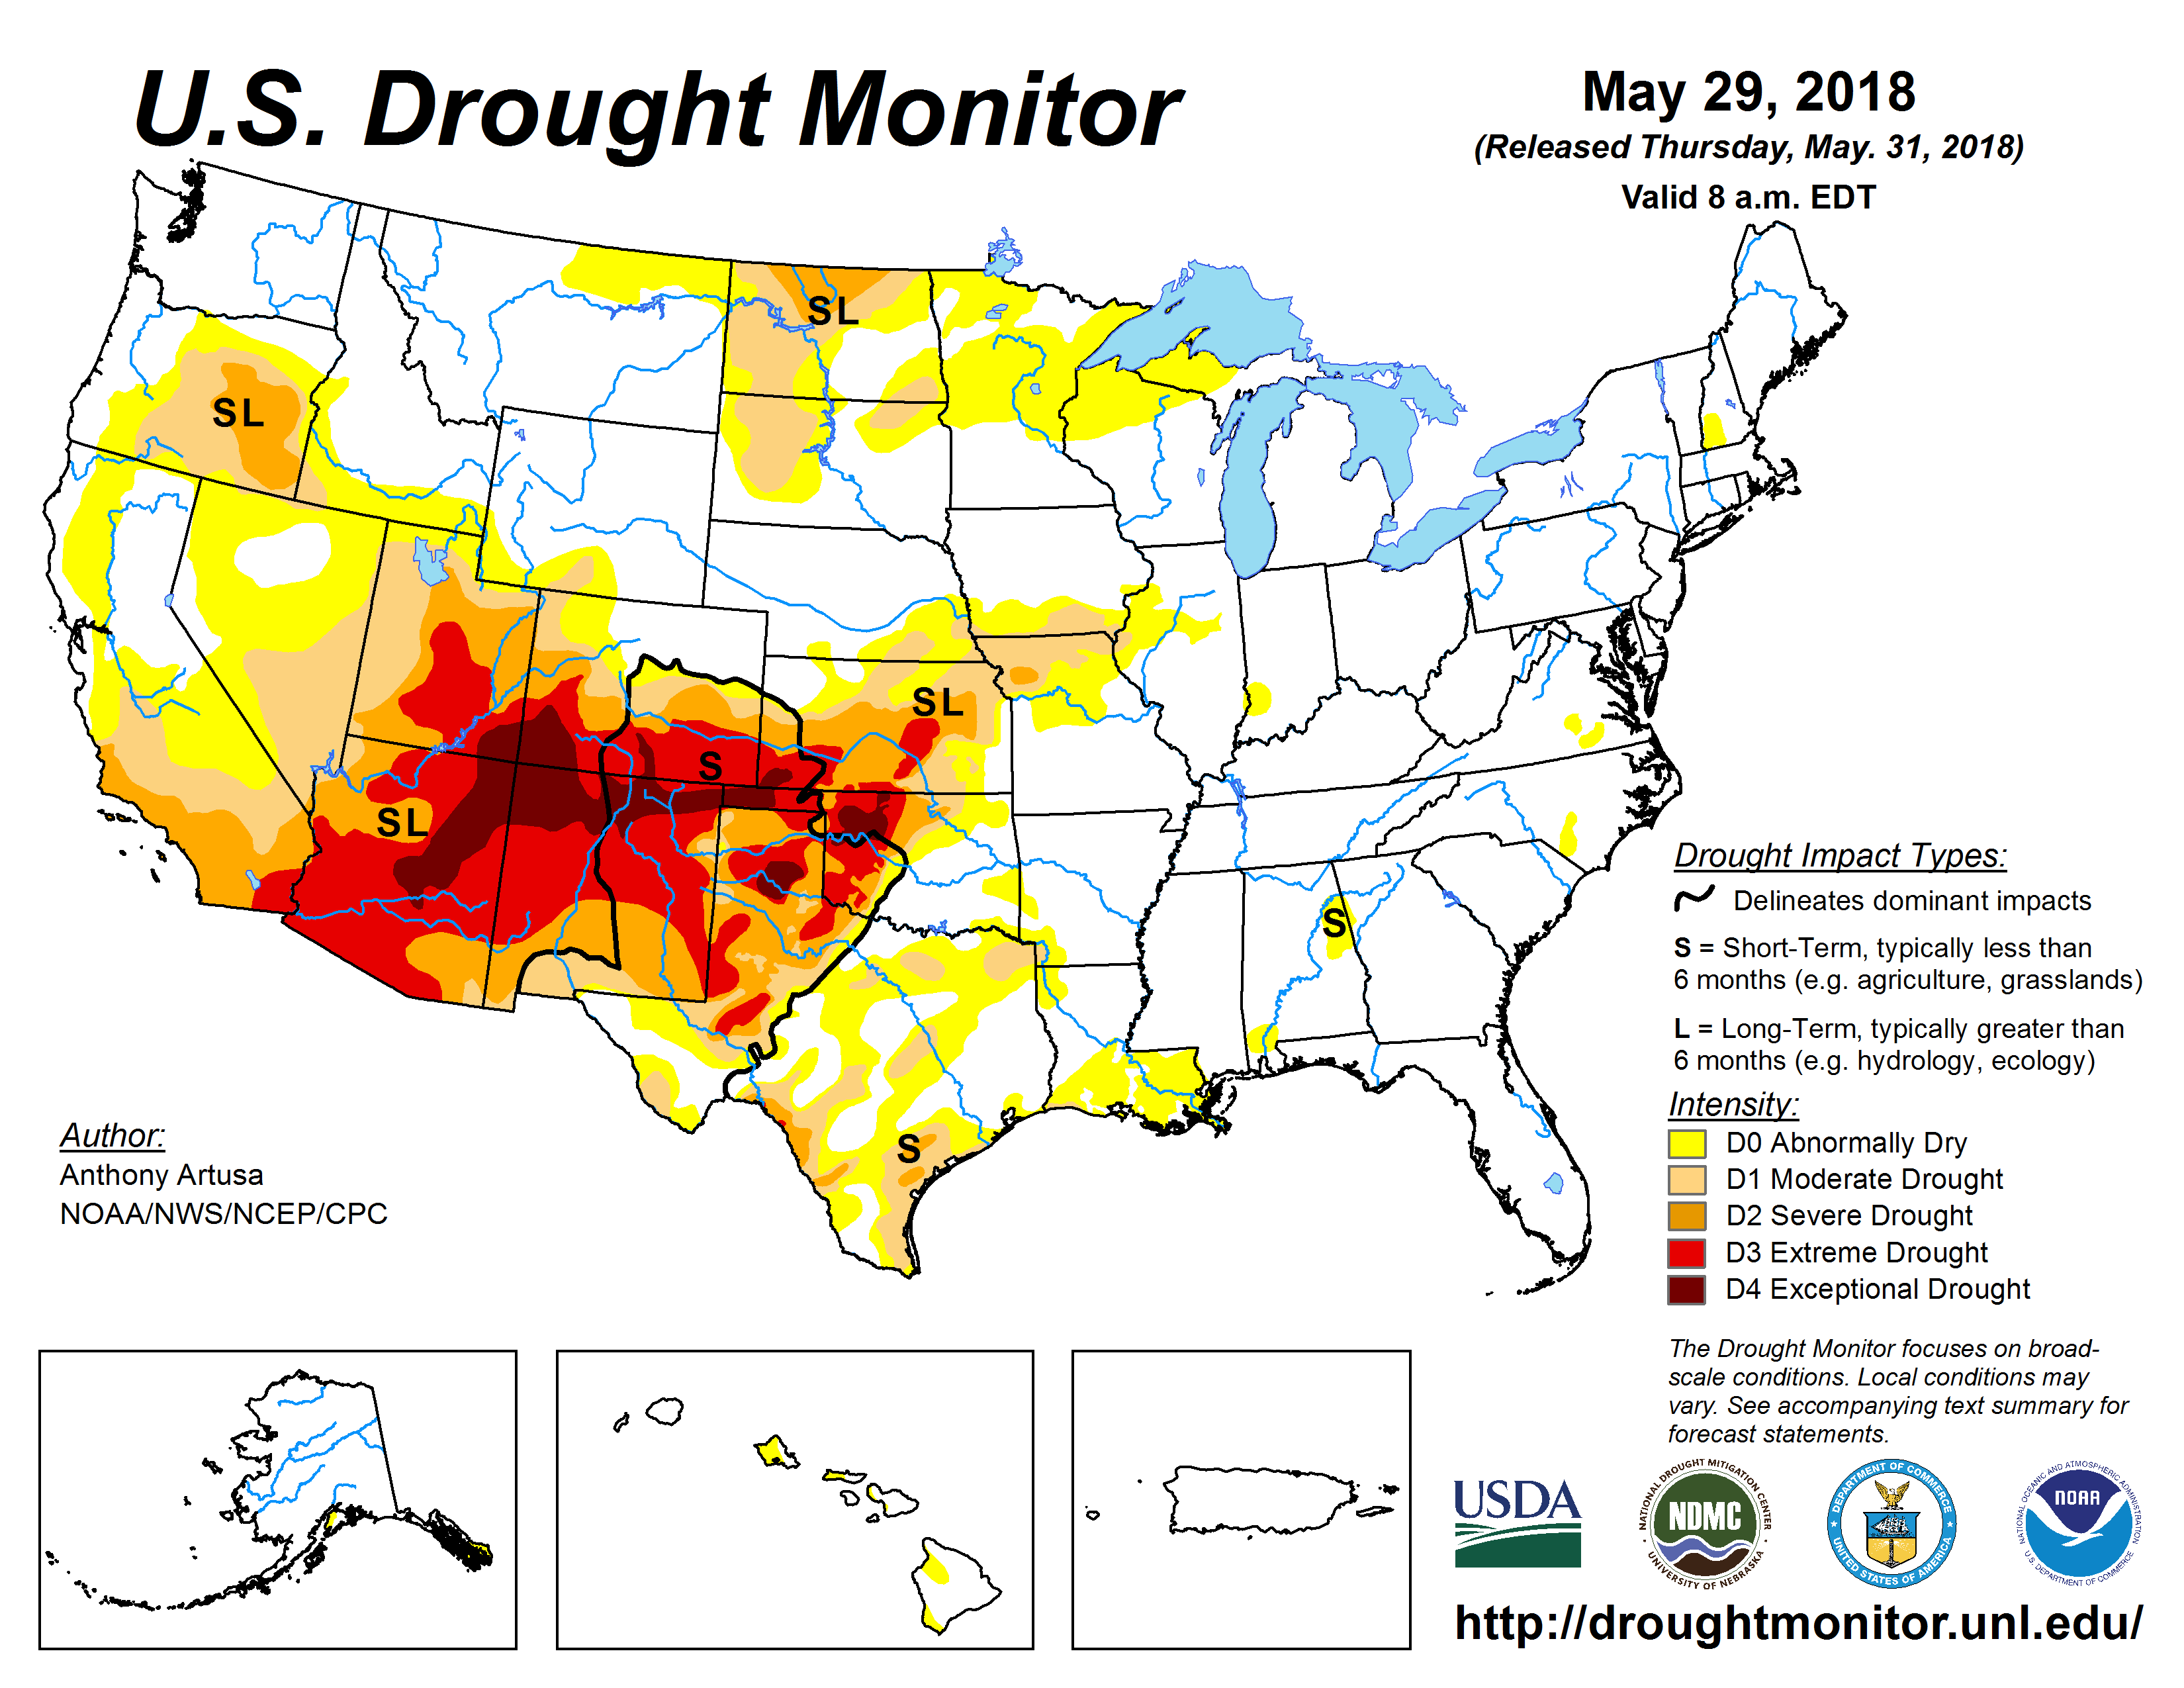
The toggle above shows the 3.9 µm brightness temperature over New Mexico at 0332 UTC on 1 June and the GOES-16 Fire Temperature Derived Product. Two areas of fires are apparent, one in the Gila National Forest in southwestern New Mexico, and one in northeast New Mexico (The Ute Park fire), in a region of extreme drought (Linked... Read More

GOES-16 Shortwave Infrared (3.9 µm) and GOES-16 Fire Temperature Product at 0332 UTC on 1 June 2018 (Click to enlarge)
The toggle above shows the 3.9 µm brightness temperature over New Mexico at 0332 UTC on 1 June and the GOES-16 Fire Temperature Derived Product. Two areas of fires are apparent, one in the Gila National Forest in southwestern New Mexico, and one in northeast New Mexico (The Ute Park fire), in a region of extreme drought (Linked image from the US Drought Monitor).
At night, as above, the location of a smoke plume can be difficult to discern. Real Earth now includes (under the ‘Fires’ folder) tiles of the HRRR Surface Smoke Forecast, as shown below in 1-hour time increments between 0600 and 1200 UTC on 1 June.

HRRR Surface Smoke Forecast, 0600-1200 UTC on 1 June 2018 (Click to animate)
The excellent temporal resolution of GOES-16 allows for close monitoring of fires. The Ute Park fire is shown below in 3.9 µm imagery, and its evolution during the night is apparent.
GOES-16 Shortwave Infrared (3.9 µm) Imagery, 0302 UTC – 1542 UTC on 1 June 2018 (Click to animate)
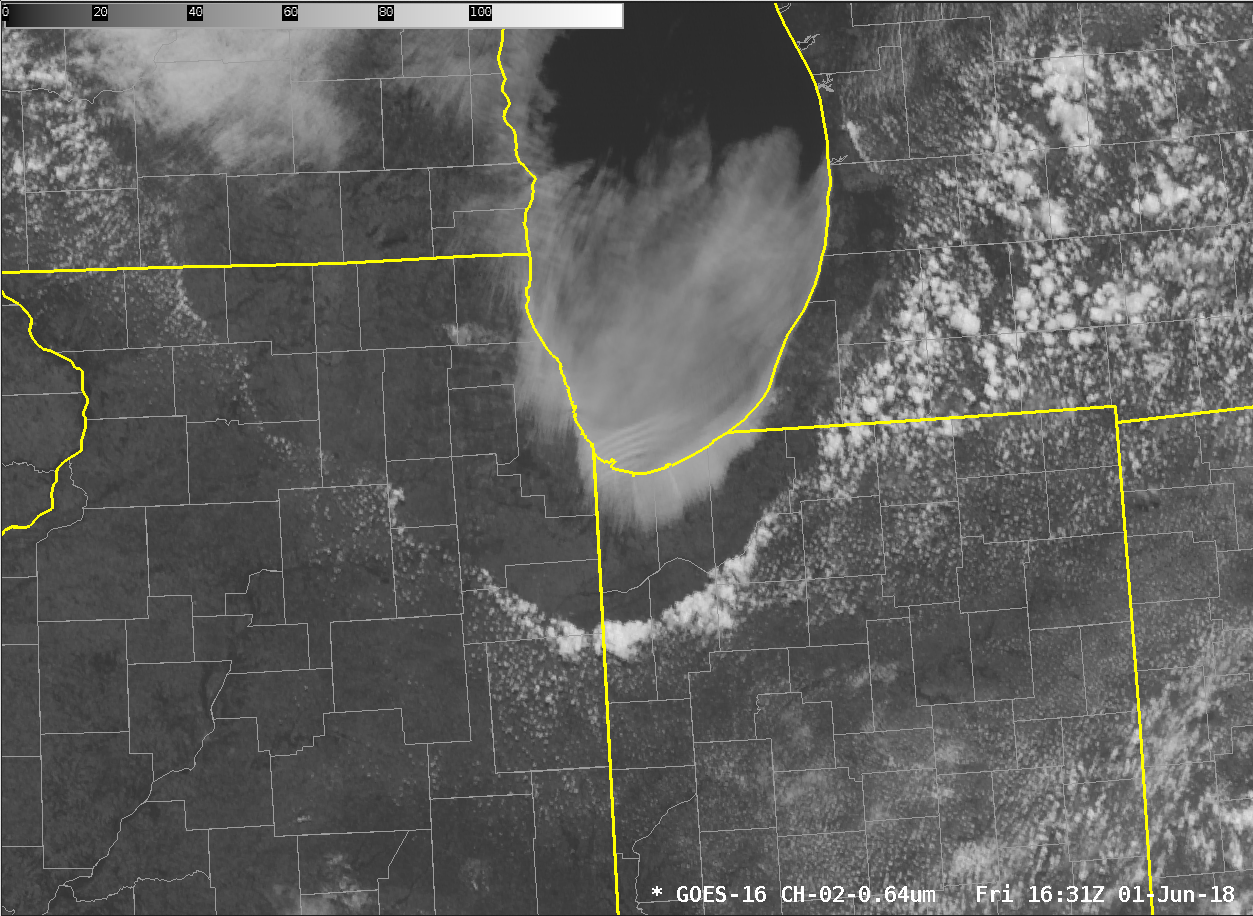
During the day, visible imagery is available to track smoke plumes. The “Blue Band” visible imagery, below (0.47 µm), from GOES-16 suggests the smoke plume from the Ute fire extends into Kansas.

GOES-16 Visible (0.47 µm) Imagery, 1237 – 1547 UTC (Click to animate)
More information on the Ute Park fire is here and here.
View only this post
Read Less

![Aqua MODIS Water Vapor (6.7 µm) and Cirrus (1.37 µm) images, with pilot reports of turbulence [click to enlarge]](https://cimss.ssec.wisc.edu/satellite-blog/wp-content/uploads/sites/5/2018/06/180602_1848utc_aqua_modis_water_vapor_cirrus_pireps_anim.gif)

![GOES-16 Mid-level Water Vapor (6.9 µm) images, with plots of SPC storm reports [click to play MP4 animation]](https://cimss.ssec.wisc.edu/satellite-blog/wp-content/uploads/sites/5/2018/06/G16_WV9_NWUS_01JUN2018_960x1280_B9_2018152_194728_0001PANEL_00094.GIF)
