The County Fire began burning in central California (northwest of Sacramento) around 2112 UTC or 2:12 pm local time on 30 June 2018 — GOES-16 (GOES-East) “Red” Visible (0.64 µm) and Shortwave Infrared (3.9 µm) images (above) showed the smoke plume and thermal anomaly or “hot spot” (dark black to red pixels) of the fire... Read More

GOES-16 “Red” Visible (0.64 µm, left) and Shortwave Infrared (3.9 µm, right) images, with airport identifiers plotted in yellow [click to play animation | MP4]
The
County Fire began burning in central California (northwest of Sacramento) around 2112 UTC or 2:12 pm local time on
30 June 2018 — GOES-16
(GOES-East) “Red” Visible (
0.64 µm) and Shortwave Infrared (
3.9 µm) images
(above) showed the smoke plume and thermal anomaly or “hot spot”
(dark black to red pixels) of the fire during its initial 6.5 hours. Other features of interest in the imagery included reflection of sunlight from solar panel farms as seen
here and
here, as well as sun glint off the waters of the Sacramento River and the Sacramento-San Joaquin River Delta as seen
here.
During the subsequent overnight hours, the thermal signature exhibited on GOES-16 Near-Infrared “Snow/Ice” (1.61 µm), Near-Infrared “Cloud Particle Size” (2.24 µm) and Shortwave Infrared (3.9 µm) images (below) revealed the rapid southward spread of the fire along the Napa/Yolo county line — the fire began in far western Yolo County, and eventually moved into far eastern Napa County. The smaller, less intense fire signature seen just to the northwest was that of the Pawnee Fire.
GOES-16 Near-Infrared “Snow/Ice” (1.61 µm, left), Near-Infrared “Cloud Particle Size” (2.24 µm, center) and Shortwave Infrared (3.9 µm, right) images, with airport identifiers plotted in yellow and Napa/Yolo County outlines plotted in blue [click to play animation | MP4]
A toggle between Suomi NPP VIIRS Day/Night Band (0.7 µm) and Shortwave Infrared (3.74 µm) images
(below) showed the thermal anomaly and bright glow of the County fire at 1043 UTC or 3:43 am local time. Due to ample illumination from the Moon
(in the Waning Gibbous phase, at 90% of Full), the smoke plume could be seen drifting southwest over the adjacent waters of the Pacific Ocean — note the shadow cast by the smoke plume upon the fog/stratus deck immediately off the coast.
![Suomi NPP VIIRS Day/Night Band (0.7 µm) and Shortwave Infrared (3.74 µm) images, with surface reports plotted in cyan [click to enlarge]](https://cimss.ssec.wisc.edu/satellite-blog/wp-content/uploads/sites/5/2018/07/180701_1043utc_suomi_npp_viirs_DayNightBand_ShortwaveInfrared_County_Fire_CA_anim.gif)
Suomi NPP VIIRS Day/Night Band (0.7 µm) and Shortwave Infrared (3.74 µm) images, with surface reports plotted in cyan [click to enlarge]
A toggle between consecutive Suomi NPP VIIRS Day/Night Band (0.7 µm) images
(below) showed the change in location of the smoke plume during the ~1 hour and 40 minutes separating the 2 satellite overpasses. The region was on the far western edge of the earlier swath. These images demonstrate the “visible image at night” capability of the VIIRS Day/Night Band.
![Suomi NPP VIIRS Day/Night Band (0.7 µm) images [click to enlarge]](https://cimss.ssec.wisc.edu/satellite-blog/wp-content/uploads/sites/5/2018/07/180701_suomi_npp_viirs_DayNightBand_County_Fire_CA_anim.gif)
Suomi NPP VIIRS Day/Night Band (0.7 µm) images [click to enlarge]
The 00 UTC
rawinsonde data from nearby Oakland
(below) showed northeasterly winds at altitudes of 1500-2800 meters or 4900-9200 feet.
![Plots of rawinsonde data from Oakland, California [click to enlarge]](https://cimss.ssec.wisc.edu/satellite-blog/wp-content/uploads/sites/5/2018/07/180701_KOAK_RAOBS.GIF)
Plots of rawinsonde data from Oakland, California [click to enlarge]
During the late morning and early afternoon of 01 July, the fire burn scar could be seen beneath the smoke plume on 250-meter resolution Terra and Aqua MODIS False Color Red-Green-Blue (RGB) images viewed using
RealEarth (below).
![Terra MODIS True Color and False Color RGB images [click to enlarge]](https://cimss.ssec.wisc.edu/satellite-blog/wp-content/uploads/sites/5/2018/07/180701_1817utc_terra_modis_truecolor_falsecolor_County_Fire_CA_anim.gif)
Terra MODIS True Color and False Color RGB images [click to enlarge]
![Aqua MODIS True Color and False Color RGB images [click to enlarge]](https://cimss.ssec.wisc.edu/satellite-blog/wp-content/uploads/sites/5/2018/07/180701_2136utc_aqua_modis_truecolor_falsecolor_County_Fire_CA_anim.gif)
Aqua MODIS True Color and False Color RGB images [click to enlarge]
===== 03 July Update =====
![Landsat-8 False Color RGB image [click to enlarge]](https://cimss.ssec.wisc.edu/satellite-blog/wp-content/uploads/sites/5/2018/07/180703_1845utc_landsat8_falsecolor_County_Fire_CA_burn_scar.jpeg)
Landsat-8 False Color RGB image [click to enlarge]
A 30-meter resolution Landsat-8 False Color RGB image
(above) showed the areal extent of the County Fire burn scar on the morning of 03 July. Pink-colored pixels indicated hot signatures of actively-burning fires. The morning
Incident Report listed the fire size at 70,000 acres and 5% containment.
View only this post
Read Less

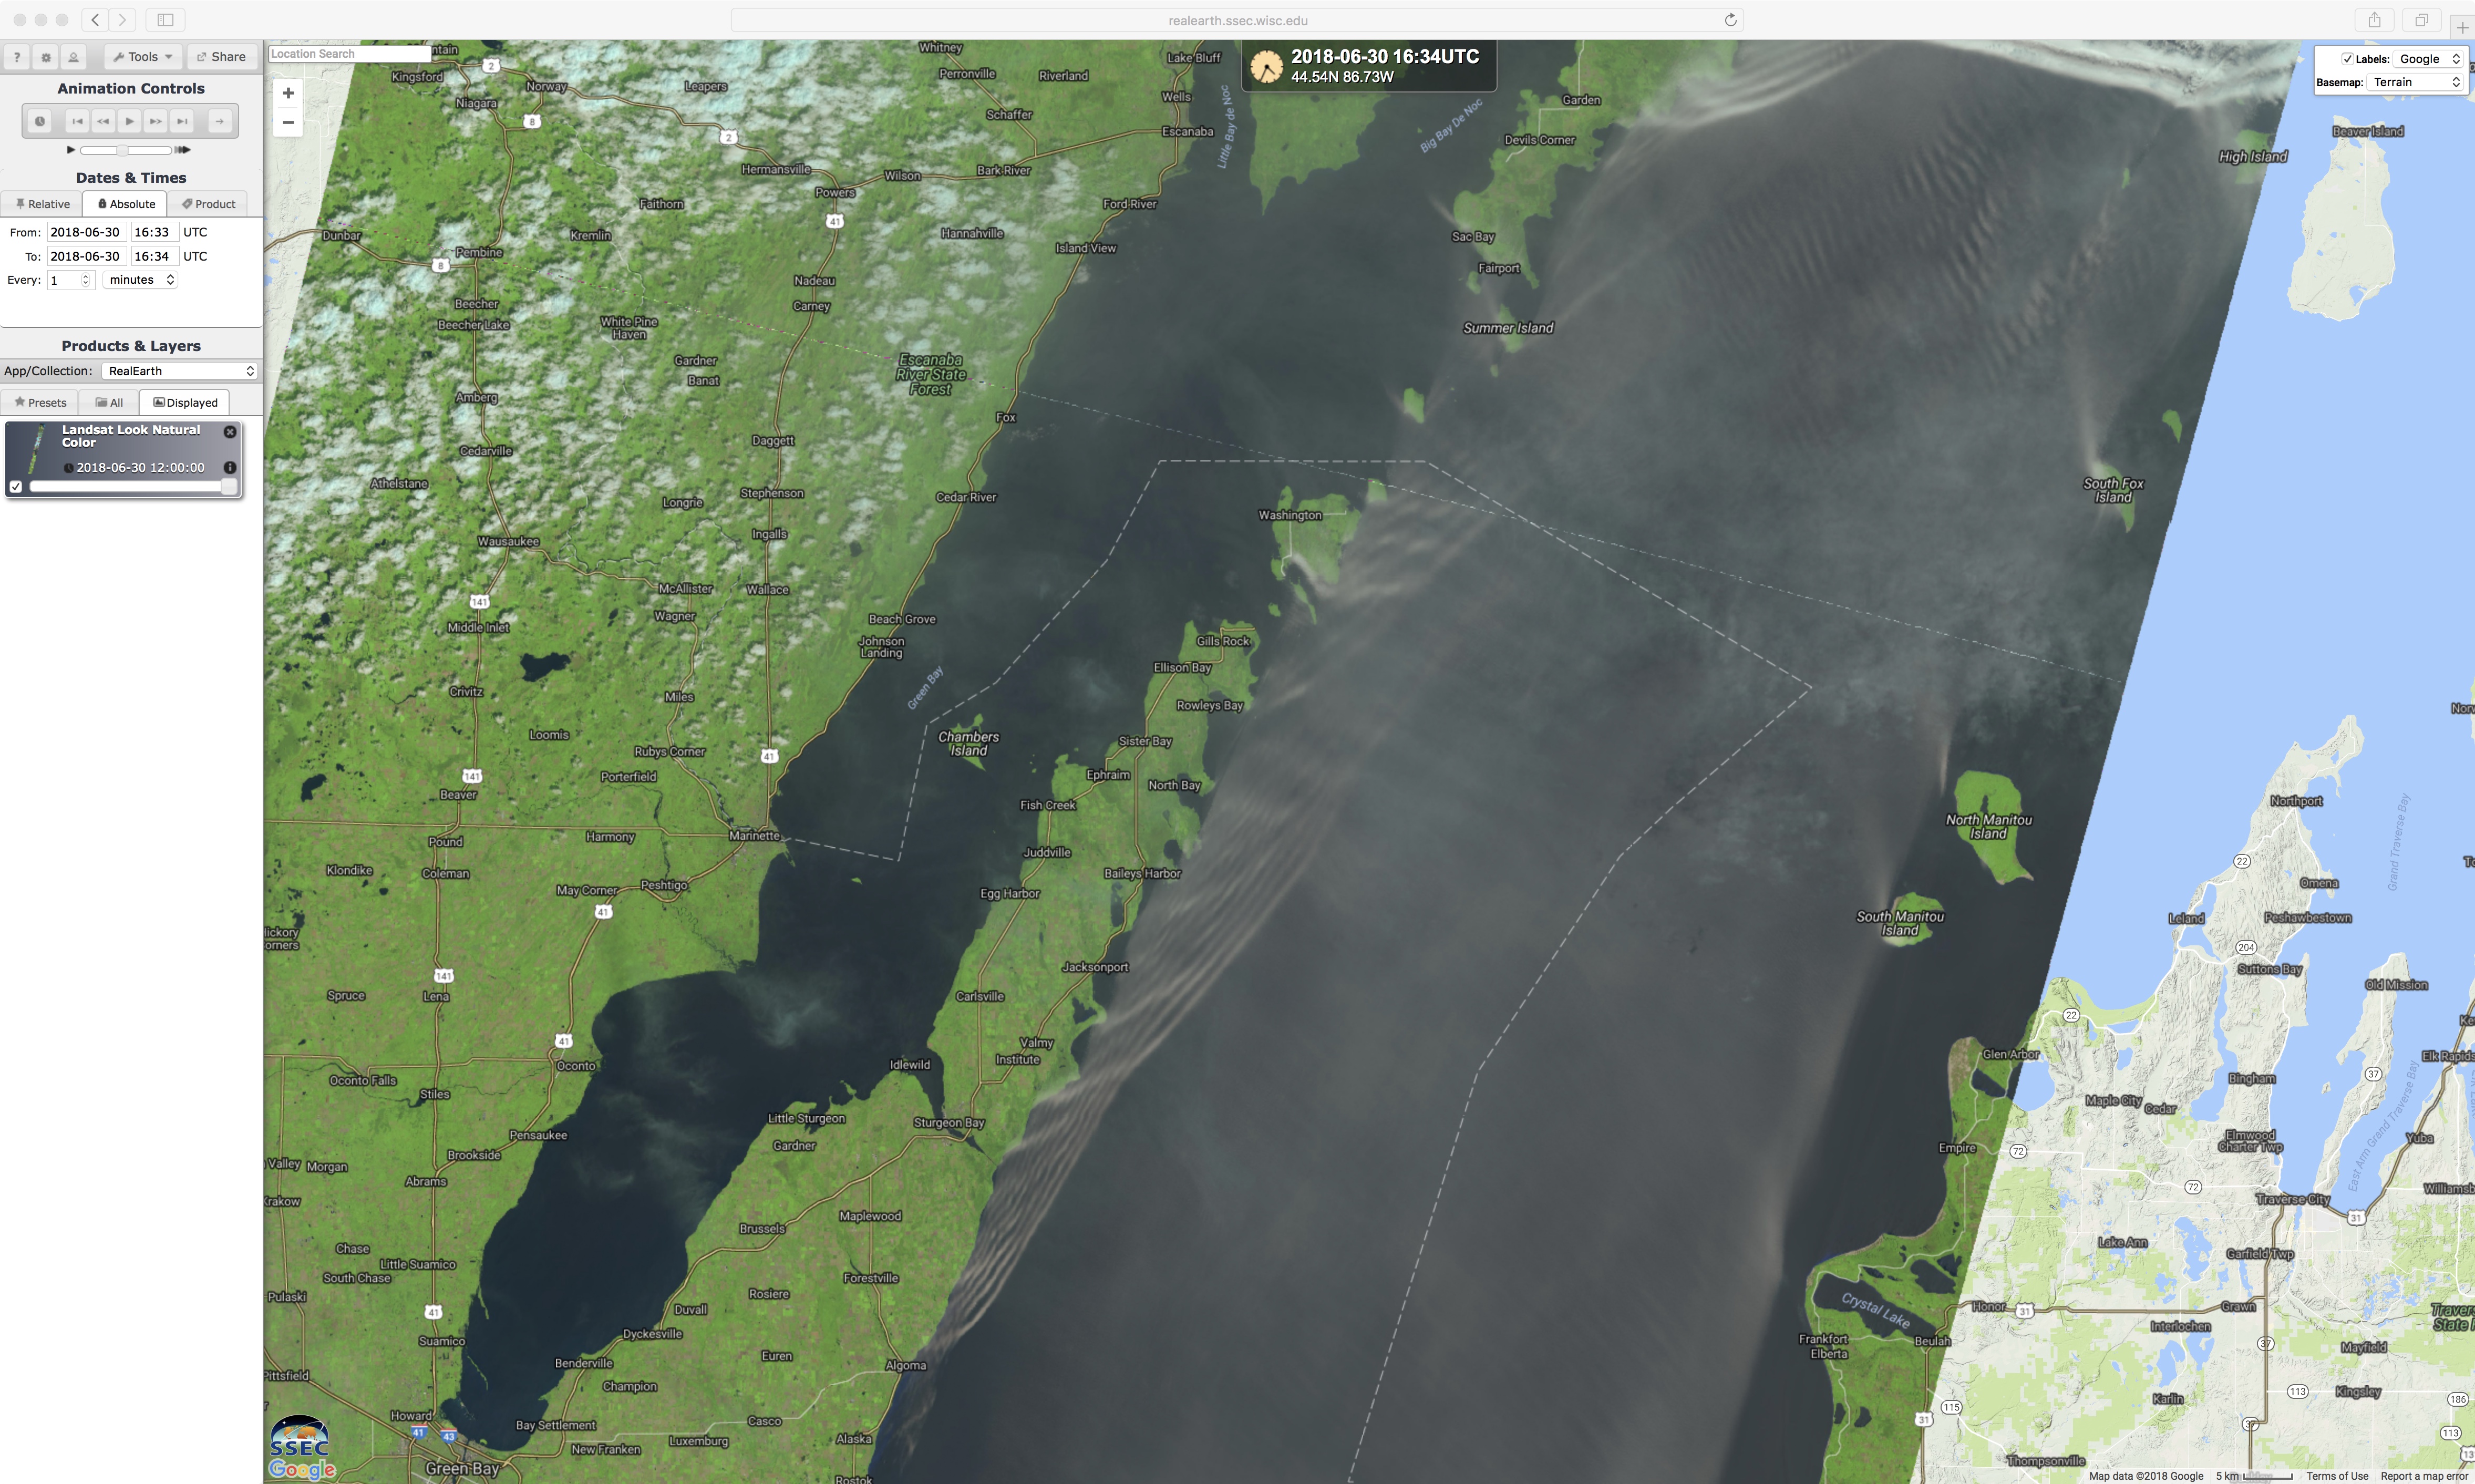

![Landsat-8 false-color RGB image [click to enlarge]](https://cimss.ssec.wisc.edu/satellite-blog/wp-content/uploads/sites/5/2018/06/180630_1634utc_landsat8_falsecolor_Lake_Michigan.jpeg)
![Aqua MODIS Sea Surface Temperature product, with plots of surface and buoy reports [click to enlarge]](https://cimss.ssec.wisc.edu/satellite-blog/wp-content/uploads/sites/5/2018/06/MODIS_SST_20180630_1734.png)

![GOES-16 Mid-level Water Vapor (6.9 µm) images [click to play MP4 animation]](https://cimss.ssec.wisc.edu/satellite-blog/wp-content/uploads/sites/5/2018/06/G16_WV9_ROCKIES_29JUN2018_960x1280_B9_2018180_210219_0001PANEL_00109.GIF)
![Terra MODIS True-Color images on 26 June, 27 June and 30 June [click to enlarge]](https://cimss.ssec.wisc.edu/satellite-blog/wp-content/uploads/sites/5/2018/06/180626-30_terra_modis_truecolor_SD_damage_swaths_anim.gif)
![Aqua MODIS True Color RGB image [click to enlarge]](https://cimss.ssec.wisc.edu/satellite-blog/wp-content/uploads/sites/5/2018/07/180702_1900utc_aqua_modis_truecolor_SD_hail_wind_damage_swaths_anim.gif)
![Aqua MODIS Visible (0.65 µm) image and Normalized Difference Vegetation Index (NDVI) and Land Surface Temperature (LST) products [click to enlarge]](https://cimss.ssec.wisc.edu/satellite-blog/wp-content/uploads/sites/5/2018/07/180702_1900utc_aqua_modis_Visible_NDVI_LST_SD_hail_wind_damage_swaths_anim.gif)

![GOES-16 "Clean" Infrared Window (10.3 µm) images, with SPC storm reports plotted in red; Carter County, Montana and Harding County, South Dakota are outlined in blue [click to play MP4 animation]](https://cimss.ssec.wisc.edu/satellite-blog/wp-content/uploads/sites/5/2018/06/G16_IR_MT_SD_SVR_28JUN2018_960x1280_B13_2018180_022527_0001PANEL_00206.GIF)
![Plot of rawinsonde data from Rapid City SD [click to enlarge]](https://cimss.ssec.wisc.edu/satellite-blog/wp-content/uploads/sites/5/2018/06/180629_00UTC_KRAP_RAOB.GIF)
