Comparisons of NOAA-20 and Suomi NPP VIIRS Day/Night Band (0.7 µm) and “Fog Product” Infrared Brightness Temperature Difference images (above) showed the nighttime formation of river valley fog in parts of the Mississippi River and its tributaries in Minnesota, Wisconsin and Iowa on 28 June 2018. Due to ample illumination... Read More
NOAA-20 VIIRS Day/Night Band (0.7 µm) and “Fog Product” Infrared Brightness Temperature Difference (11.0 – 3.7 µm) images, with plots of Ceiling and Visibility [click to enlarge]
![Suomi NPP VIIRS Day/Night Band (0.7 µm) and "Fog Product" Infrared Brightness Temperature Difference (11.0 - 3.7 µm) images, with plots of Ceiling and Visibility [click to enlarge]](https://cimss.ssec.wisc.edu/satellite-blog/wp-content/uploads/sites/5/2018/06/180628_0815utc_suomi_npp_viirs_DayNightBand_Fog_CeilingVisibility_river_valley_fog_anim.gif)
Suomi NPP VIIRS Day/Night Band (0.7 µm) and “Fog Product” Infrared Brightness Temperature Difference (11.0 – 3.7 µm) images, with plots of Ceiling and Visibility [click to enlarge]
Comparisons of NOAA-20 and Suomi NPP VIIRS Day/Night Band (0.7 µm) and “Fog Product” Infrared Brightness Temperature Difference images
(above) showed the nighttime formation of river valley fog in parts of the Mississippi River and its tributaries in Minnesota, Wisconsin and Iowa on 28 June 2018. Due to ample illumination from the Full Moon, the Day/Night Band provided a “visible image at night” with better fog detail in some areas than was seen using the traditional “Fog Product”. (Note: the NOAA-20 images are incorrectly labeled as Suomi NPP)
A toggle between NOAA-20 and Suomi NPP VIIRS Day/Night Band images acquired by the SSEC Direct Broadcast ground station (below) revealed increased fog formation over portions of the Mississippi River between Rochester MN and Madison WI during the 52 minutes separating the two images.
![NOAA-20 and Suomi NPP VIIRS Day/Night Band (0.7 µm) images [click to enlarge]](https://cimss.ssec.wisc.edu/satellite-blog/wp-content/uploads/sites/5/2018/06/180628_noaa20_suomi_npp_viirs_DayNightBand_river_valley_fog_anim.gif)
NOAA-20 and Suomi NPP VIIRS Day/Night Band (0.7 µm) images [click to enlarge]
During the subsequent daylight hours, GOES-16
(GOES-East) “Red” Visible (
0.64 µm) images
(below) showed that the fog dissipated by 15 UTC or 10am local time.
GOES-16 “Red” Visible (0.64 µm) images, with hourly plots of surface weather type [click to play animation | MP4]
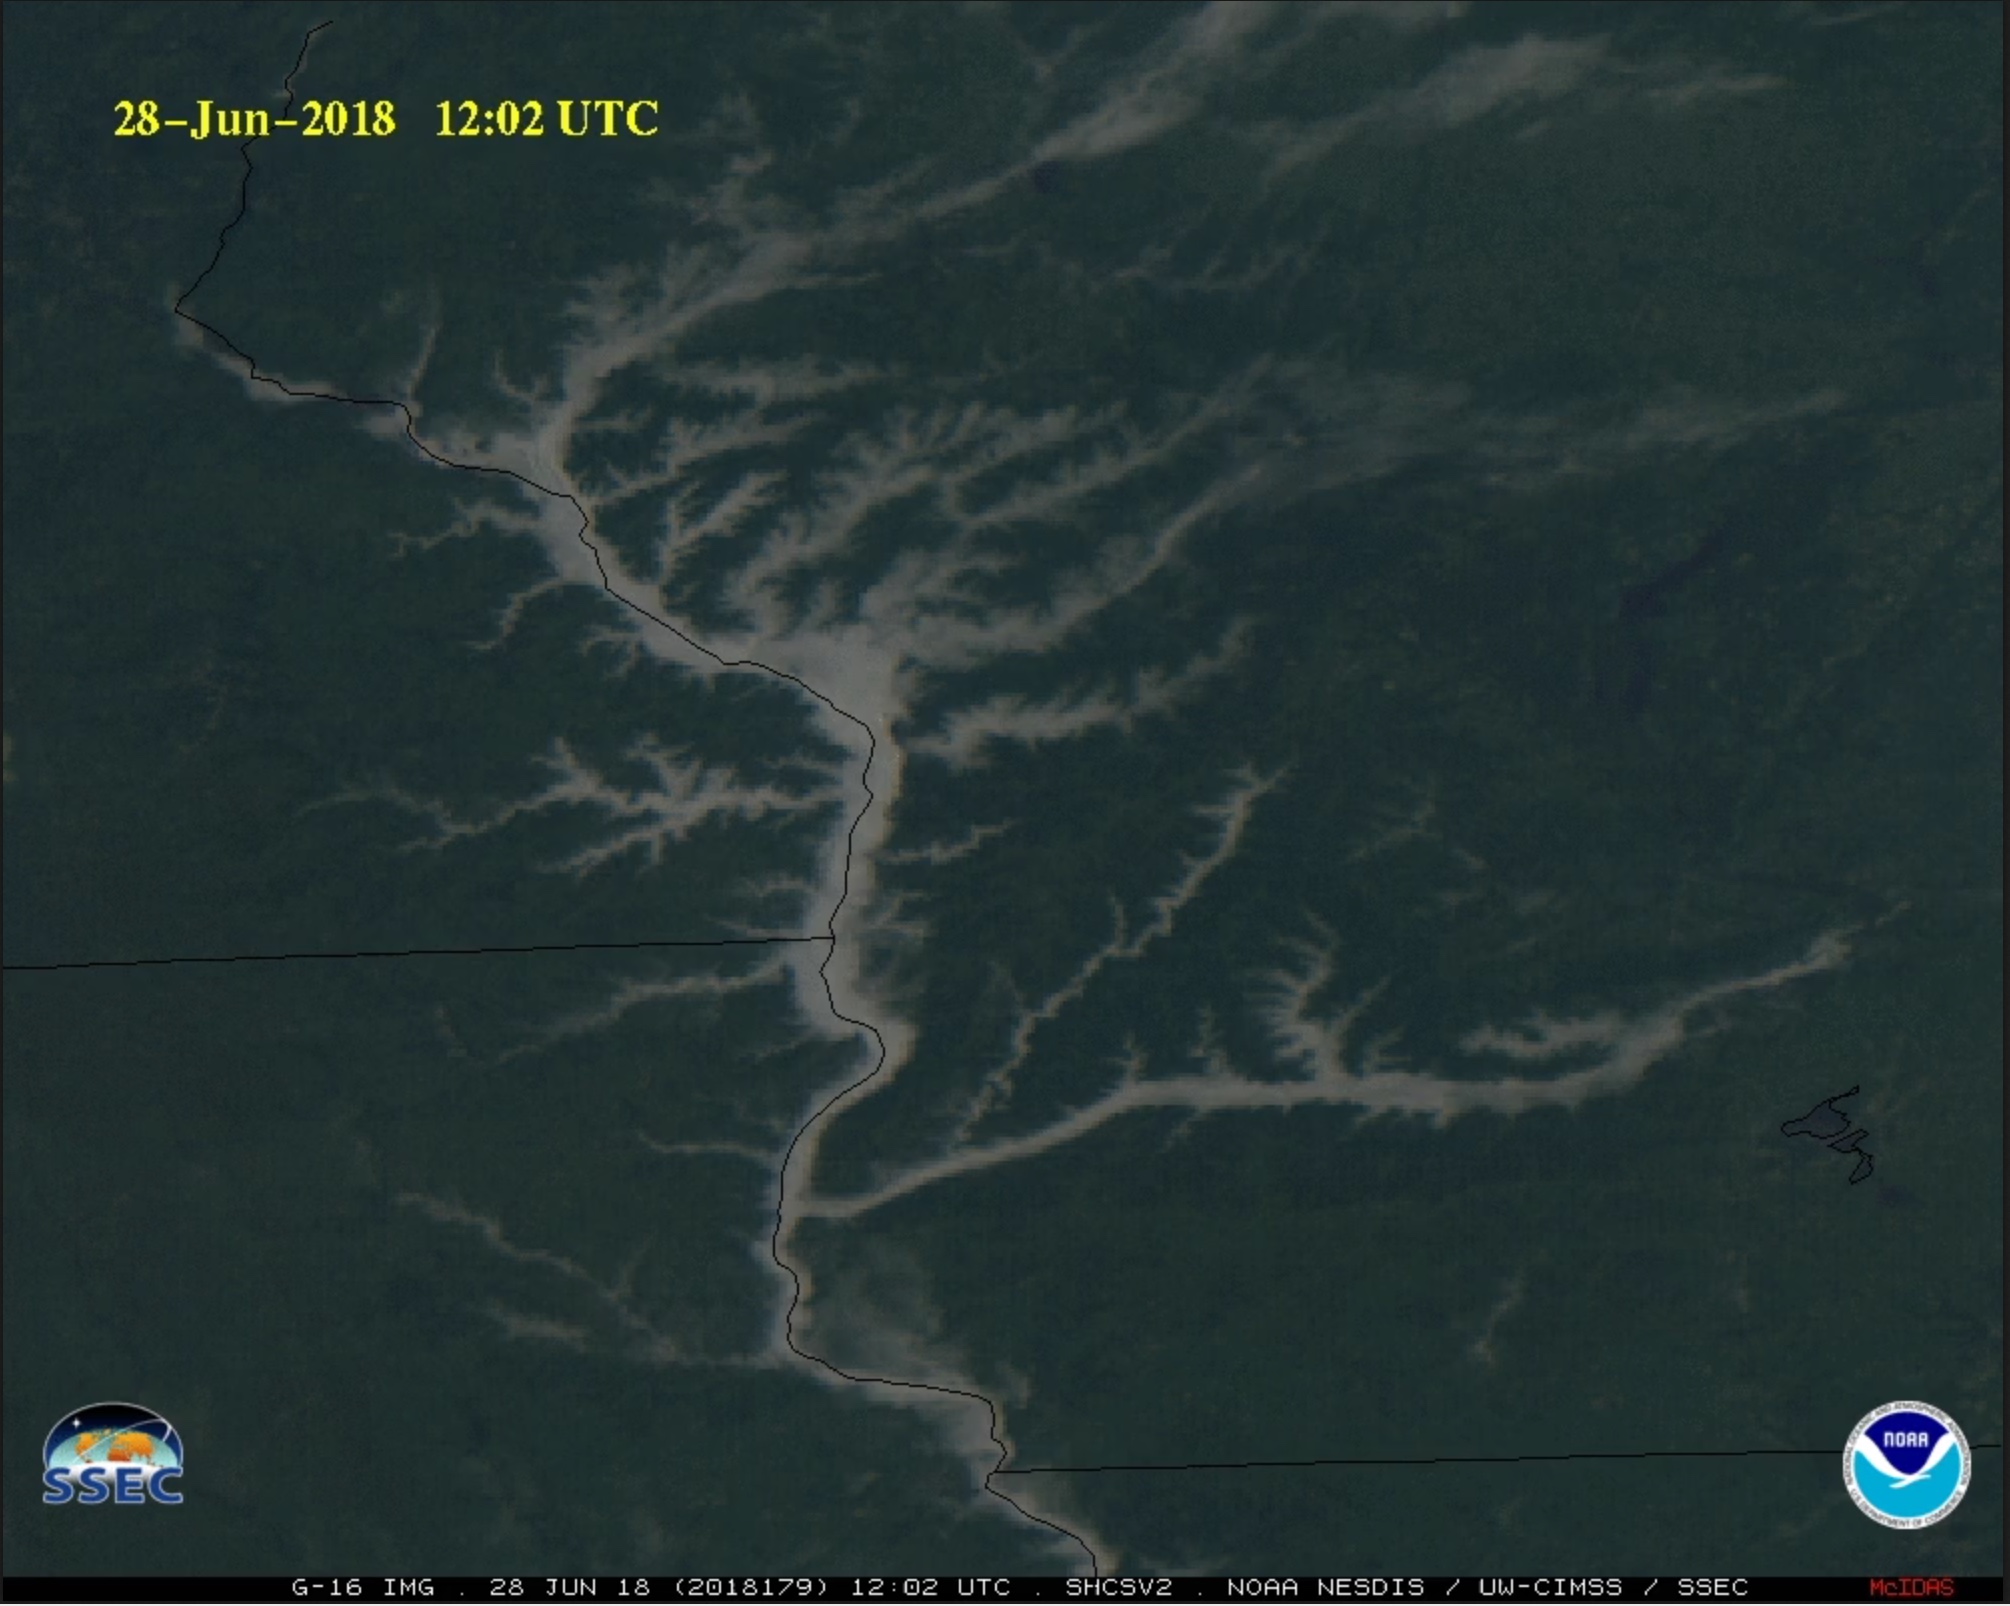
GOES-16 Natural Color Red-Green-Blue (RGB) images are shown below.
![GOES-16 Natural Color RGB images [click to play MP4 animation]](https://cimss.ssec.wisc.edu/satellite-blog/wp-content/uploads/sites/5/2018/06/180628_1202utc_goes16_natural_color.jpeg)
GOES-16 Natural Color RGB images [click to play MP4 animation]
View only this post
Read Less
![GOES-16 "Clean" Infrared Window (10.3 µm) images, with SPC storm reports plotted in cyan [click to play MP4 animation]](https://cimss.ssec.wisc.edu/satellite-blog/wp-content/uploads/sites/5/2018/06/G16_IR_MIDWEST_SVR_28JUN2018_1200x2000_B13_2018179_225719_0001PANEL_00132.GIF)
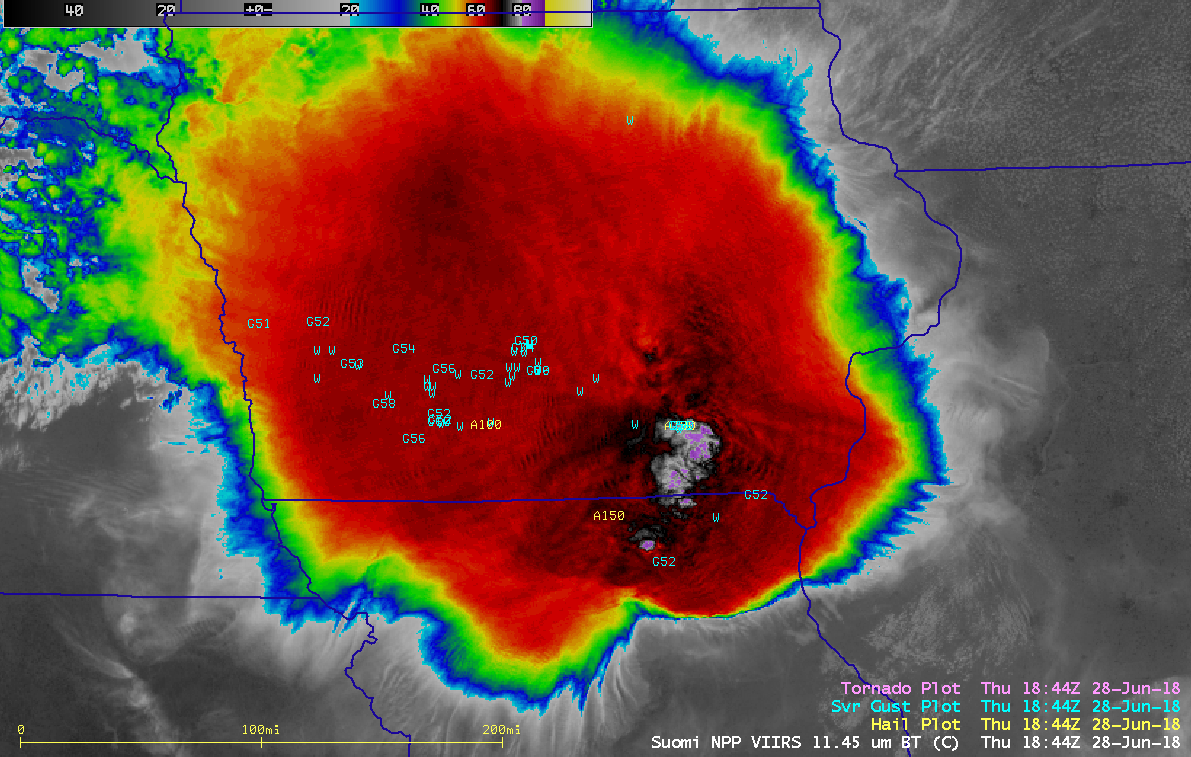
![Suomi NPP VIIRS Infrared Window (11.45 µm) images, with SPC storm reports plotted during the 3 hours preceding the 1844 UTC image [click to enlarge]](https://cimss.ssec.wisc.edu/satellite-blog/wp-content/uploads/sites/5/2018/06/180628_suomi_npp_viirs_infrared_Midwest_MCS_anim.gif)

![NOAA-20 VIIRS Day/Night Band (0.7 µm), Shortwave Infrared (3.75 µm and 4.05 µm) and Near-Infrared (1.61 µm and 2.25 µm) images [click to enlarge]](https://cimss.ssec.wisc.edu/satellite-blog/wp-content/uploads/sites/5/2018/06/180629_0852utc_noaa20_DayNightBand_ShortwaveInfrared_NearInfrared_Spring_Fire_CO_anim.gif)

