Gravity waves near Guadalupe Island
![GOES-16 Low-level (7.3 µm, left), Mid-level (6.9 µm, center) and Upper-level (6.2 µm, right) Water Vapor images [click to play animation]](https://cimss.ssec.wisc.edu/satellite-blog/wp-content/uploads/sites/5/2018/03/180315_goes16_water_vapor_Guadalupe_Island_waves_anim.gif)
GOES-16 Low-level (7.3 µm, left), Mid-level (6.9 µm, center) and Upper-level (6.2 µm, right) Water Vapor images [click to play animation]
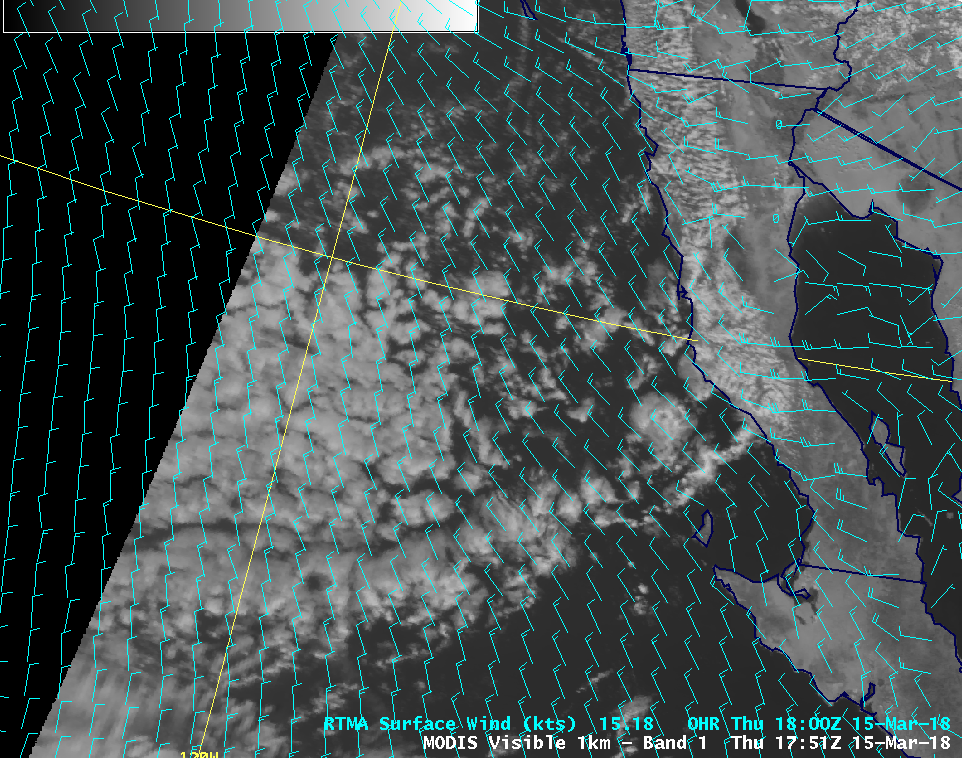
A similar animation of GOES-16 “Red” Visible (0.64 µm), Mid-level Water Vapor (6.9 µm) and Upper-level Water Vapor (6.2 µm) images (below) did show some smaller-scale waves on Visible imagery within the marine boundary layer stratocumulus cloud field, but they did not appear to exhibit a direct correlation with the higher-altitude waves seen in the Water Vapor imagery. Surface winds were from the northwest at 10-15 knots, as a dissipating cold front was stalled over the region.

GOES-16 “Red” Visible (0.64 µm, left), Mid-level Water Vapor (6.9 µm, center) and Upper-level Water Vapor (6.2 µm, right) images [click to play animation]
![GOES-16 Mid-level (6.9 µm) Water Vapor images [click to play animation]](https://cimss.ssec.wisc.edu/satellite-blog/wp-content/uploads/sites/5/2018/03/180315_goes16_fd_water_vapor_Guadalupe_Island_waves_anim.gif)
GOES-16 Mid-level (6.9 µm) Water Vapor images [click to play animation]
![GOES-15 Water Vapor (6.5 µm) images, with water vapor wind vectors [click to enlarge]](https://cimss.ssec.wisc.edu/satellite-blog/wp-content/uploads/sites/5/2018/03/180315_goes15_water_vapor_winds_anim.gif)
GOES-15 Water Vapor (6.5 µm) images, with atmospheric motion vectors [click to enlarge]
![GOES-15 Water Vapor (6.5 µm) images, with contours of upper-tropospheric convergence [click to enlarge]](https://cimss.ssec.wisc.edu/satellite-blog/wp-content/uploads/sites/5/2018/03/180315_goes15_water_vapor_divergence_anim.gif)
GOES-15 Water Vapor (6.5 µm) images, with contours of upper-tropospheric convergence [click to enlarge]
![Aqua MODIS Water Vapor (6.7 µm) image, with NAM80 contours of 250 hPa wind speed [click to enlarge]](https://cimss.ssec.wisc.edu/satellite-blog/wp-content/uploads/sites/5/2018/03/NAM80_250MB_Windspeed_20180315_1200F000.png)
Aqua MODIS Water Vapor (6.7 µm) image, with NAM80 contours of 250 hPa wind speed [click to enlarge]