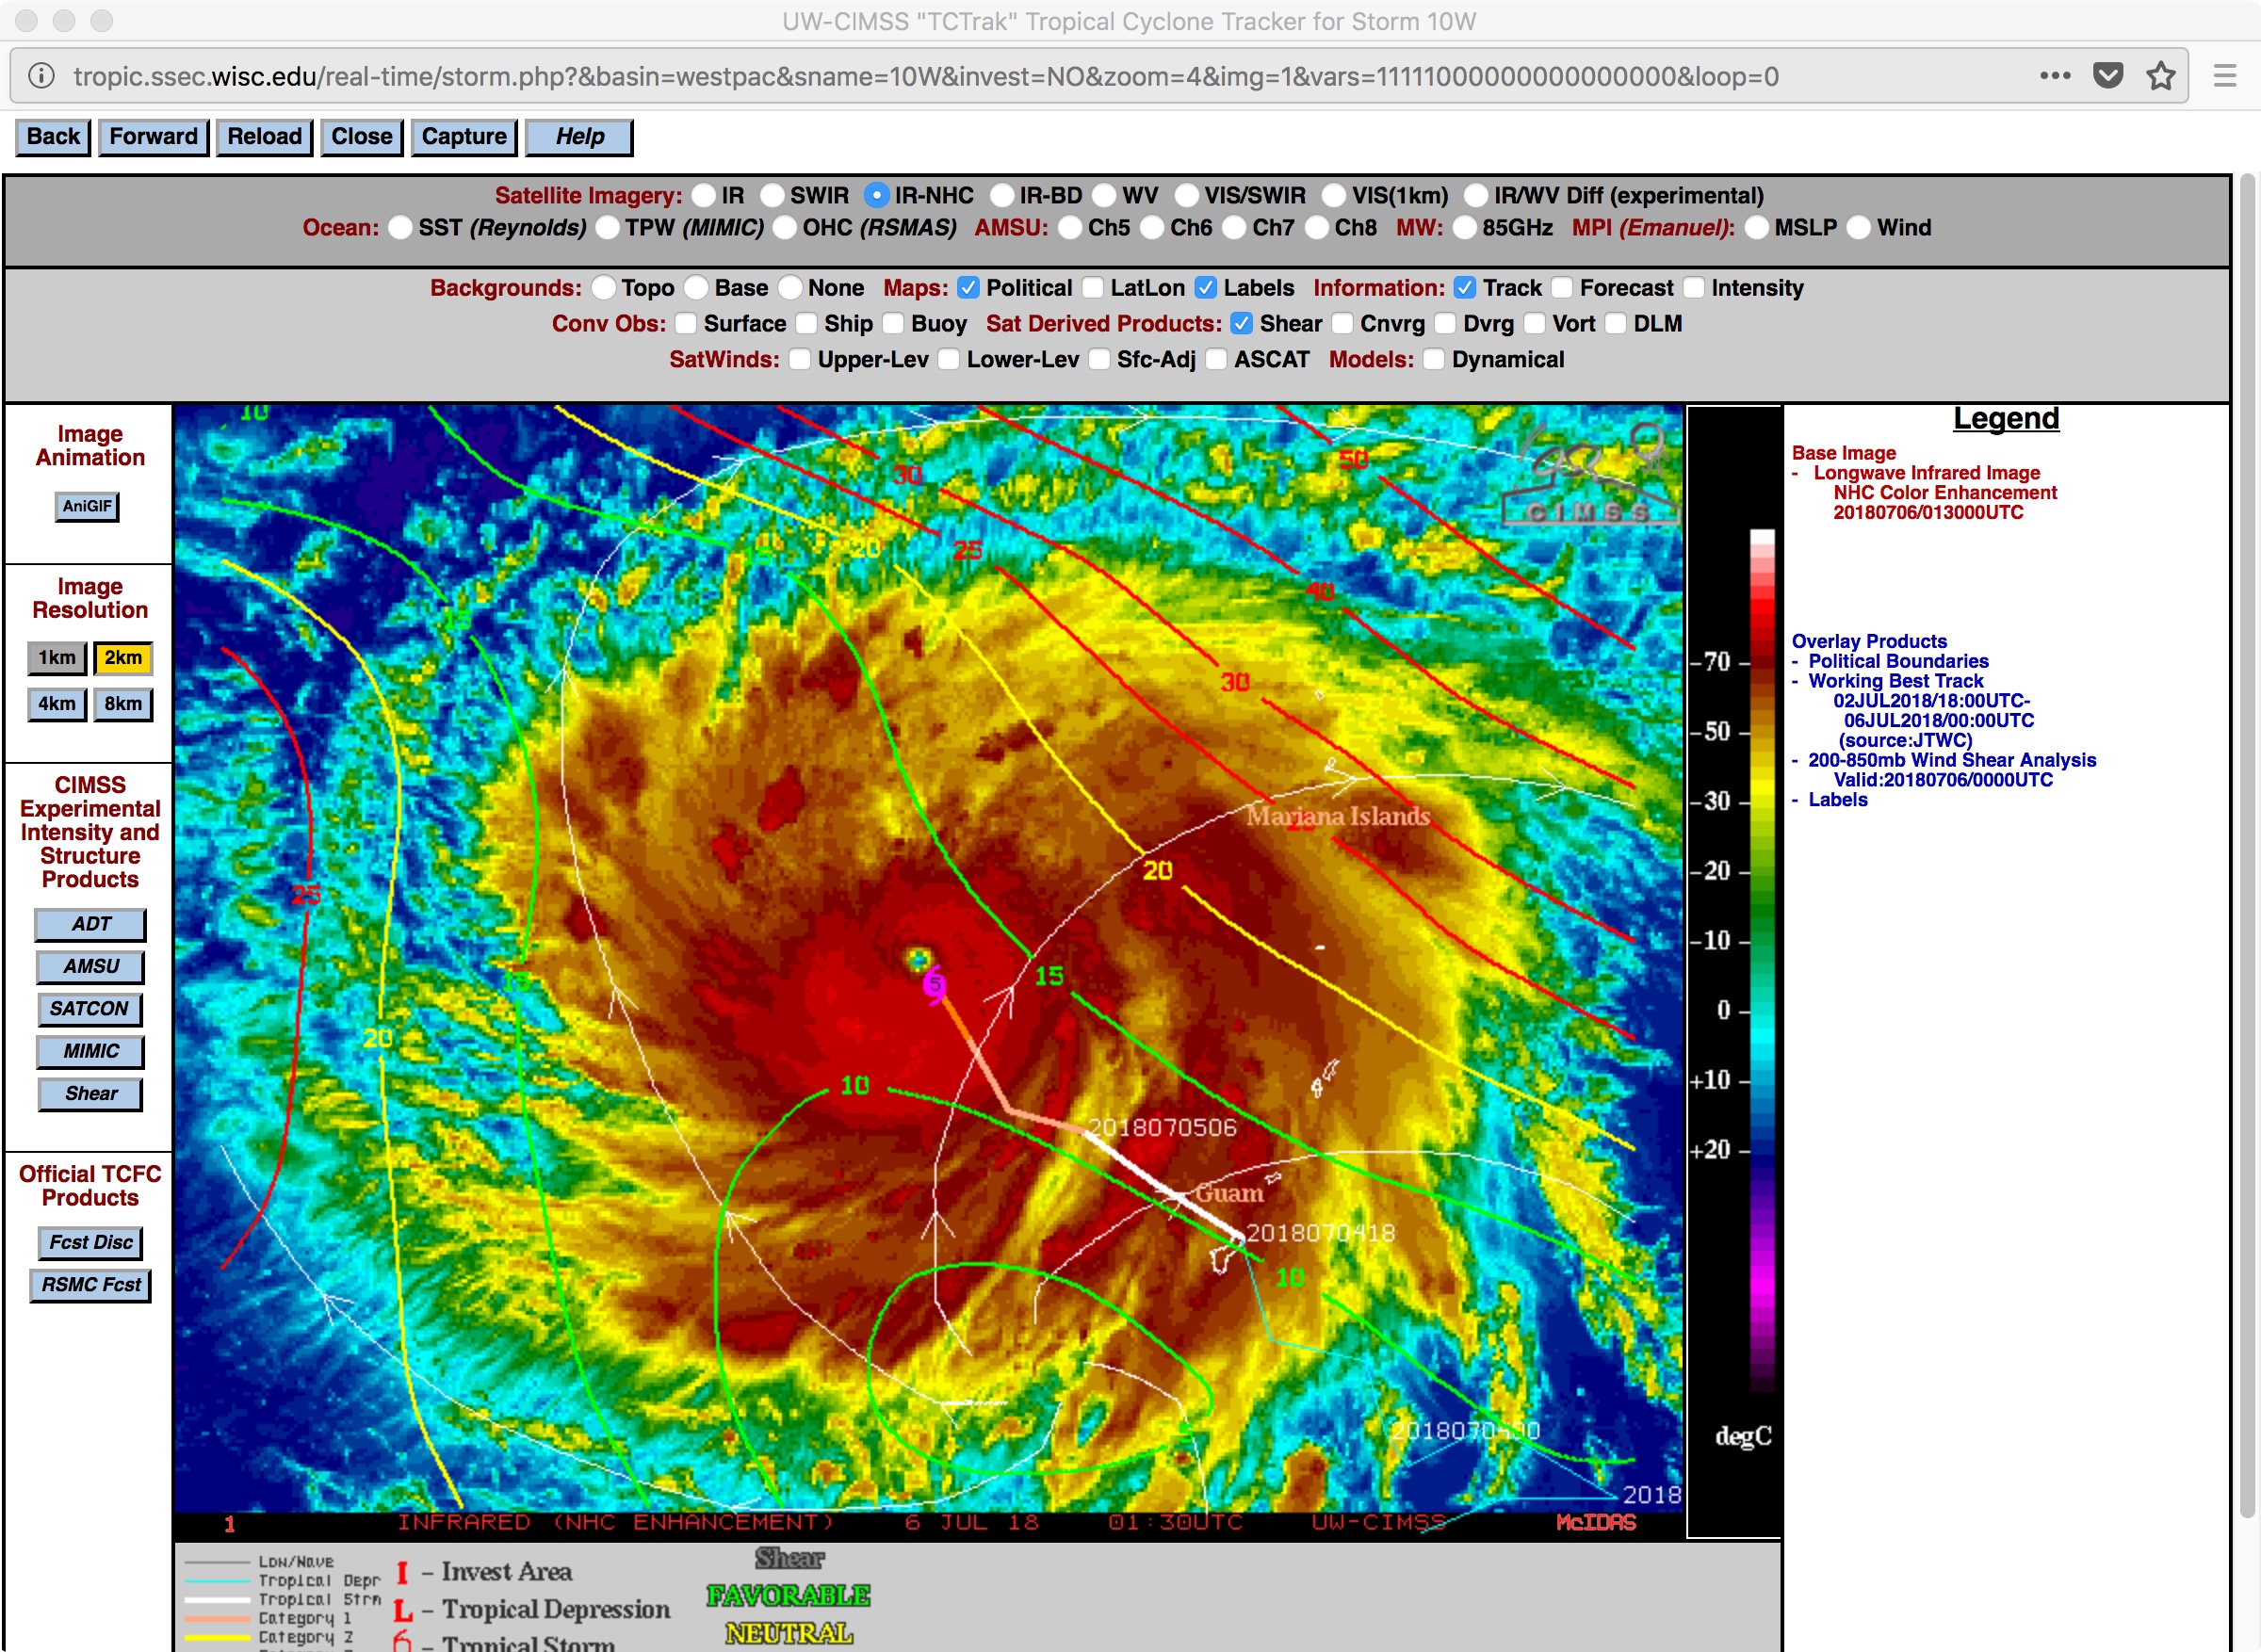
Typhoon Maria underwent a period of rapid intensification (ADT | SATCON) while it was just northwest of Guam late in the day on 05 July 2018, becoming the first Category 5 Super Typhoon of the 2018 West Pacific season. Rapid-scan Himawari-8 “Red” Visible (0.64 µm) and “Clean” Infrared Window (10.4... Read More
![Himawari-8 Visible (0.64 µm, left) and Infrared Window (10.4 µm, right) images [click to play MP4 animation]](https://cimss.ssec.wisc.edu/satellite-blog/wp-content/uploads/sites/5/2018/07/HIM08_VIS_IR_MARIA_05JUL2018_960x640_B313_2018187_000215_0002PANELS_00090.GIF)
Himawari-8 “Red” Visible (0.64 µm, left) and “Clean” Infrared Window (10.4 µm, right) images [click to play MP4 animation]
Typhoon Maria underwent a period of rapid intensification (
ADT |
SATCON) while it was just northwest of Guam late in the day on 05 July 2018, becoming the first Category 5 Super Typhoon of the 2018 West Pacific season. Rapid-scan Himawari-8 “Red” Visible (0.64 µm) and “Clean” Infrared Window (10.4 µm) images
(above) showed Maria during this period of rapid intensification. Cloud-top infrared brightness temperatures reached -80ºC
(violet enhancement) at times in the eyewall of the storm.
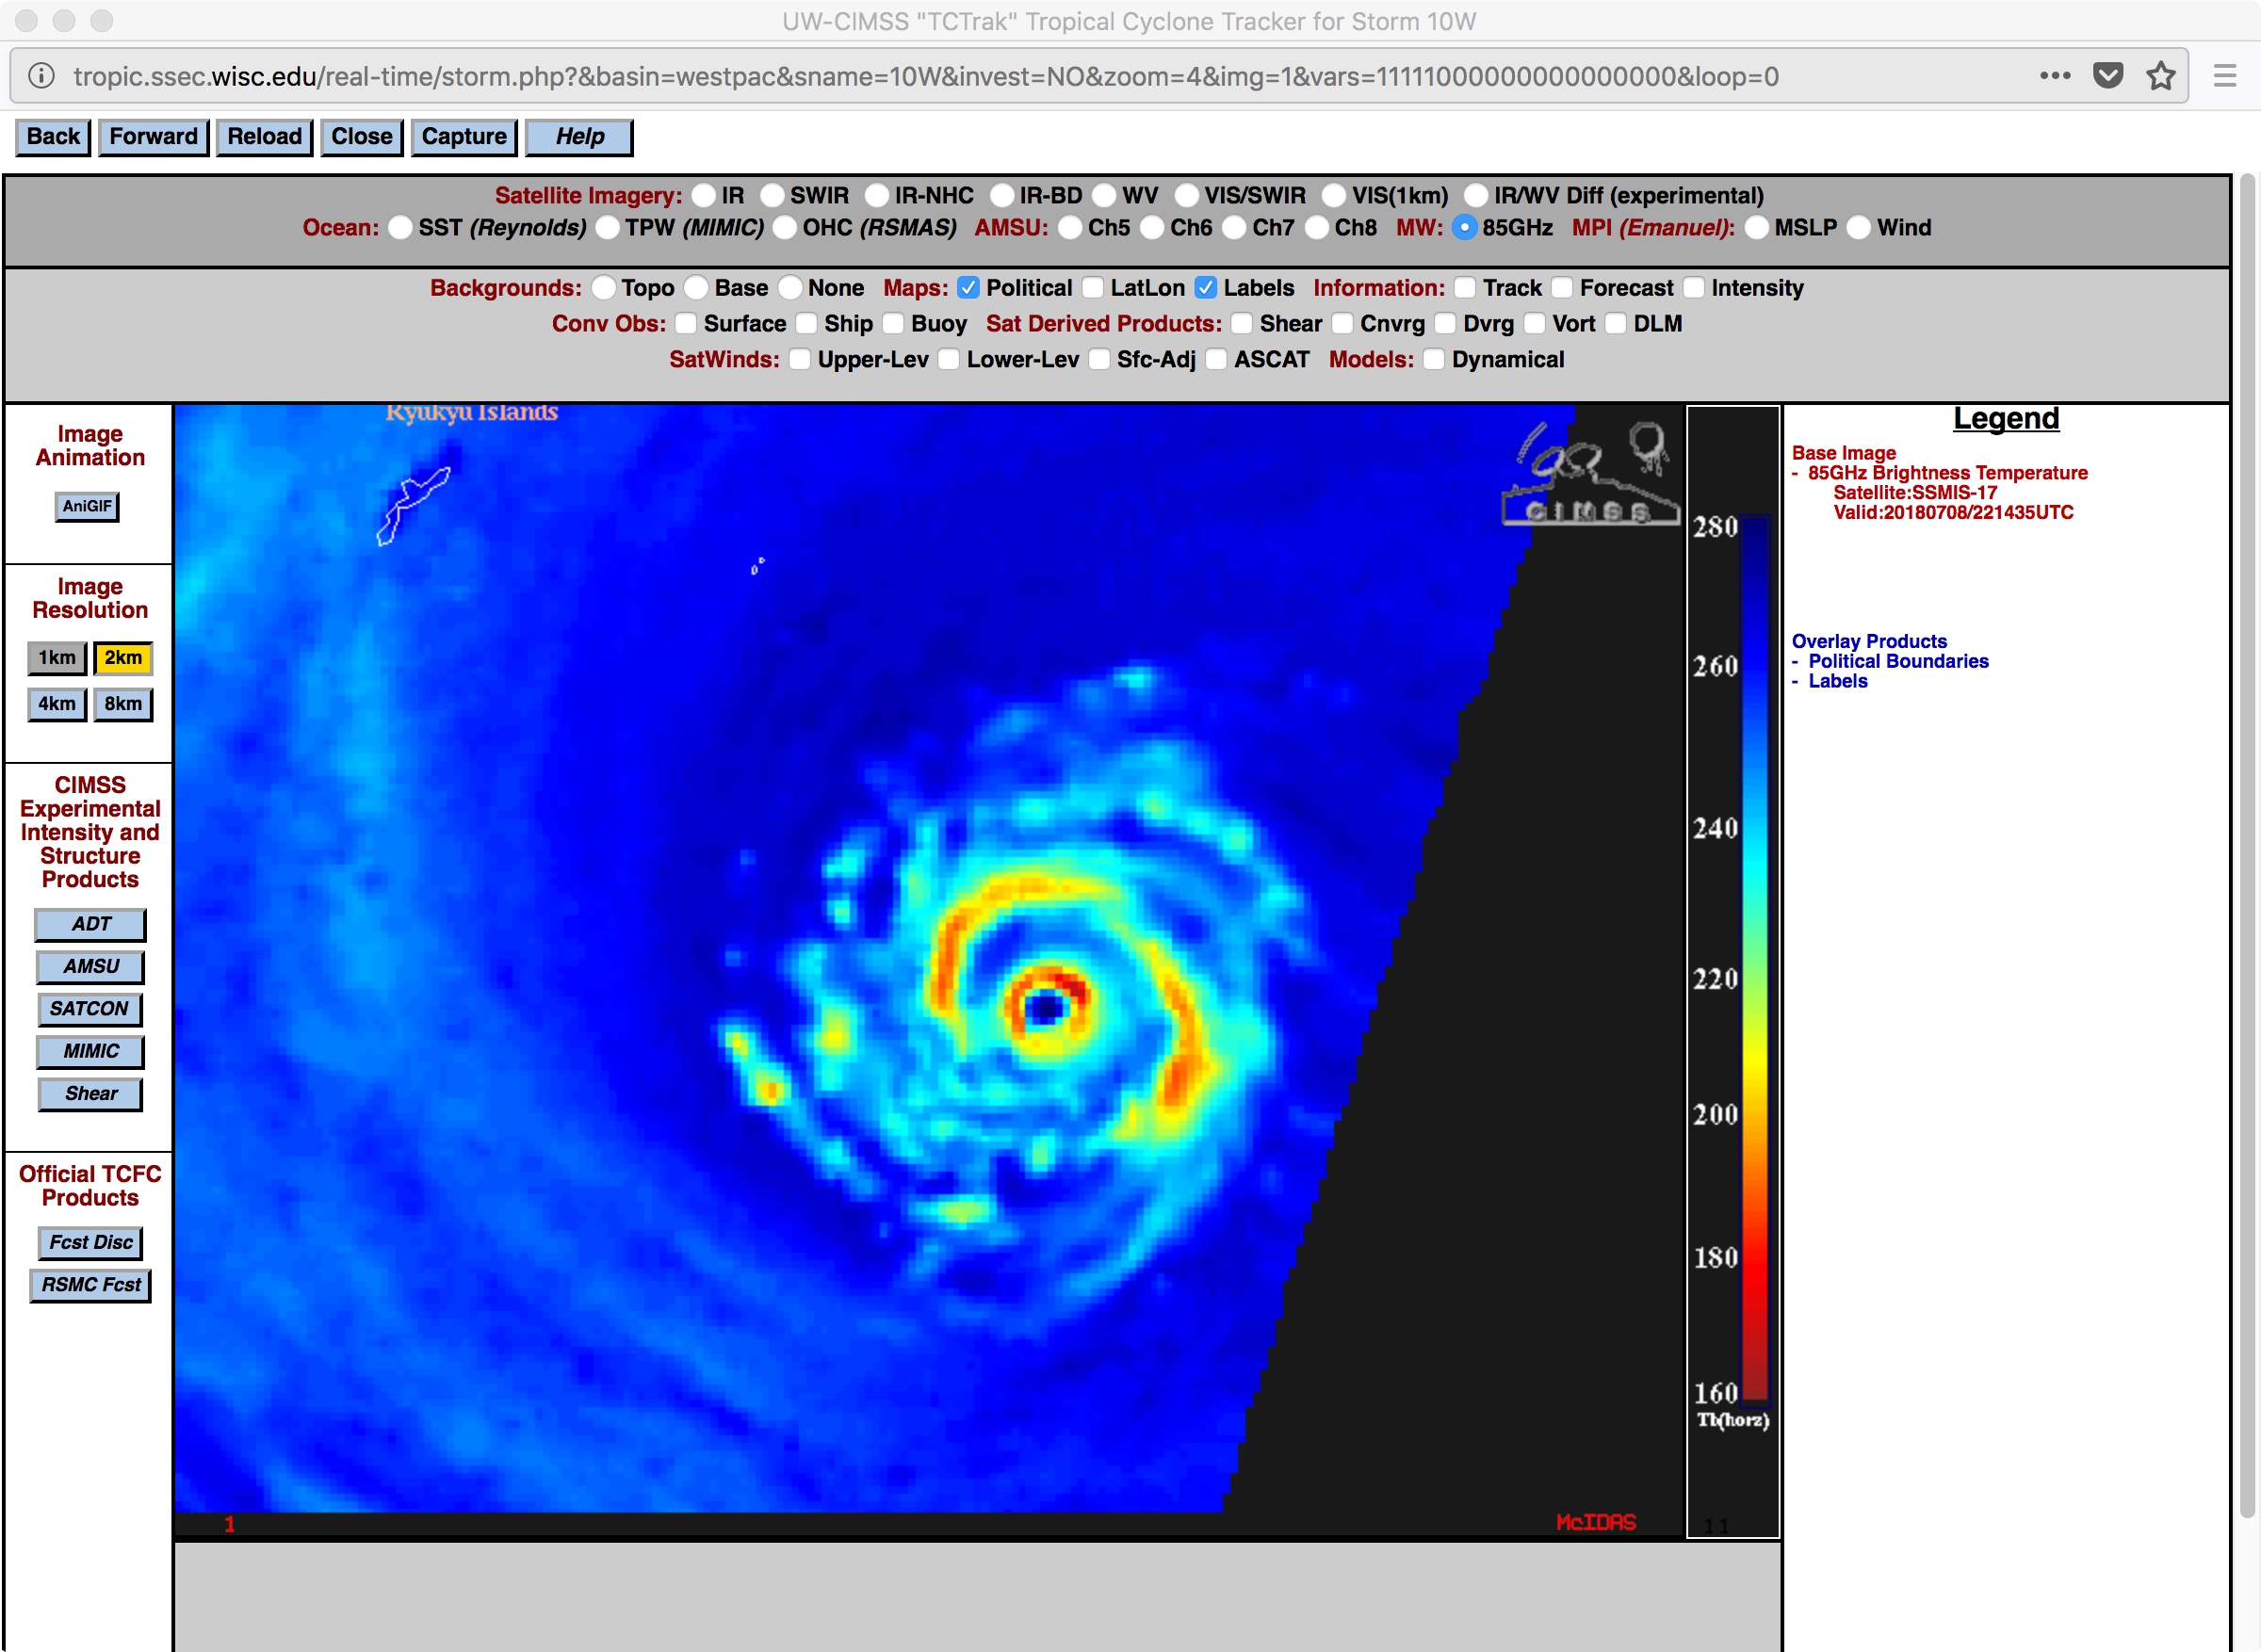
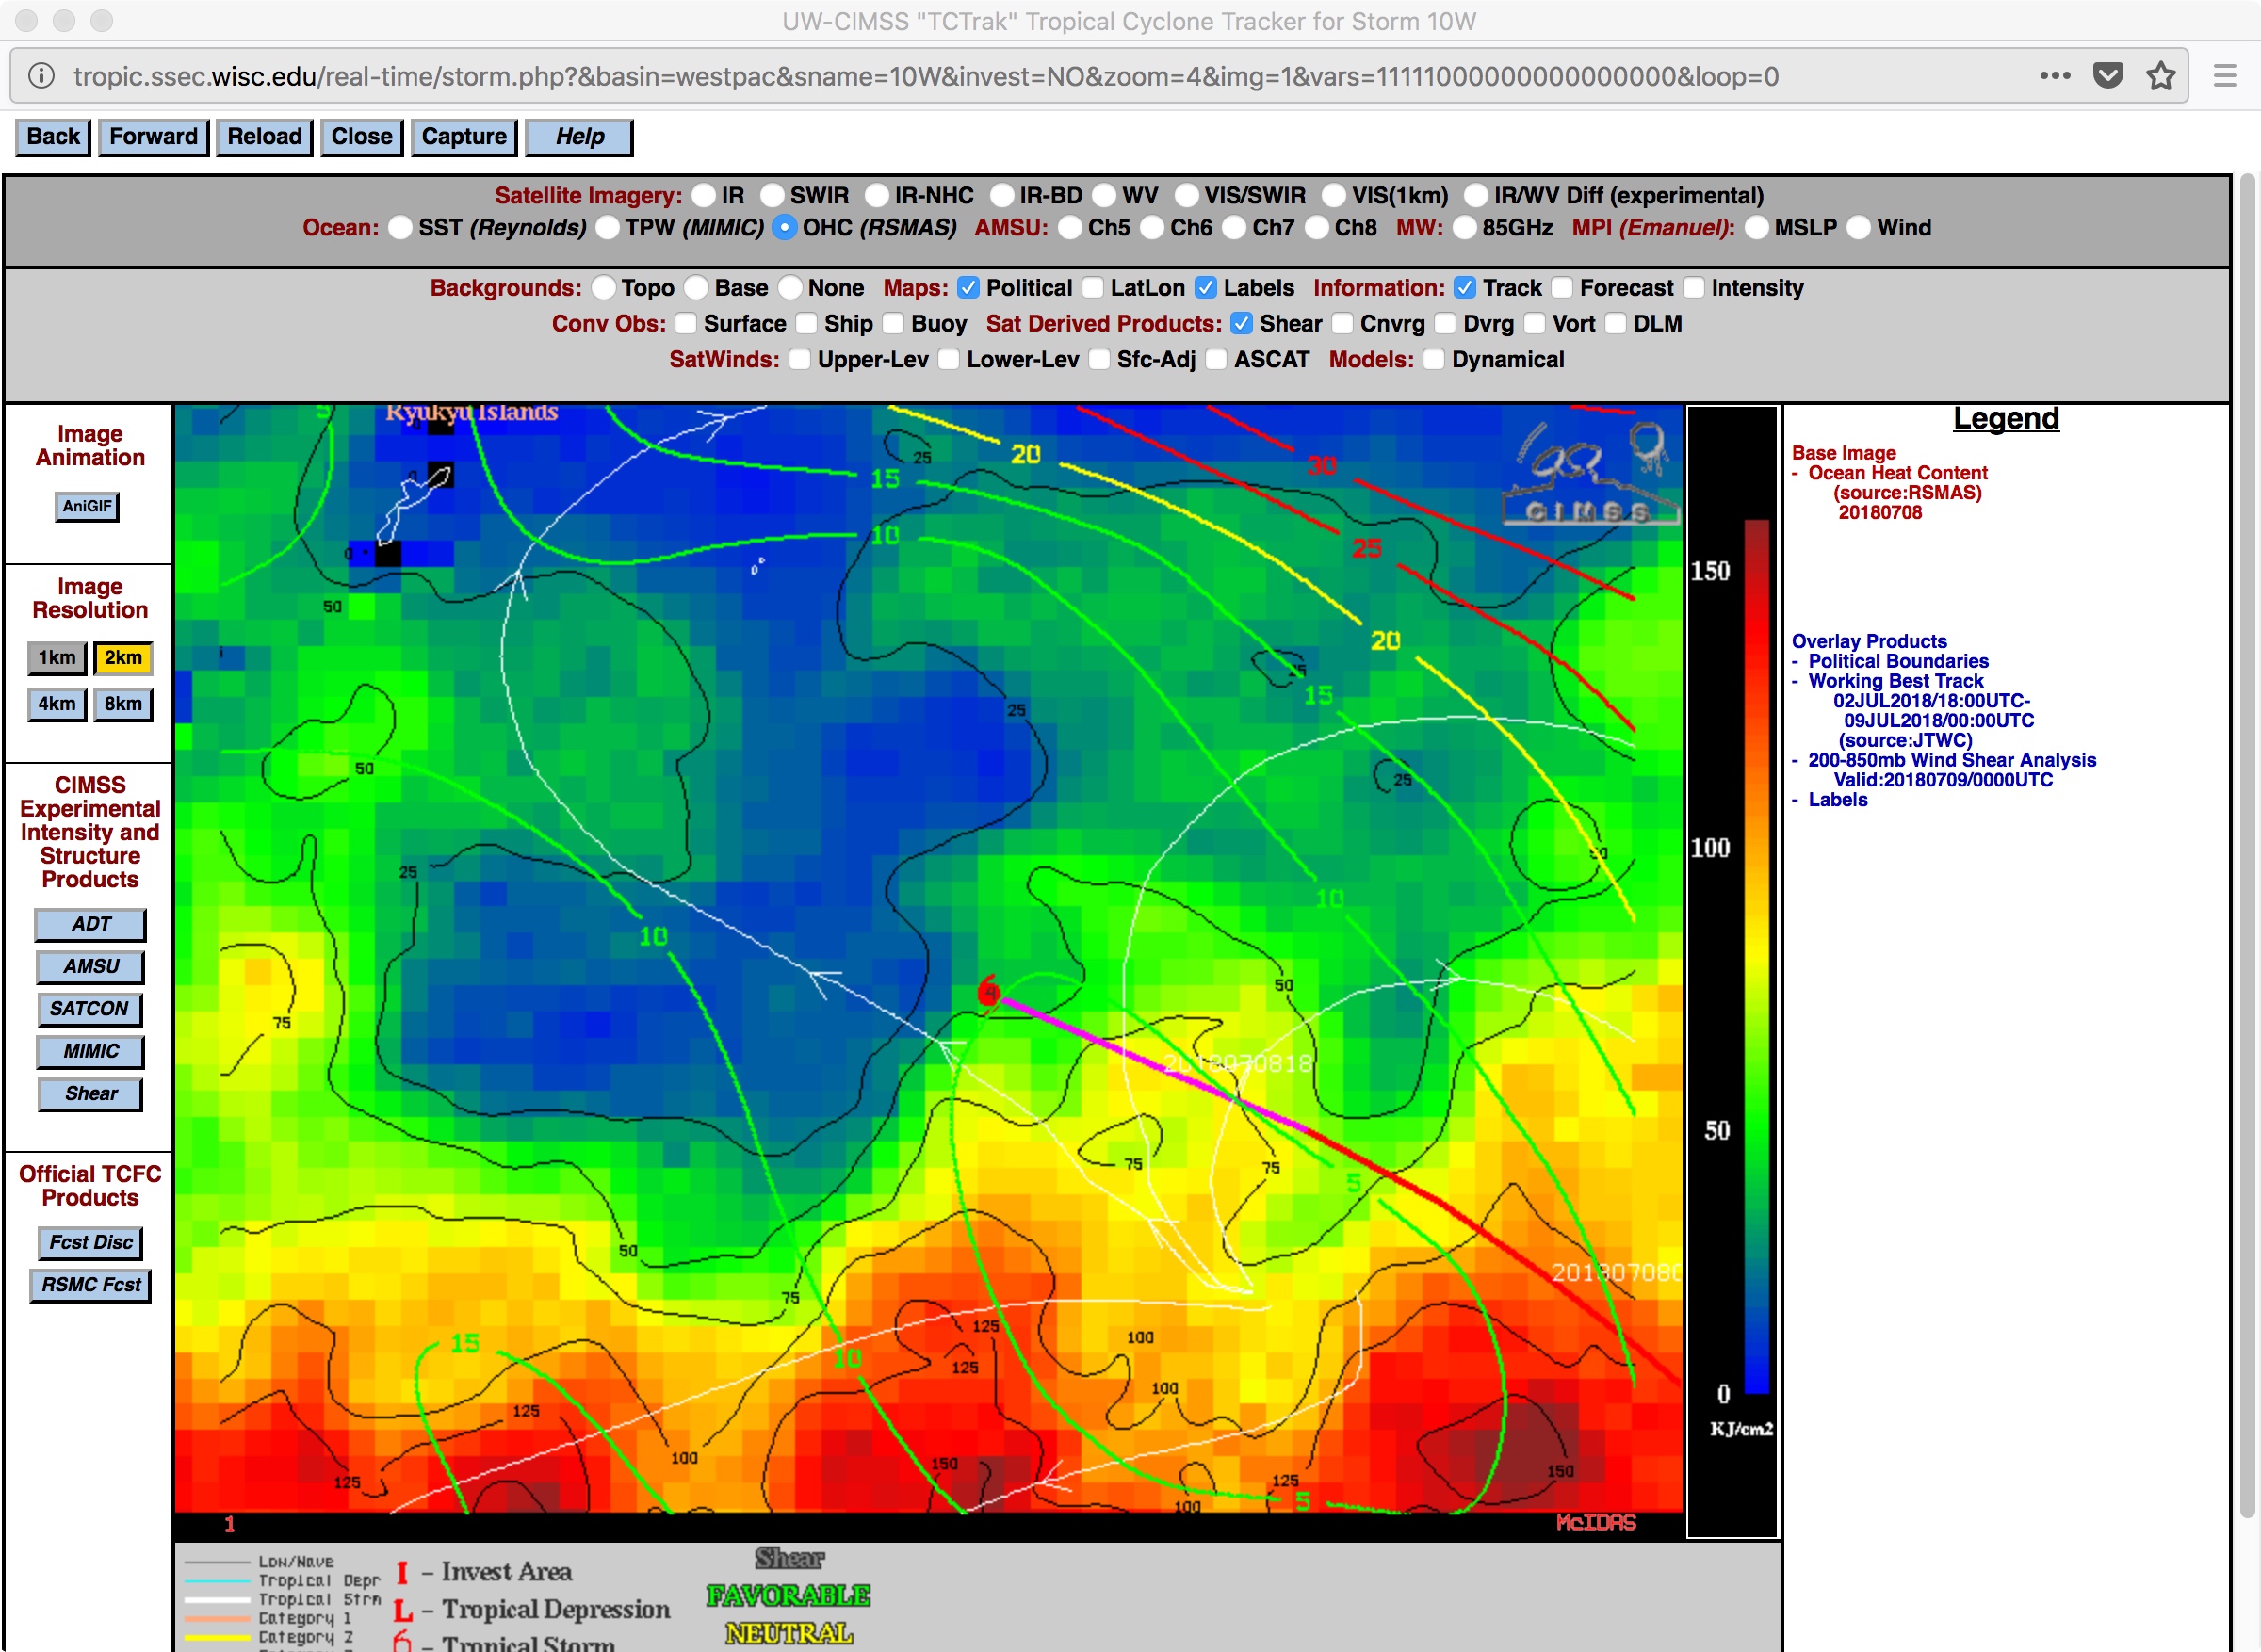
A GPM GMI Microwave (85 GHz) image from the CIMSS Tropical Cyclones site (below) showed the pinhole eye of Maria around the time it reached Category 5 intensity. The tropical cyclone was moving over water with high values of Ocean Heat Content — and was in an environment characterized by low values of Deep-layer Wind Shear.
![GPM GMI Microwave (85 GHz) image [click to enlarge]](https://cimss.ssec.wisc.edu/satellite-blog/wp-content/uploads/sites/5/2018/07/180705_2346utc_gpm_gmi_microwave_STY_Maria.jpeg)
GPM GMI Microwave (85 GHz) image [click to enlarge]
Mesovortices could be seen within the eye on Himawari-8 Visible imagery
(below). However, note how the eye became less distinct and increased in diameter toward the end of the animation.
Himawari-8 “Red” Visible (0.64 µm) images [click to play MP4 animation]
Shortly after 00 UTC on 06 July, Maria began the process of an eyewall replacement cycle as shown in
MIMIC TC morphed microwave imagery
(below) — and during the following 6-12 hours a decreasing trend in storm intensity was seen (
ADT |
SATCON).
![MIMIC TC morphed microwave image product [click to play animation]](https://cimss.ssec.wisc.edu/satellite-blog/wp-content/uploads/sites/5/2018/07/180706_0754utc_Maria_mimic_tc.jpeg)
MIMIC TC morphed microwave image product [click to play animation]
A toggle between Suomi NPP VIIRS Day/Night Band (0.7 µm) and Infrared Window (11.45 µm) images at 1603 UTC on 06 July
(below; courtesy of William Straka, CIMSS) showed Category 4 Typhoon Maria after the eye had filled following the eyewall replacement cycle.
![Suomi NPP VIIRS Day/Night Band (0.7 µm) and Infrared Window (11.45 µm) images [click to enlarge]](https://cimss.ssec.wisc.edu/satellite-blog/wp-content/uploads/sites/5/2018/07/180706_1603utc_suomi_npp_viirs_DayNightBand_InfraredWindow_TY_Maria_anim.gif)
Suomi NPP VIIRS Day/Night Band (0.7 µm) and Infrared Window (11.45 µm) images [click to enlarge]
===== 08 July Update =====
Himawari-8 “Clean” Infrared Window (10.4 µm) images [click to play MP4 animation]
Super Typhoon Maria re-intensified to Category 5 intensity at 12 UTC on 08 July (
SATCON) — Himawari-8 “Clean” Infrared Window (10.4 µm) images
(above) displayed a large
(30 nautical mile wide) eye. The subtle signature of mesovortices could be seen rotating within the eye.
During the preceding daylight hours, Himawari-8 “Red” Visible (0.64 µm) images (below) showed the eye mesovortices in better detail.
Himawari-8 “Red” Visible (0.64 µm) images [click to play MP4 animation]
However, Maria was again downgraded to a Category 4 storm at 00 UTC on 09 July, as another eyewall replacement cycle took place (
DMSP-17 microwave image) and the storm began to move over water having slightly cooler
Sea Surface Temperature and
Ocean Heat Content. The eye and its mesovortices continued to be prominent in Himawari-8 Visible and Infrared imagery
(below).
Himawari-8 “Red” Visible (0.64 µm, left) and “Clean” Infrared Window (10.4 µm, right) images [click to play MP4 animation]
View only this post
Read Less
![MIMIC TC morphed microwave image product [click to play animation]](https://cimss.ssec.wisc.edu/satellite-blog/wp-content/uploads/sites/5/2018/07/180706_Maria_mimic_tc_anim.gif)


![Suomi NPP VIIRS Day/Night Band (0.7 µm) and Infrared Window (11.45 µm) images [click to enlarge]](https://cimss.ssec.wisc.edu/satellite-blog/wp-content/uploads/sites/5/2018/07/180704_0805utc_suomi_npp_viirs_DayNightBand_InfraredWindow_ND_SD_MCS_anim.gif)
![NOAA-20 VIIRS Day/Night Band (0.7 µm) and Infrared Window (11.45 µm) images [click to enlarge]](https://cimss.ssec.wisc.edu/satellite-blog/wp-content/uploads/sites/5/2018/07/180704_0855utc_noaa20_viirs_DayNightBand_InfraredWindow_ND_SD_MCS_anim.gif)
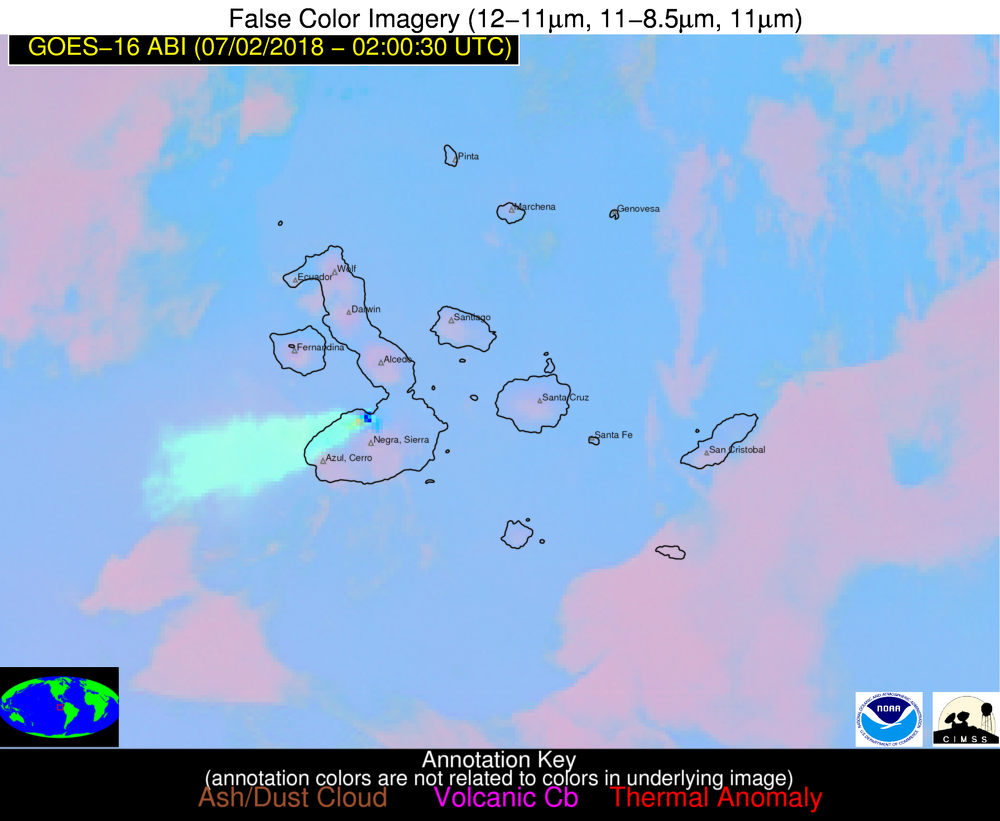
![GOES-16 False Color RGB images [click to play animation]](https://cimss.ssec.wisc.edu/satellite-blog/wp-content/uploads/sites/5/2018/07/180701_goes16_falsecolor_Sierra_Negra_anim.gif)
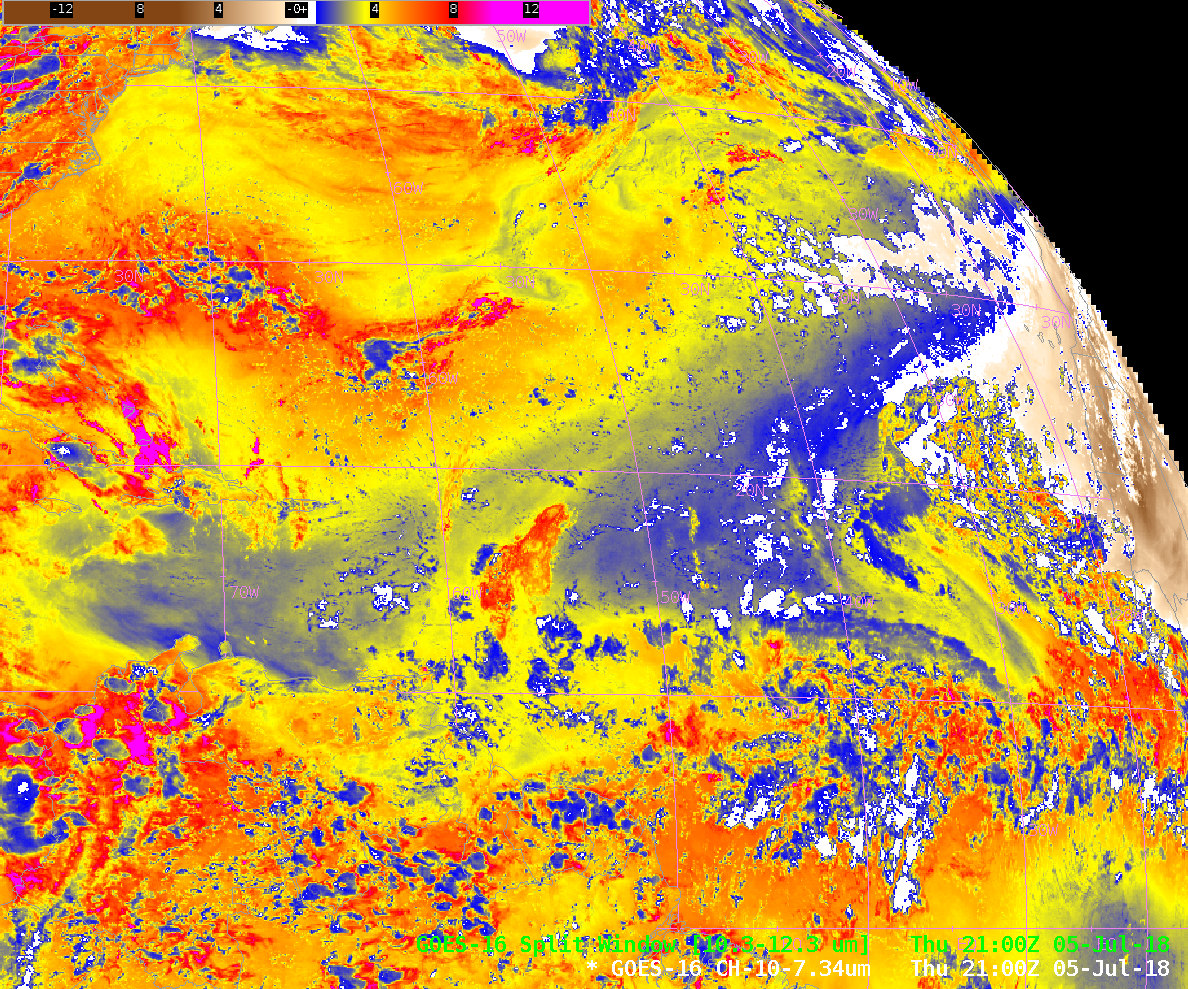
![GOES-16 Low-level Water Vapor (7.3 µm) images [click to play animation | MP4]](https://cimss.ssec.wisc.edu/satellite-blog/wp-content/uploads/sites/5/2018/07/180701_goes16_water_vapor_Sierra_Negra_anim.gif)
