
GOES-16 (GOES-East) “Red” Visible (0.64 µm) and Shortwave Infrared (3.9 µm) images (above) showed the smoke and pyrocumulus clouds as well as the thermal anomaly or “hot spot” (red pixels) associated with the Cranston Fire — located in the center of the images — which started southwest of Palm Springs, California (KPSP) around... Read More
GOES-16 “Red” Visible (0.64 µm, left) and Shortwave Infrared (3.9 µm, right) images, with hourly plots of surface reports [click to play animation | MP4]
GOES-16
(GOES-East) “Red” Visible (
0.64 µm) and Shortwave Infrared (
3.9 µm) images
(above) showed the smoke and pyrocumulus clouds as well as the thermal anomaly or “hot spot”
(red pixels) associated with the
Cranston Fire — located in the center of the images — which started southwest of Palm Springs, California (KPSP) around 1852 UTC or 11:52 am PDT on
25 July 2018. The large areas of red seen on the Shortwave Infrared images early in the animation were signatures of very hot sandy soil surfaces of the southern California deserts. Note the very warm air temperatures seen across the region; Palm Springs had an afternoon high of 116ºF, and Thermal KTRM had a high of 119ºF (farther inland, Death Valley had a high of 127ºF).
A slightly different view — with the fire located in the lower left corner, southwest of KPSP — using GOES-16 “Red” Visible (0.64 µm), Shortwave Infrared (3.9 µm) and “Clean” Infrared Window (10.3 µm) images (below) revealed that the fire actually produced 3 distinct pulses of pyroCumulonimbus (pyroCb) cloud, where the 10.3 µm cloud-top infrared brightness temperature reached or exceeded the -40ºC threshold (lime green enhancement). Three specific times that these separate pyroCb clouds were evident were 2102 UTC, 2147 UTC and 2312 UTC.
![GOES-16 "Red" Visible (0.64 µm, left), Shortwave Infrared (3.9 µm, center) and "Clean" Infrared Window (10.3) images, with 4-letter airport identifiers plotted in yellow [click to play animation | MP4]](https://cimss.ssec.wisc.edu/satellite-blog/wp-content/uploads/sites/5/2018/07/G16_VIS_SWIR_IR_CA_PYROCB_25JUL2018_960x427_B2713_2018206_214719_0003PANELS_00034.GIF)
GOES-16 “Red” Visible (0.64 µm, left), Shortwave Infrared (3.9 µm, center) and “Clean” Infrared Window (10.3 µm, right) images, with 4-letter airport identifiers plotted in yellow [click to play animation | MP4]
Another view of the pyroCb pulses was provided by a 4-panel view of GOES-16 “Red” Visible (0.64 µm), Shortwave Infrared (3.9 µm), “Clean” Infrared Window (10.3 µm) and Cloud Top Phase
(below). The coldest 10.3 µm cloud-top infrared brightness temperatures were -55ºC as the primary pyroCb anvil drifted northeastward toward the California/Nevada border.
![GOES-16 "Red" Visible (0.64 µm, top left), Shortwave Infrared (3.9 µm, top right), "Clean" Infrared Window (10.3 µm, bottom left) and Cloud Top Phase (bottom right) images [click to play animation | MP4]](https://cimss.ssec.wisc.edu/satellite-blog/wp-content/uploads/sites/5/2018/07/CA_pyrocb_4panel-20180726_020719.png)
GOES-16 “Red” Visible (0.64 µm, top left), Shortwave Infrared (3.9 µm, top right), “Clean” Infrared Window (10.3 µm, bottom left) and Cloud Top Phase (bottom right) images [click to play animation | MP4]
There was also substantial lightning observed with these pyroCb clouds:
Below is a timelapse video of the first 8 hours of the fire, which shows the pyroCb evolution at the end.
![Timelapse of Cranston Fire [click to play YouTube video]](https://cimss.ssec.wisc.edu/satellite-blog/wp-content/uploads/sites/5/2018/07/180725_webcam_Cranston_Fire_CA.jpeg)
Timelapse of Cranston Fire [click to play YouTube video]
===== 26 July Update =====
![GOES-16 "Red" Visible (0.64 µm, top left), Shortwave Infrared (3.9 µm, top right), "Clean" Infrared Window (10.3 µm, bottom left) and Fire Temperature (bottom right) images [click to play animation | MP4]](https://cimss.ssec.wisc.edu/satellite-blog/wp-content/uploads/sites/5/2018/07/CA_pyrocb_4panel-20180726_210220.png)
GOES-16 “Red” Visible (0.64 µm, top left), Shortwave Infrared (3.9 µm, top right), “Clean” Infrared Window (10.3 µm, bottom left) and Fire Temperature (bottom right) images [click to play animation | MP4]
Another pyroCb was produced by the Cranston Fire on 26 July, as shown by GOES-16 “Red” Visible (0.64 µm), Shortwave Infrared (3.9 µm), “Clean” Infrared Window (10.3 µm) and Fire Temperature images
(above). Similar to the previous day, there appeared to be 2 pulses of pyroCb formation — with cloud-top infrared brightness temperatures cooling to -44ºC. Pyrocumulus from the smaller Ribbon Fire (just southeast of the Cranston Fire) could also be seen.
View only this post
Read Less
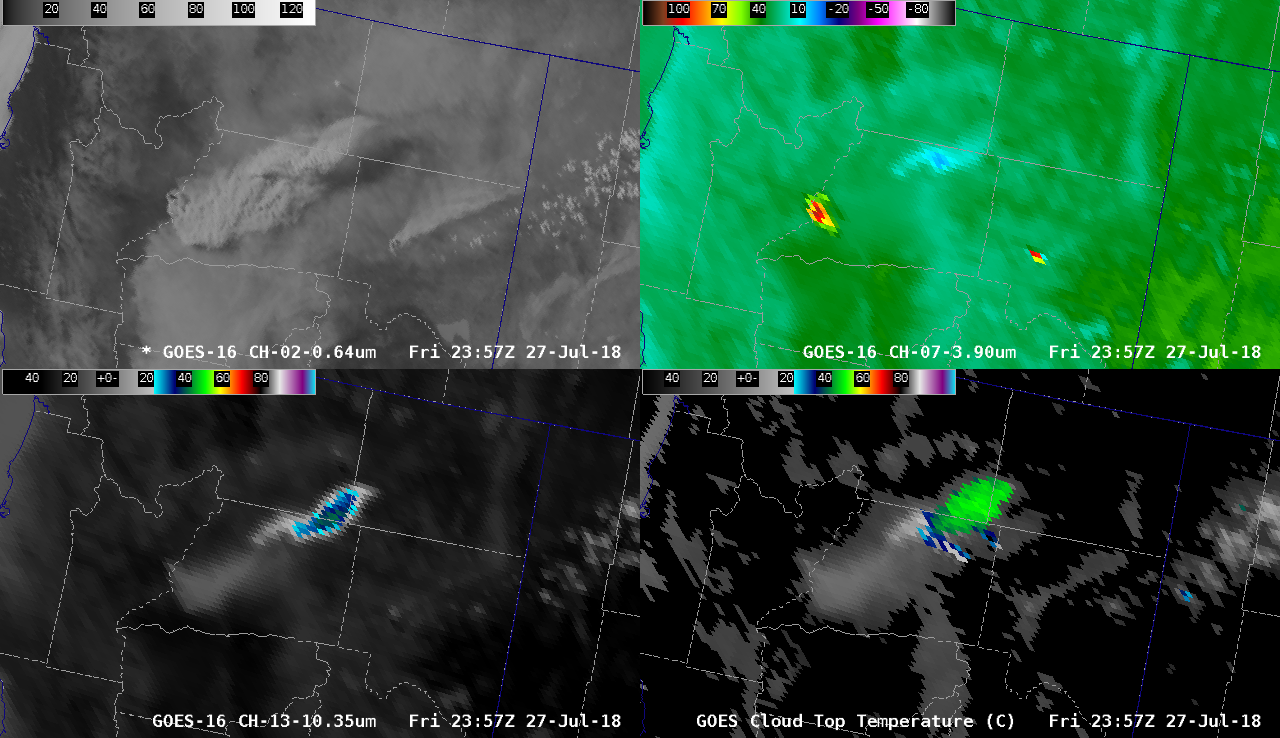
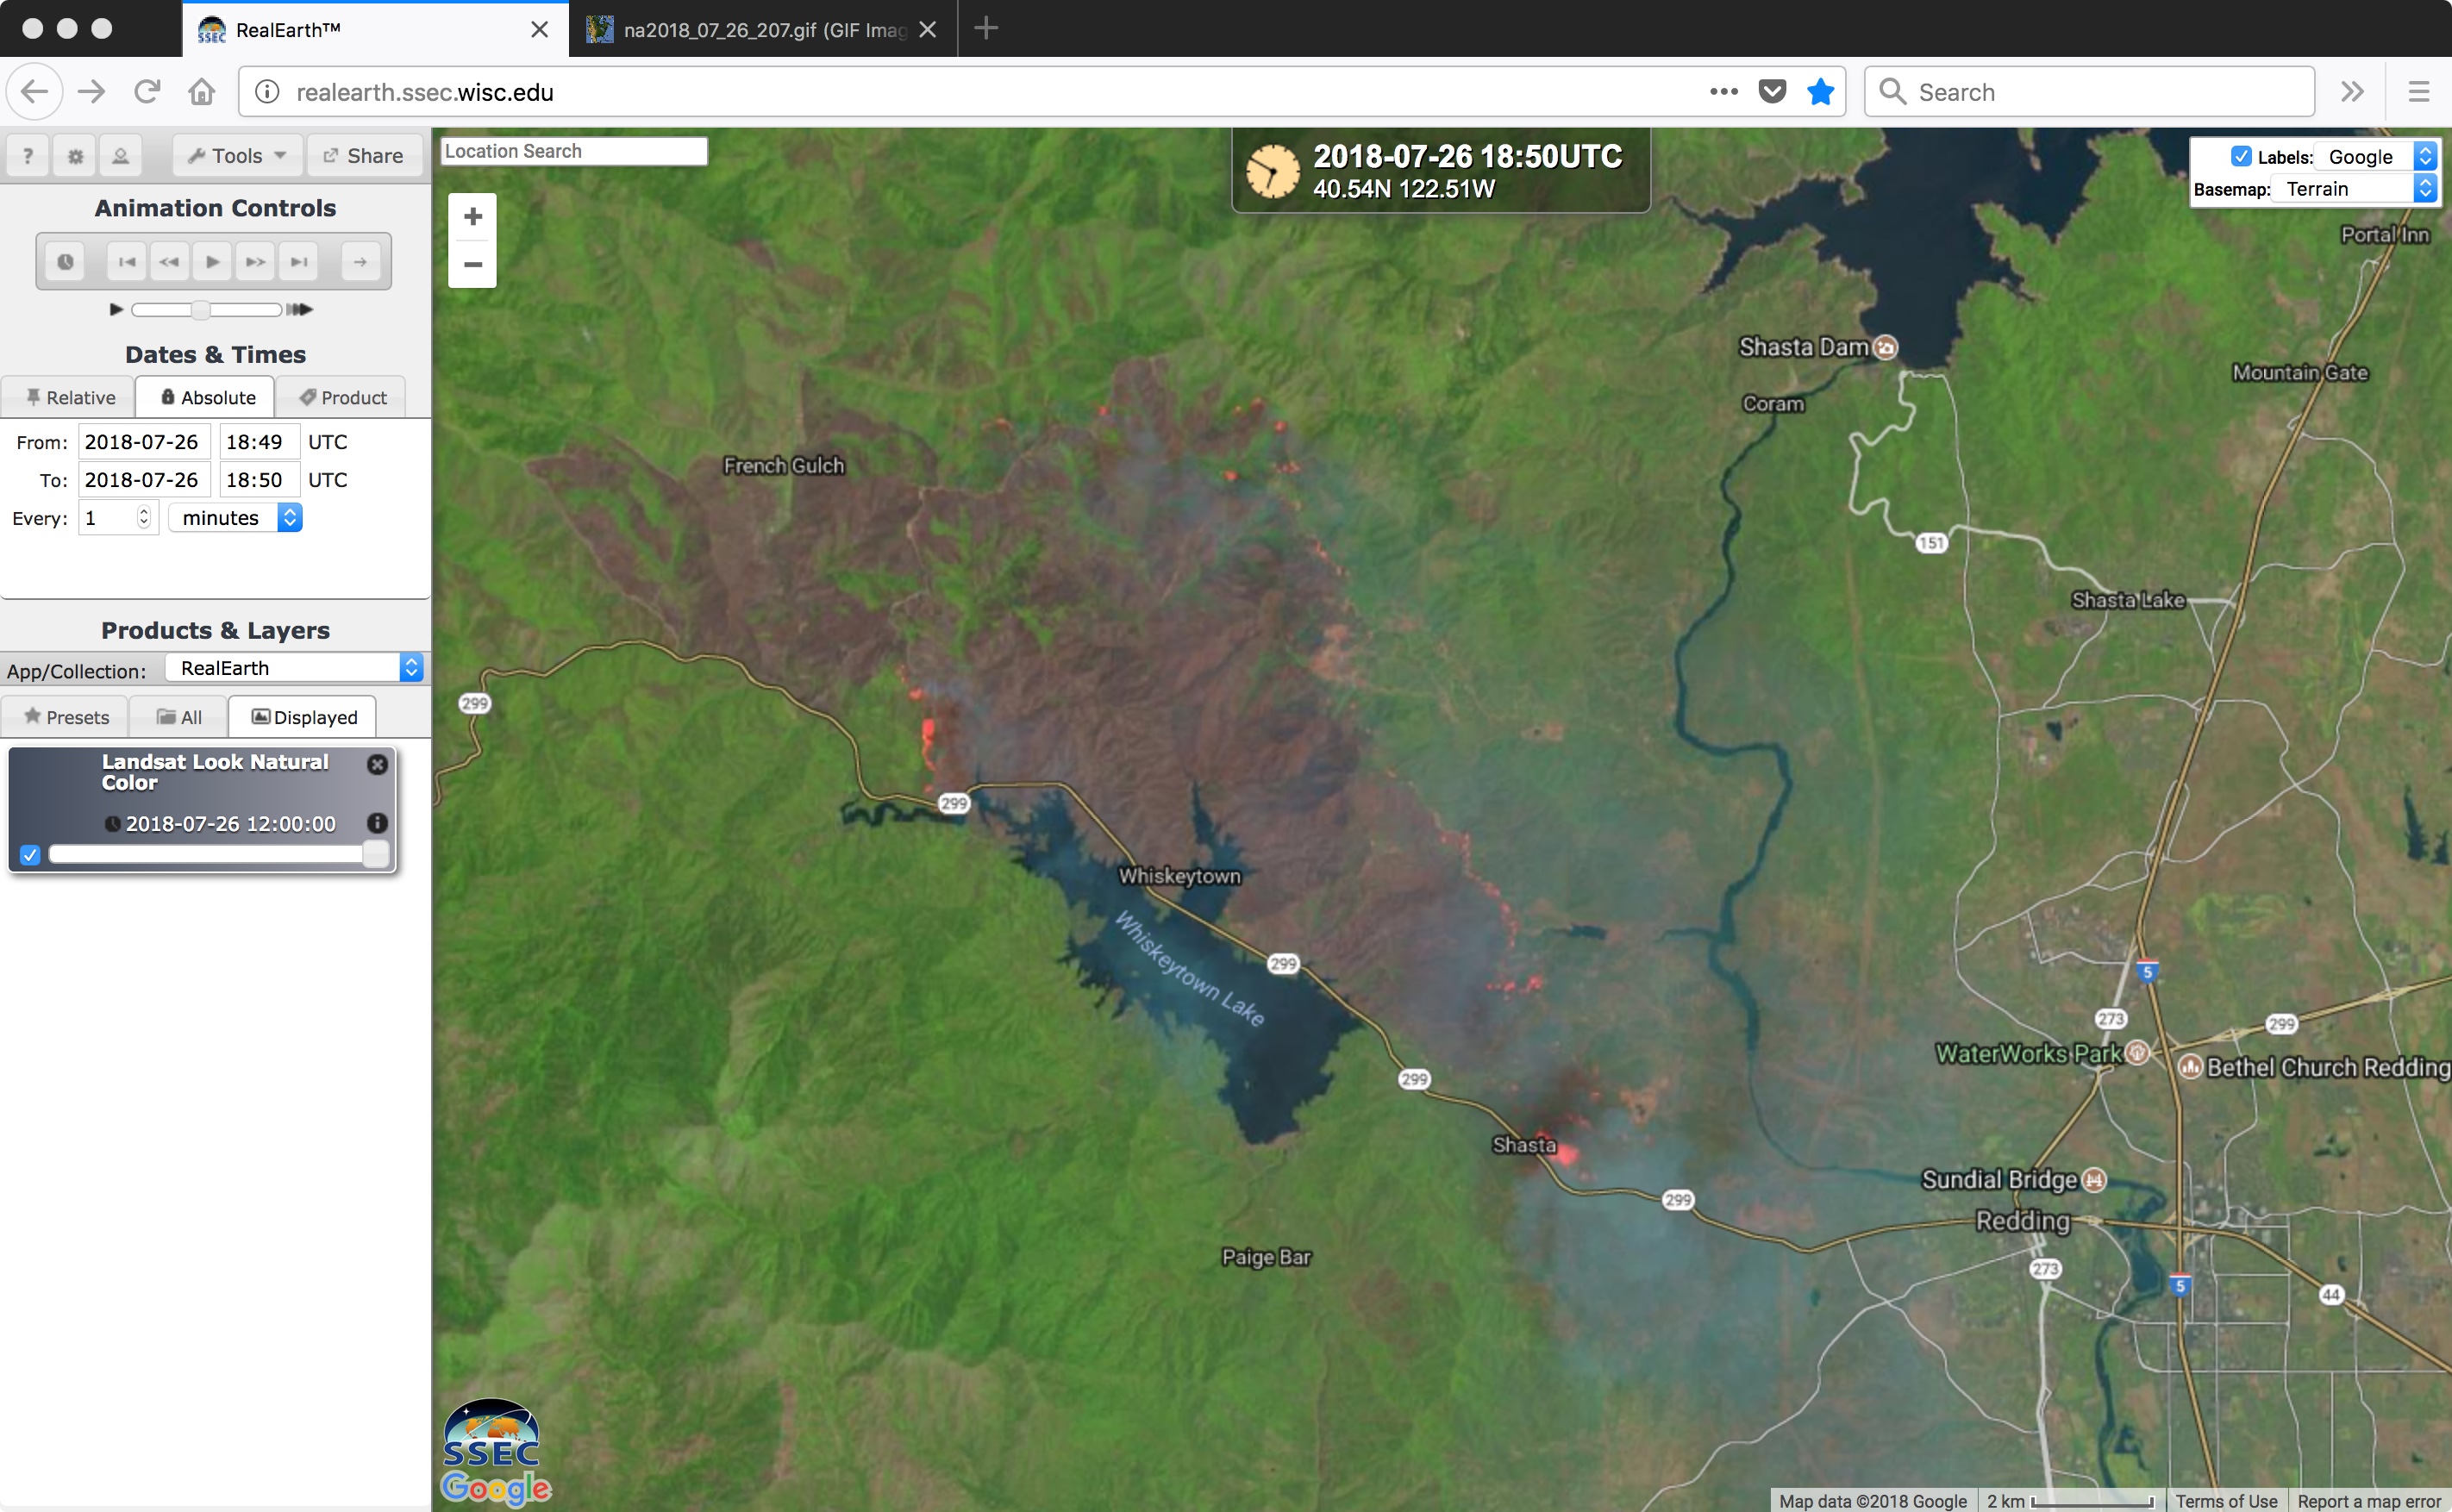
![GOES-16 "Red" Visible (0.64 µm, top left), Shortwave Infrared (3.9 µm, top right), "Clean" Infrared Window (10.3 µm, bottom left) and Cloud Top Temperature product (bottom right) [click to play MP4 animation]](https://cimss.ssec.wisc.edu/satellite-blog/wp-content/uploads/sites/5/2018/07/Carr_Fire_CA-20180727_235756.png)
![Plot of 00 UTC rawinsonde data from Reno, Nevada [click to enlarge]](https://cimss.ssec.wisc.edu/satellite-blog/wp-content/uploads/sites/5/2018/07/180728_00UTC_KREV_RAOB.GIF)

![Terra MODIS True Color and False Color RGB images [click to enlarge]](https://cimss.ssec.wisc.edu/satellite-blog/wp-content/uploads/sites/5/2018/07/180730_1755utc_terra_modis_truecolor_falsecolor_South_Dakota_hail_damage_swath_anim.gif)
![MODIS True Color RGB images from 16 July and 30 July [click to enlarge]](https://cimss.ssec.wisc.edu/satellite-blog/wp-content/uploads/sites/5/2018/07/180716_180730_modis_truecolor_SD_anim.gif)
![Terra MODIS True Color RGB images from 16 and 30 July [click to enlarge]](https://cimss.ssec.wisc.edu/satellite-blog/wp-content/uploads/sites/5/2018/07/180716_180730_terra_modis_truecolor_SD_anim.gif)
![Terra MODIS Visible (0.65 µm) image and Land Surface Temperature and Normalized Difference Vegetation Index products [click to enlarge]](https://cimss.ssec.wisc.edu/satellite-blog/wp-content/uploads/sites/5/2018/07/180730_1746utc_terra_modis_Visible_LandSurfaceTemperature_NormalizedDifferenceVegetationIndex_SD_anim.gif)
![MODIS True Color RGB images from Terra (14 July) and Aqua (31 July) [click to enlarge]](https://cimss.ssec.wisc.edu/satellite-blog/wp-content/uploads/sites/5/2018/07/180714_180731_terra_modis_truecolor_SD_anim.gif)
![GOES-16 "Red" Visible (0.64 µm, left), Shortwave Infrared (3.9 µm, center) and "Clean" Infrared Window (10.3) images, with 4-letter airport identifiers plotted in yellow [click to play animation | MP4]](https://cimss.ssec.wisc.edu/satellite-blog/wp-content/uploads/sites/5/2018/07/180725_goes16_visible_shortwaveInfrared_infraredWindow_Cranston_Fire_CA_pyrocb_anim.gif)
![GOES-16 "Red" Visible (0.64 µm, top left), Shortwave Infrared (3.9 µm, top right), "Clean" Infrared Window (10.3 µm, bottom left) and Cloud Top Phase (bottom right) images [click to play animation | MP4]](https://cimss.ssec.wisc.edu/satellite-blog/wp-content/uploads/sites/5/2018/07/180725_goes16_4panel_Cranston_Fire_CA_pyrocb_anim.gif)
![GOES-16 "Red" Visible (0.64 µm, top left), Shortwave Infrared (3.9 µm, top right), "Clean" Infrared Window (10.3 µm, bottom left) and Fire Temperature (bottom right) images [click to play animation | MP4]](https://cimss.ssec.wisc.edu/satellite-blog/wp-content/uploads/sites/5/2018/07/180726_goes16_4panel_Cranston_Fire_CA_pyrocb_anim.gif)

![GOES-16 Total Precipitable Water product [click to play animation | MP4]](https://cimss.ssec.wisc.edu/satellite-blog/wp-content/uploads/sites/5/2018/07/180724_goes16_tpw_anim.gif)
![Aqua MODIS Sea Surface Temperature product from 23 July [click to enlarge]](https://cimss.ssec.wisc.edu/satellite-blog/wp-content/uploads/sites/5/2018/07/MODIS_SST_20180723_1743.png)
