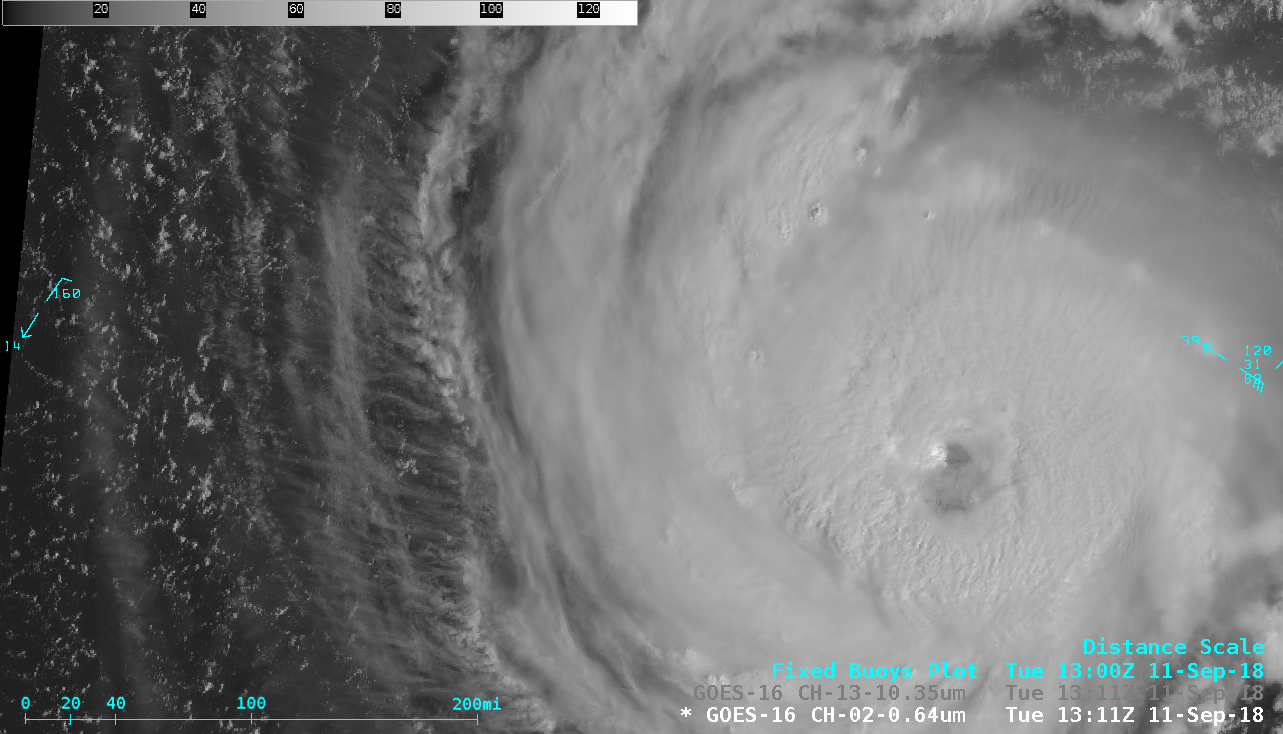
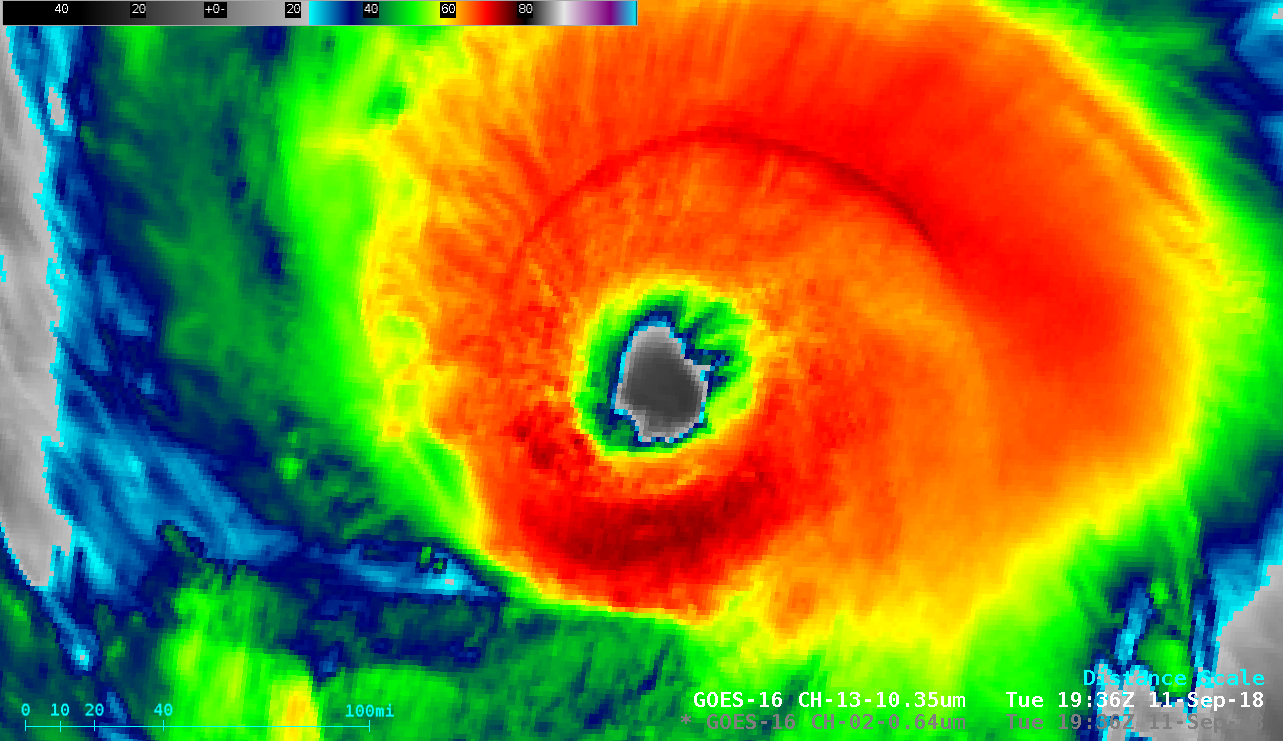
GOES-16 “Red” Visible (0.64 µm) images [click to play MP4 animation]
maintained Category 4 intensity on the morning of 11 September 2018 — and 1-minute (initially 30-second, until 1345 UTC)
Mesoscale Domain Sector GOES-16
(GOES-East) “Red” Visible (
0.64 µm) images
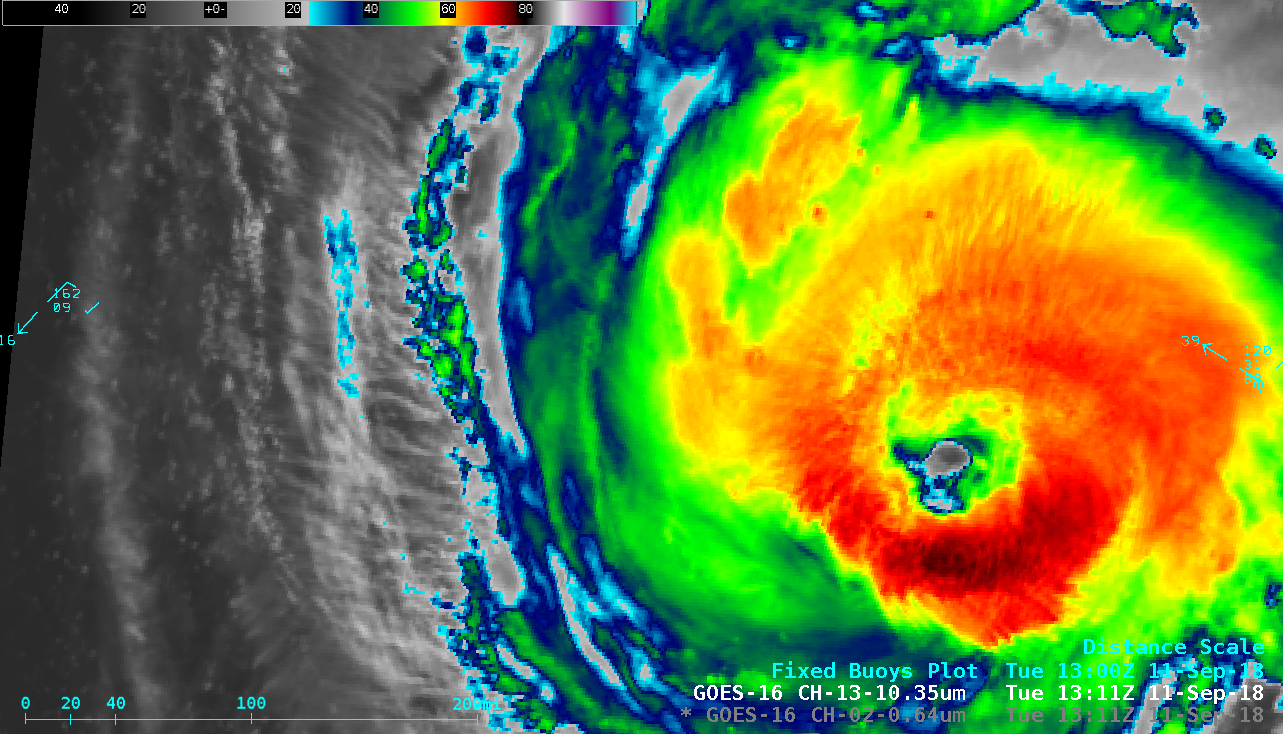
(above) and “Clean” Infrared Window (
10.3 µm) images
(below) showed improving eye structure after the tropical cyclone completed an eyewall replacement cycle during the preceding nighttime hours (
MIMIC TC). A distinct pattern of transverse banding was also evident within the northern semicircle of Florence on Infrared imagery.
GOES-16 “Clean” Infrared Window (10.3 µm) images [click to play MP4 animation]
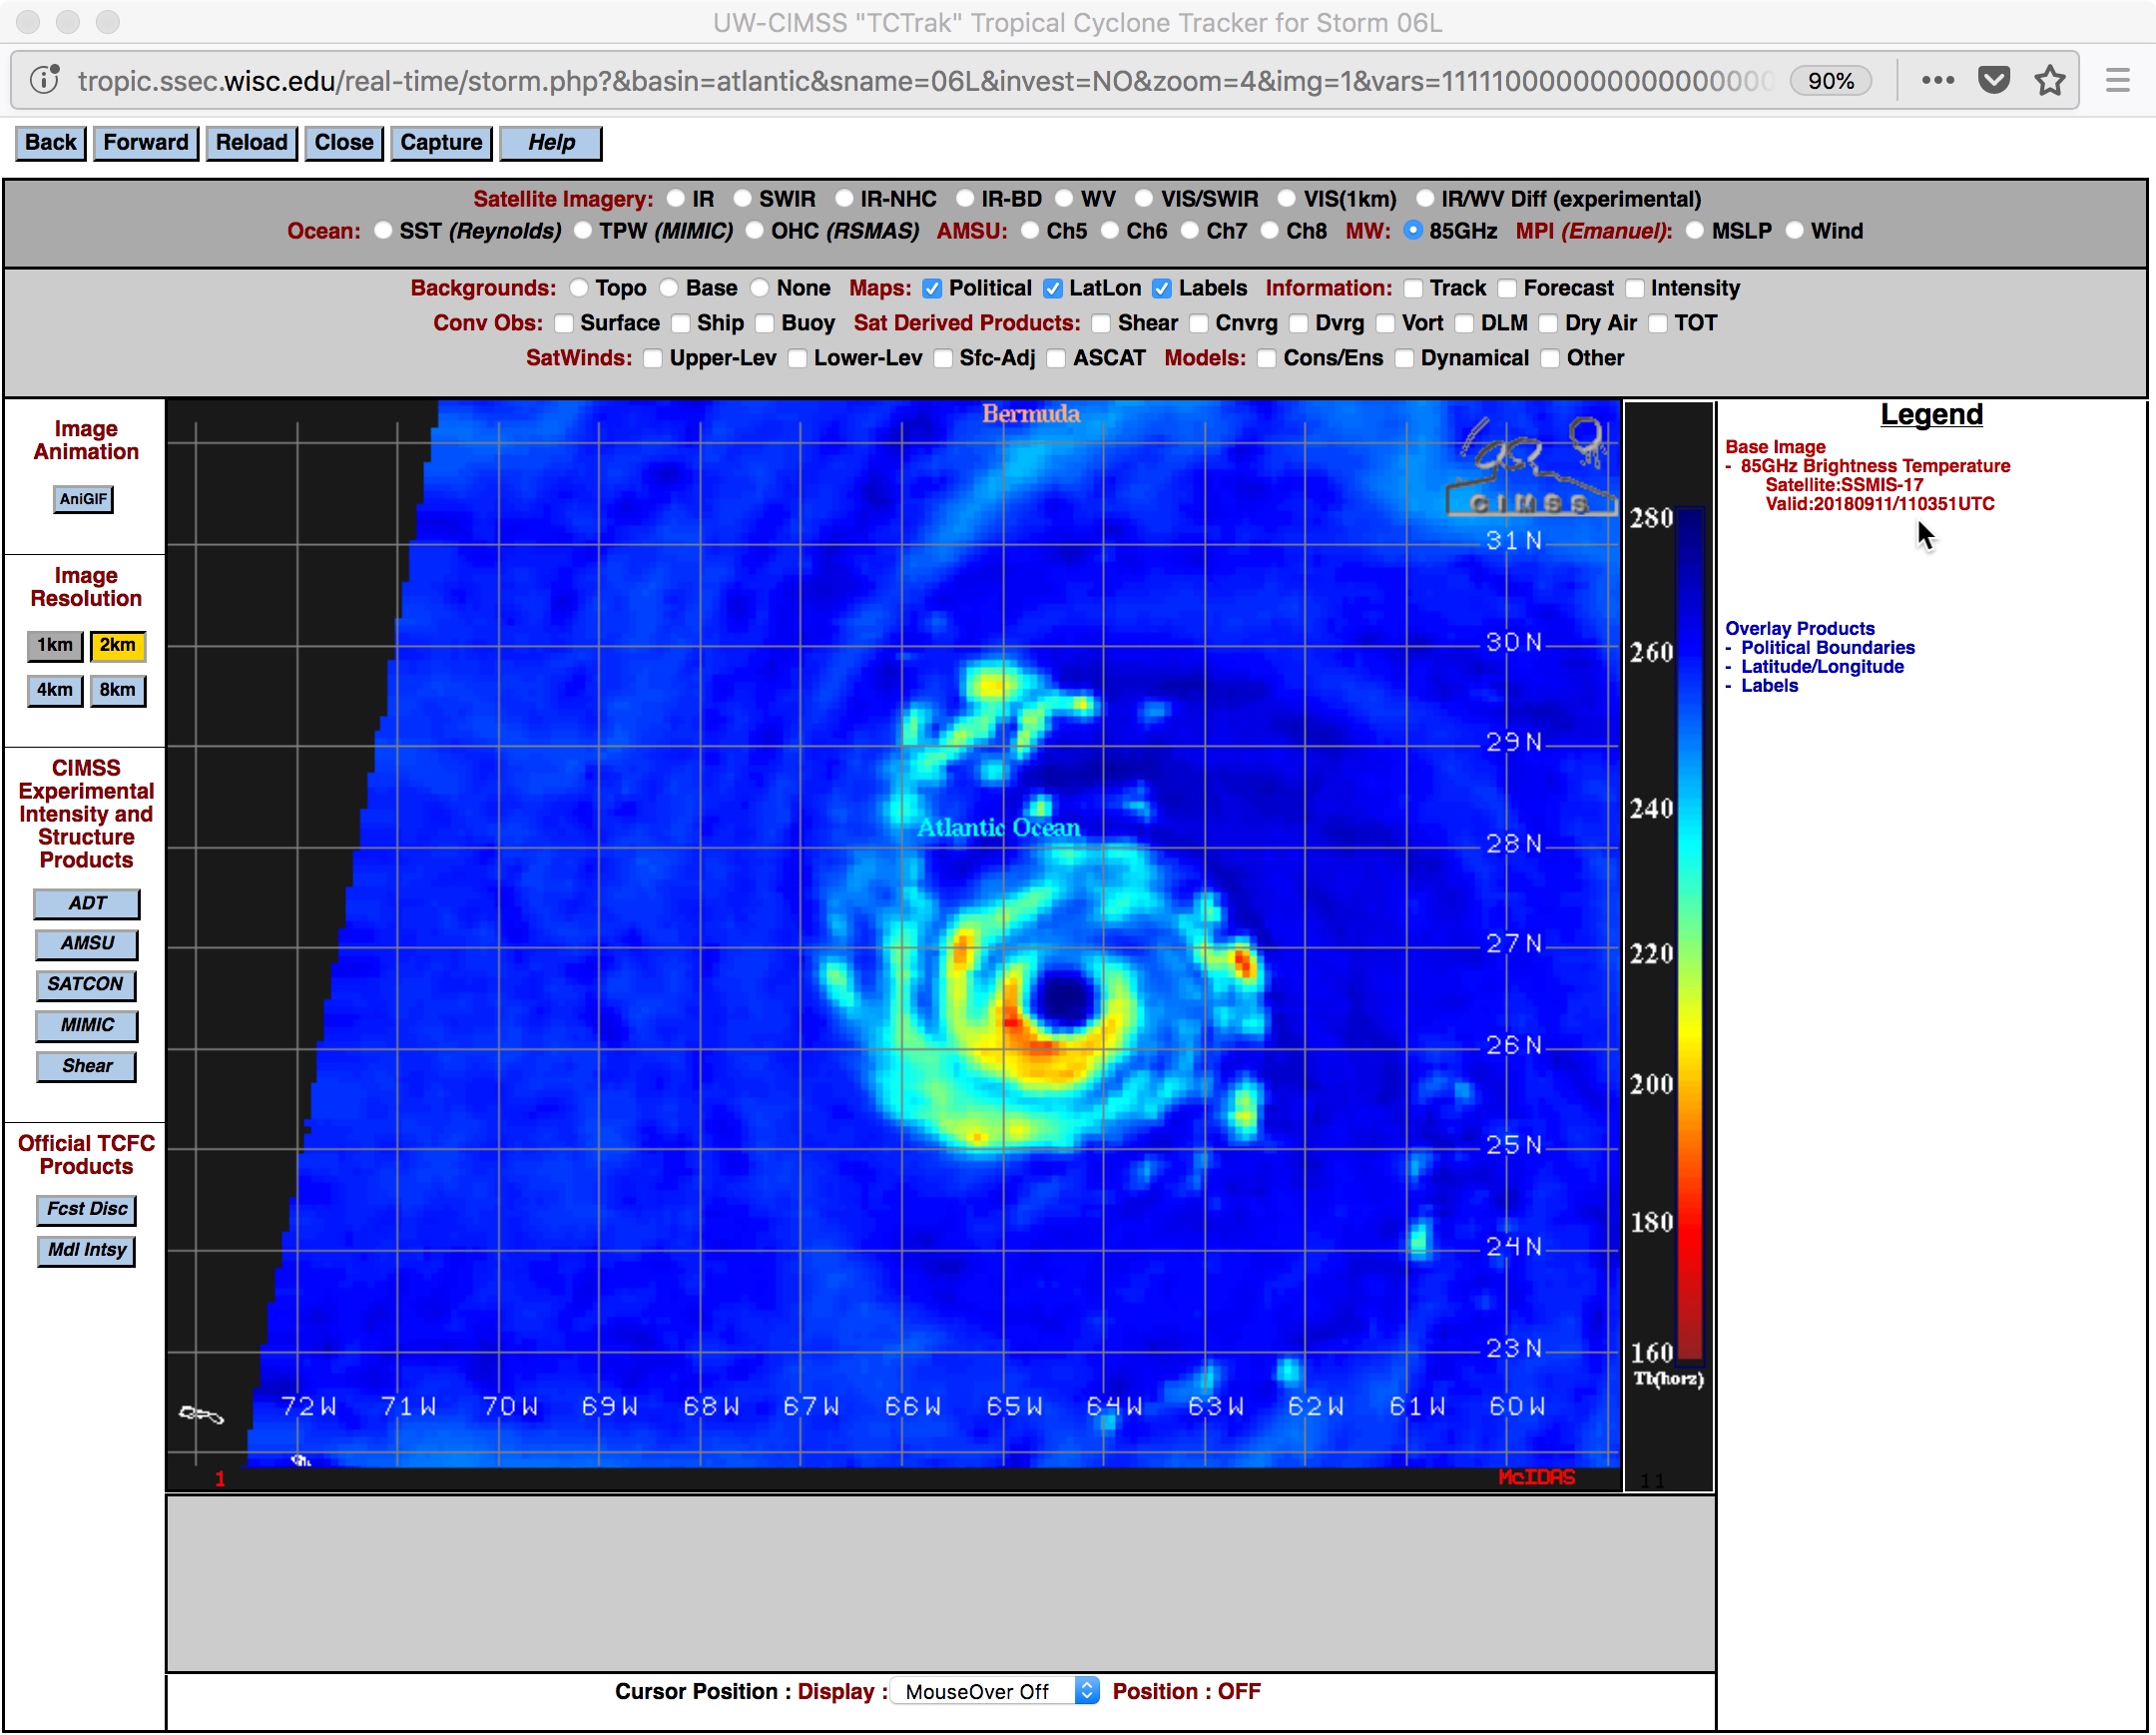
DMSP-18 SSMIS Microwave (85 GHz) imagery from the
CIMSS Tropical Cyclones site
(below) showed a large eye at 1015 UTC, and also at
1103 UTC.
DMSP-18 SSMIS Microwave (85 GHz) and GOES-16 “Clean” Infrared Window (10.3 µm) images at 1015 UTC [click to enlarge]
GOES-16 Upper-level Water Vapor (
6.2 µm) images with Derived Motion Winds
(below) revealed that a well-defined high altitude outflow channel had developed northwest of Florence, helping the storm to maintain its intensity.
![GOES-16 Upper-level Water Vapor (6.2 µm) images, with Derived Motion Winds [click to play MP4 animation]](https://cimss.ssec.wisc.edu/satellite-blog/wp-content/uploads/sites/5/2018/09/florence_wv_winds-20180911_115713.png)
GOES-16 Upper-level Water Vapor (6.2 µm) images, with Derived Motion Winds [click to play MP4 animation]
1-minute GOES-16 True Color Red-Green-Blue (RGB) images (courtesy of Kathy Strabala, CIMSS;
details) are shown below. A larger-scale RGB animation beginning at sunrise is available
here (courtesy of Rick Kohrs, SSEC).
![GOES-16 natural color RGB images [click to play MP4 animation]](https://cimss.ssec.wisc.edu/satellite-blog/wp-content/uploads/sites/5/2018/09/180911_1300utc_goes16_truecolor_Florence.jpeg)
1-minute GOES-16 True Color RGB images, 1330-1440 UTC [click to play MP4 animation]
Taking a closer look at the center of Florence later in the day, 1-minute GOES-16 data
(below) showed mesovortices within the eye on Visible imagery, along with a narrow radial band of colder
(darker red) cloud-top infrared brightness temperatures about 30-50 miles from the inner edge of the eyewall.
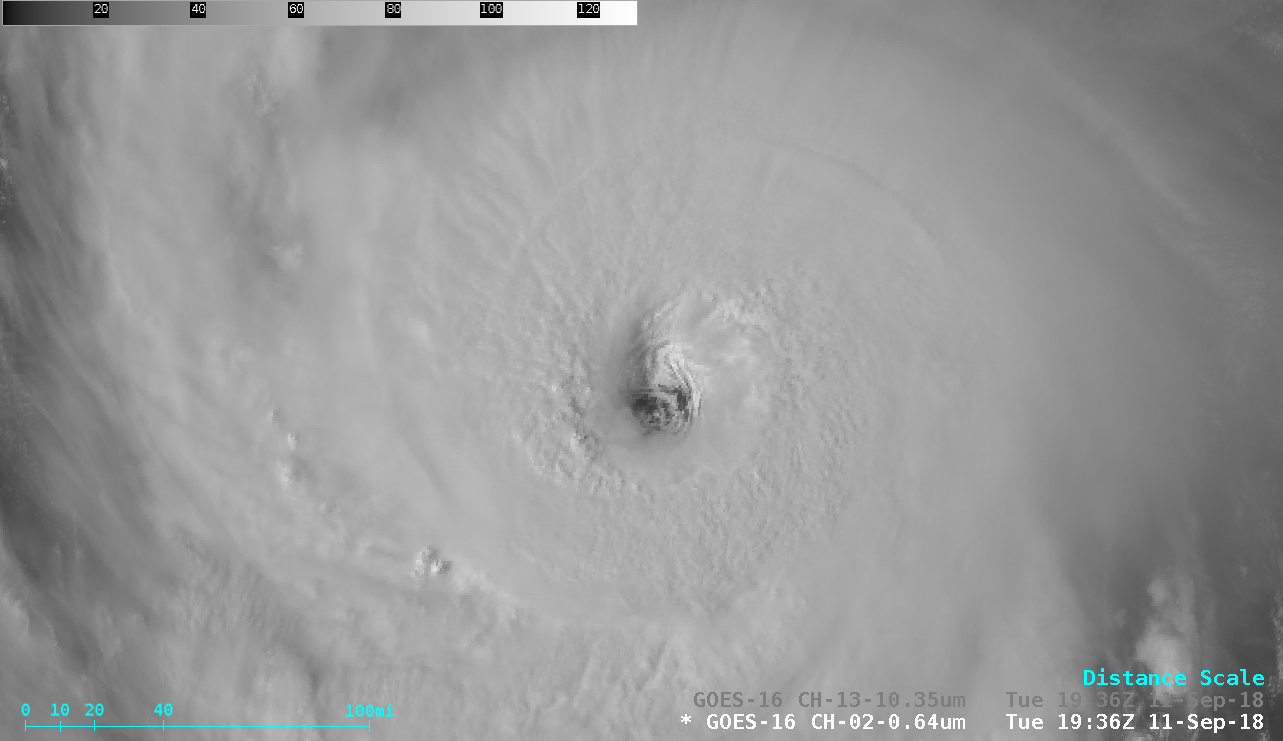
GOES-16 “Red” Viisible (0.64 µm) images [click to play MP4 animation]
GOES-16 “Clean” Infrared Window (10.3 µm) images [click to play MP4 animation]
===== 12 September Update =====
Florence remained at Category 4 intensity early in the day as it continued its northwestward motion toward the southeast coast of the US on 12 September. A 20-hour period of 1-minute GOES-16 Infrared images (from 0000-2015 UTC) is shown below.
1-minute GOES-16 “Clean” Infrared Window (10.3 µm) images, from 0000-2015 UTC [click to play MP4 animation]
Nighttime toggles between VIIRS Day/Night Band (0.7 µm) and Infrared Window (11.45 µm) images from Suomi NPP and NOAA-20 are shown below (courtesy of William Straka, CIMSS). Bright lightning-illuminated cloud areas can be seen on the DNB images distant to the north and northwest of the storm center; with minimal illumination from the Moon
(which was in the Waxing Crescent phase, at only 10% of Full), Florence was illuminated primarily via airglow. On the Infrared images, a coarse pattern of transverse banding was evident along the far southern and western periphery of the storm.
![Suomi NPP VIIRS Day/Night Band and Infrared Window images [click to enlarge]](https://cimss.ssec.wisc.edu/satellite-blog/wp-content/uploads/sites/5/2018/09/180912_0616utc_suomiNPP_DayNightBand_InfraredWindow_Florence_anim.gif)
Suomi NPP VIIRS Day/Night Band (0.7 µm) and Infrared Window (11.45 µm) images [click to enlarge]
![NOAA-20 VIIRS Day/Night Band and Infrared Window images [click to enlarge]](https://cimss.ssec.wisc.edu/satellite-blog/wp-content/uploads/sites/5/2018/09/180912_0706utc_noaa20_DayNightBand_InfraredWindow_Florence_anim.gif)
NOOA-20 VIIRS Day/Night Band (0.7 µm) and Infrared Window (11.45 µm) images [click to enlarge]
A sequence of Terra/Aqua MODIS and Suomi NPP VIIRS Infrared images
(below) showed dramatic changes in the cold central dense overcast (CDO) of Florence between 02 and 18 UTC.
![Infrared Window images from Terra MODIS (11.0 µm) and Suomi NPP VIIRS (11.45 µm) [click to enlarge]](https://cimss.ssec.wisc.edu/satellite-blog/wp-content/uploads/sites/5/2018/09/180912_modis_viirs_infrared_Florence_anim.gif)
Infrared Window images from Terra MODIS (11.0 µm) and Suomi NPP VIIRS (11.45 µm) [click to enlarge]
During the morning hours, 1-minute GOES-16 Visible and Infrared images
(below) once again displayed a distinct eye and eyewall structure, with surface mesovortices evident within the eye. A curious linear standing wave — extending radially outward to the northeast of the storm center — developed from about 13-15 UTC (best seen on Infrared images).
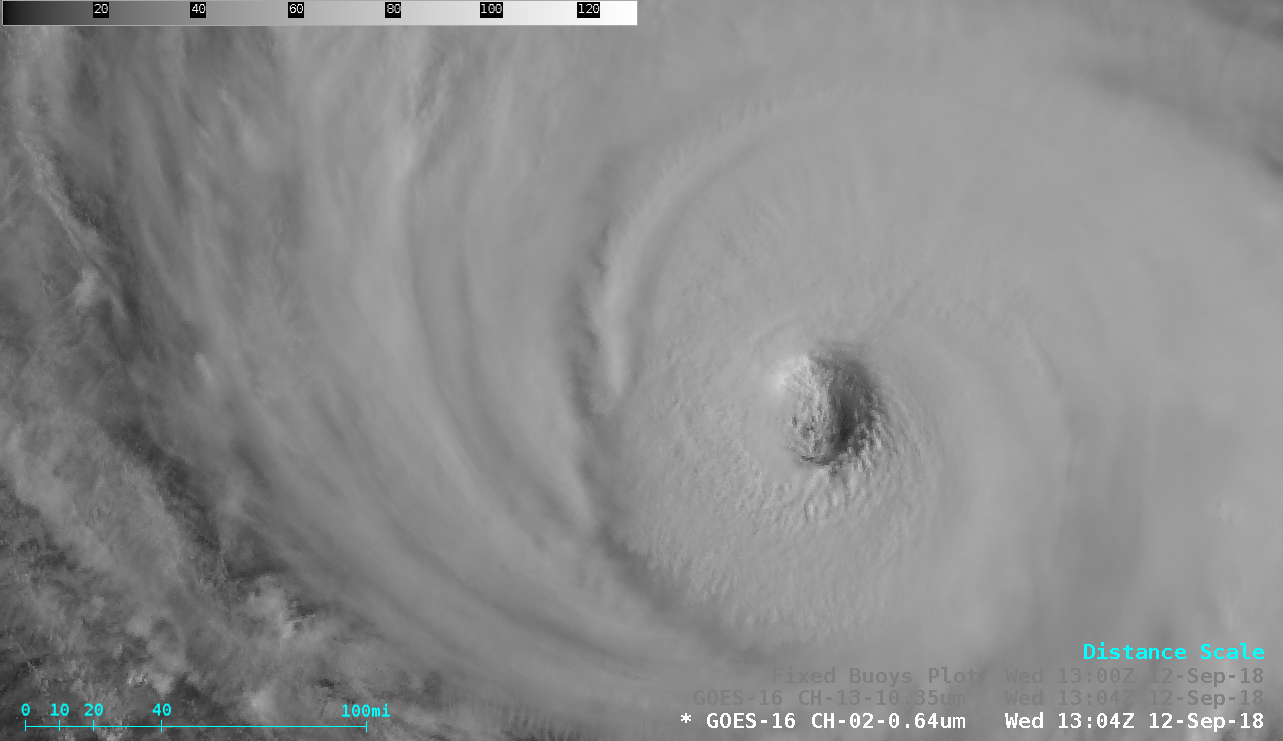
GOES-16 “Red” Visible (0.64 µm) images [click to play MP4 animation]
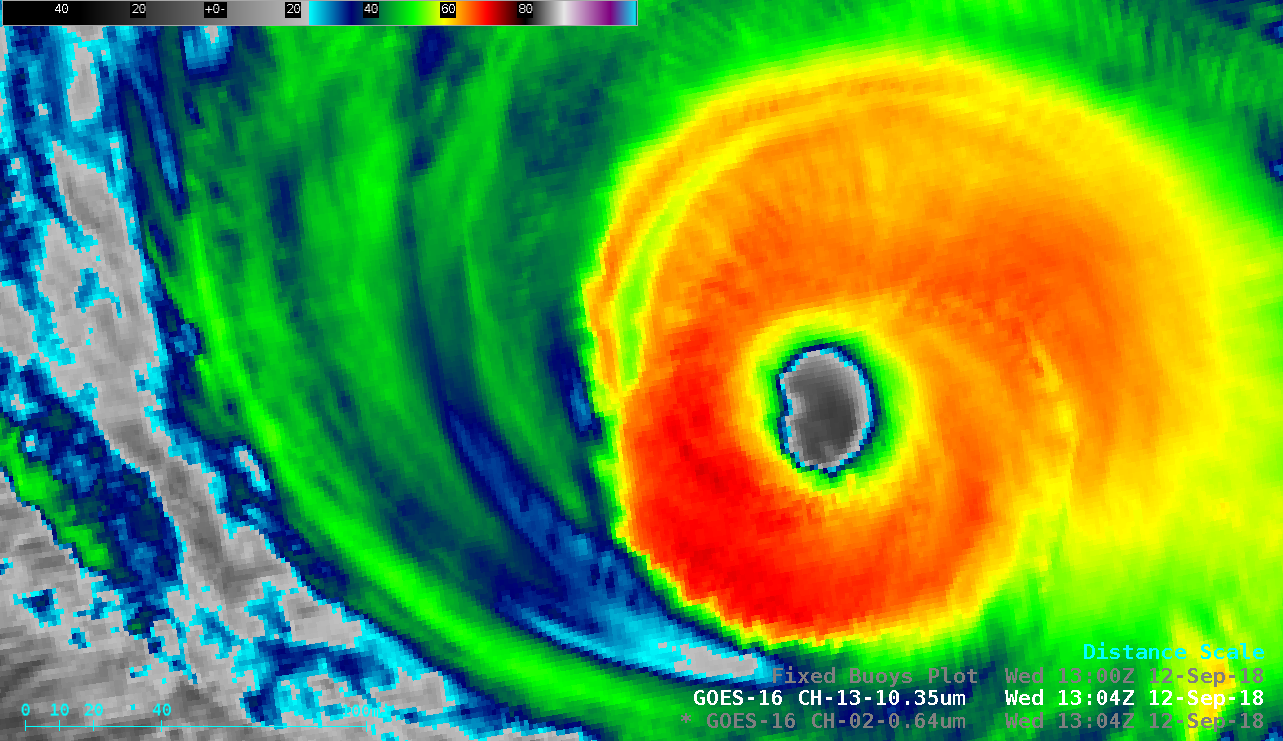
GOES-16 “Clean” Infrared Window (10.3 µm) images [click to play MP4 animation]
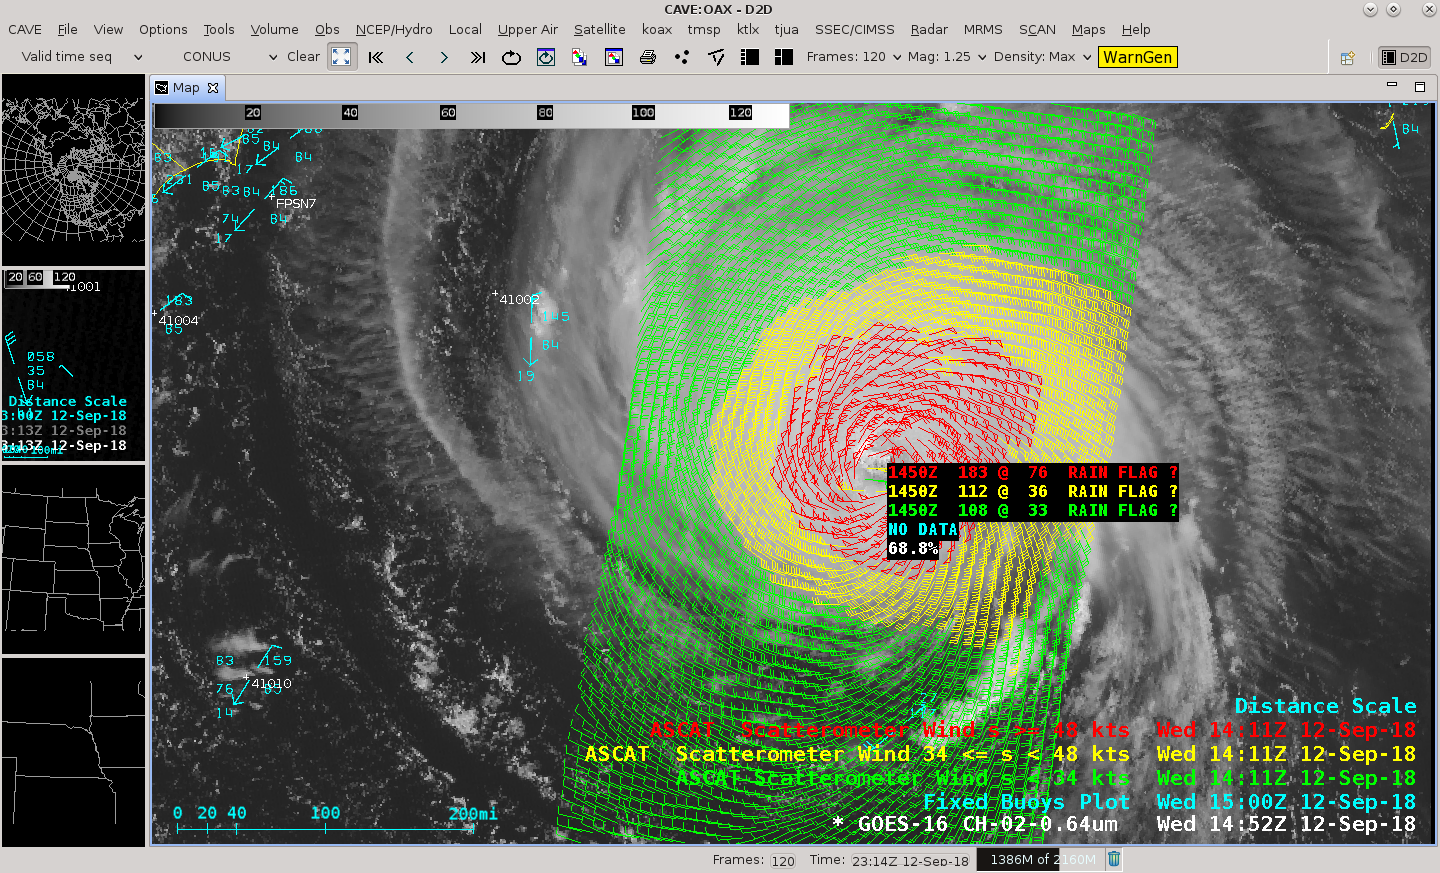
ASCAT surface scatterometer winds from Metop-A
(below) were as strong as
76 knots just northeast of the eye at 1450 UTC.
GOES-16 “Red” Visible (0.64 µm) image with Metop-A ASCAT surface scatterometer winds [click to enlarge]
A stereoscopic animation using GOES-16 and GOES-17 imagery is shown below — to view in three dimensions, cross your eyes until 3 equal images are apparent, then focus on the image in the center. *
Note: GOES-17 images shown here are preliminary and non-operational*
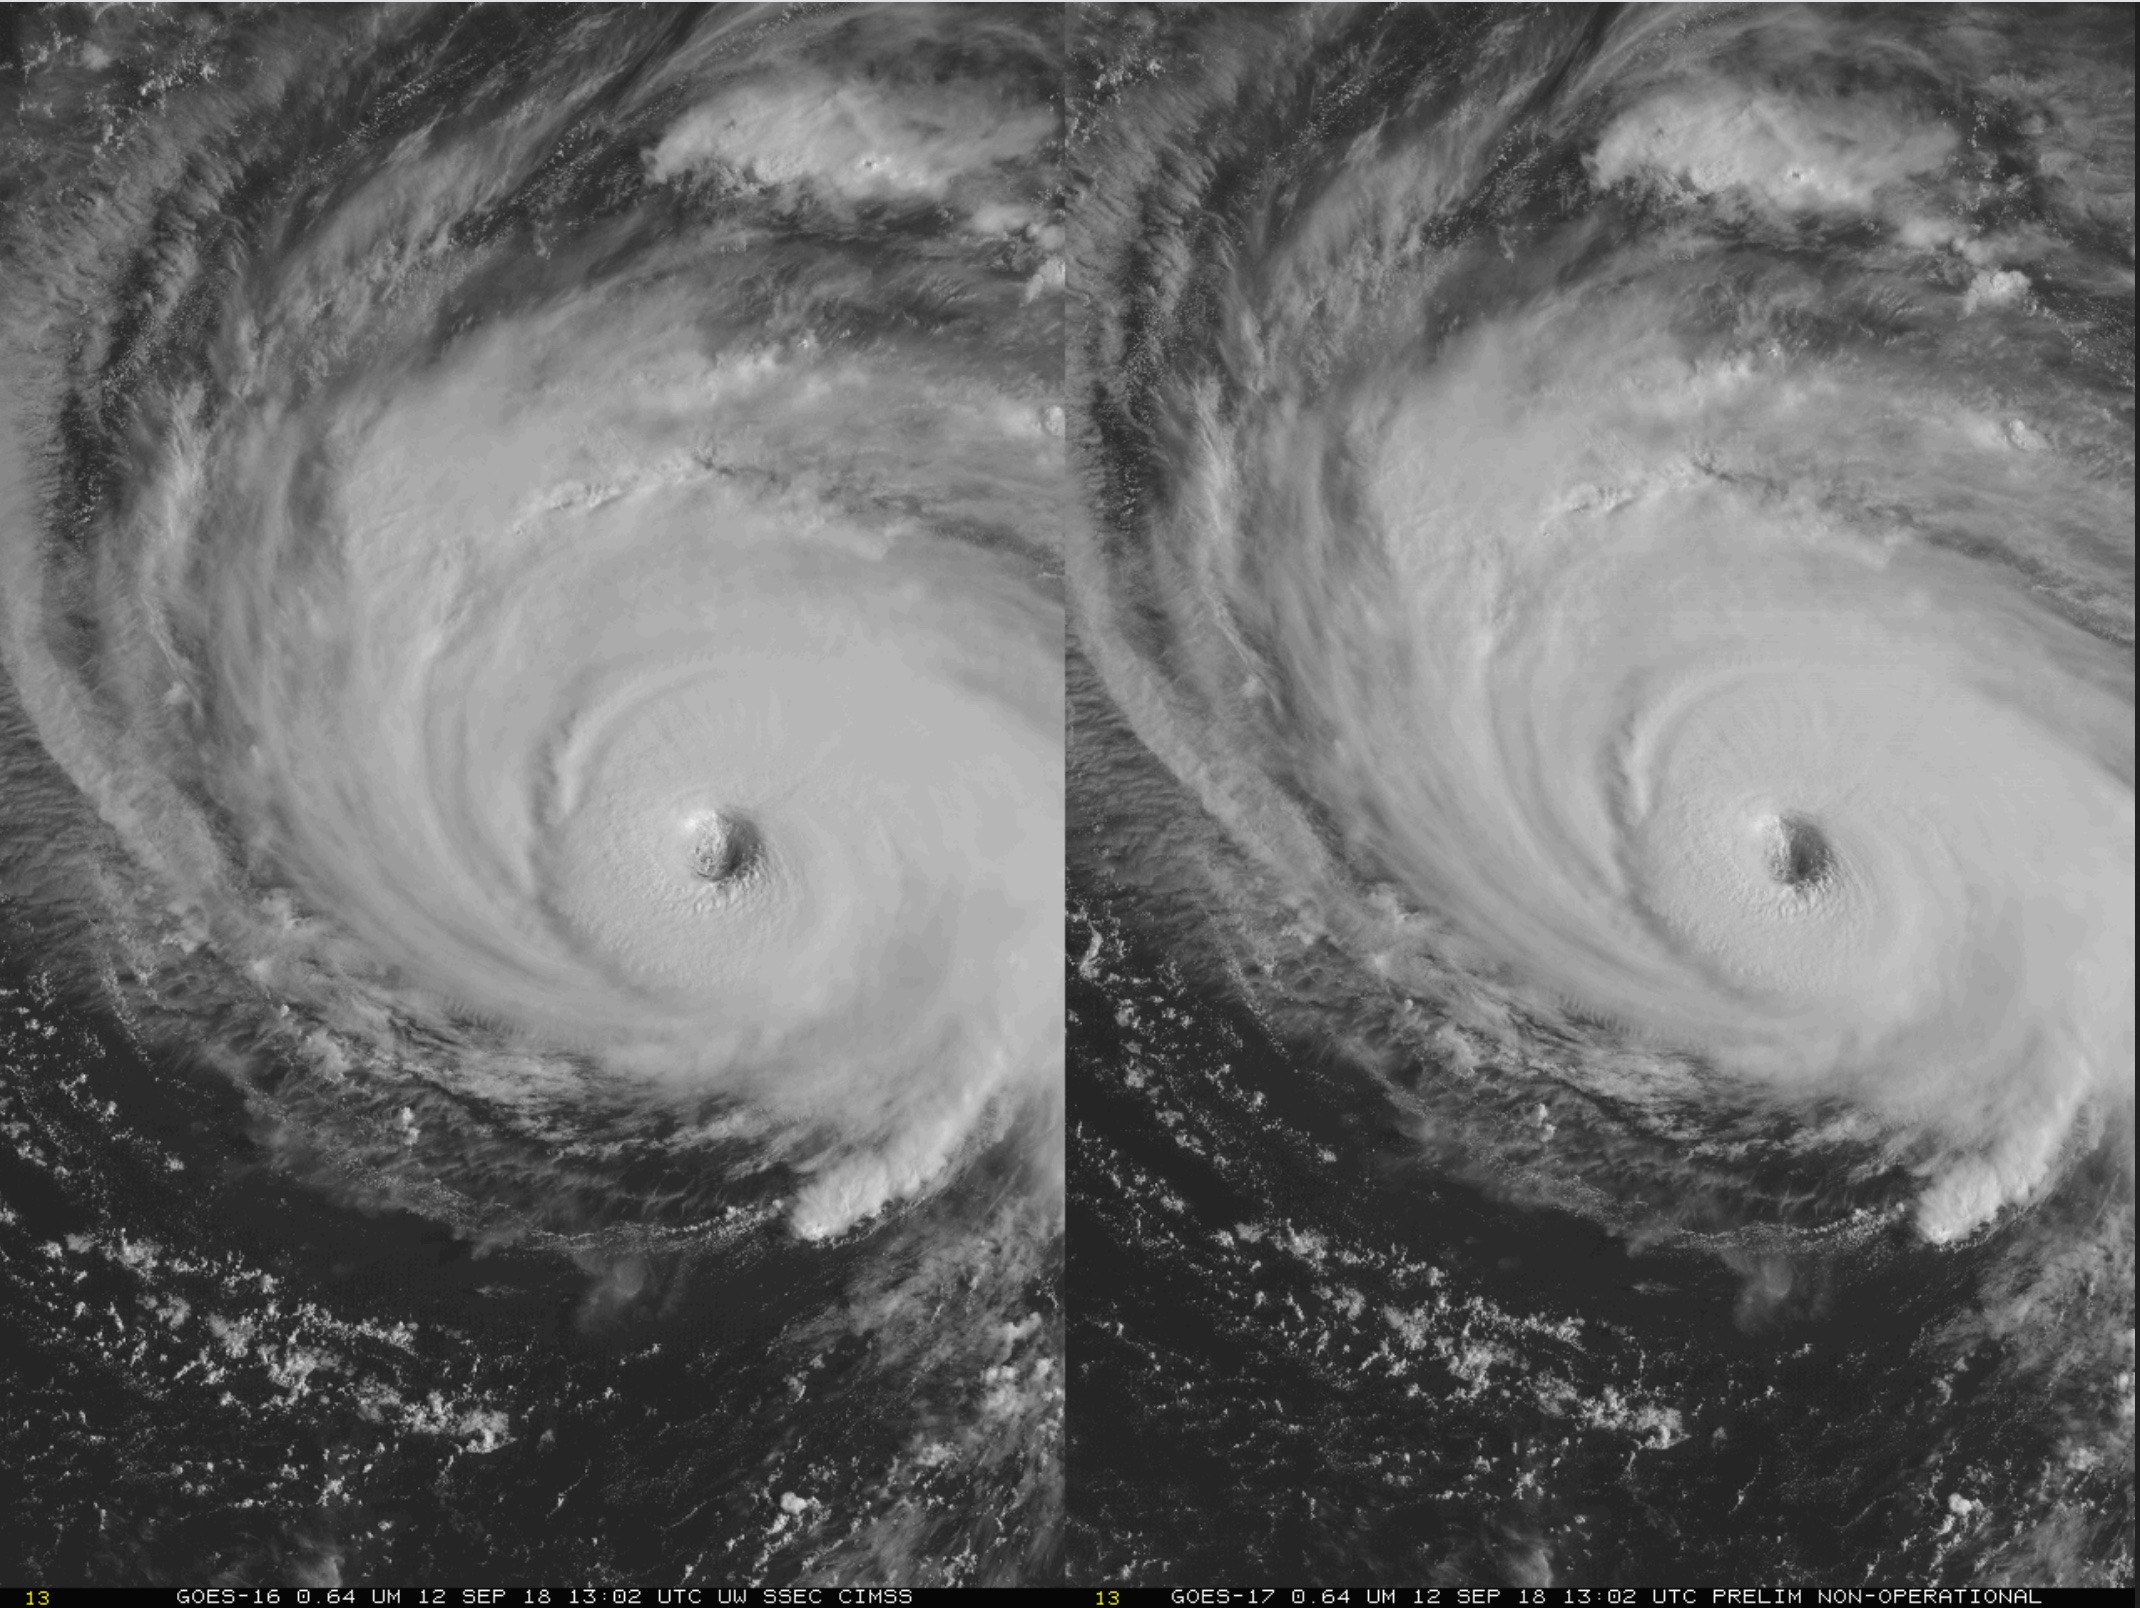
Stereoscopic animation using GOES-16 and GOES-17 “Red” Visible (0.64 µm) imagery [click to play animation]
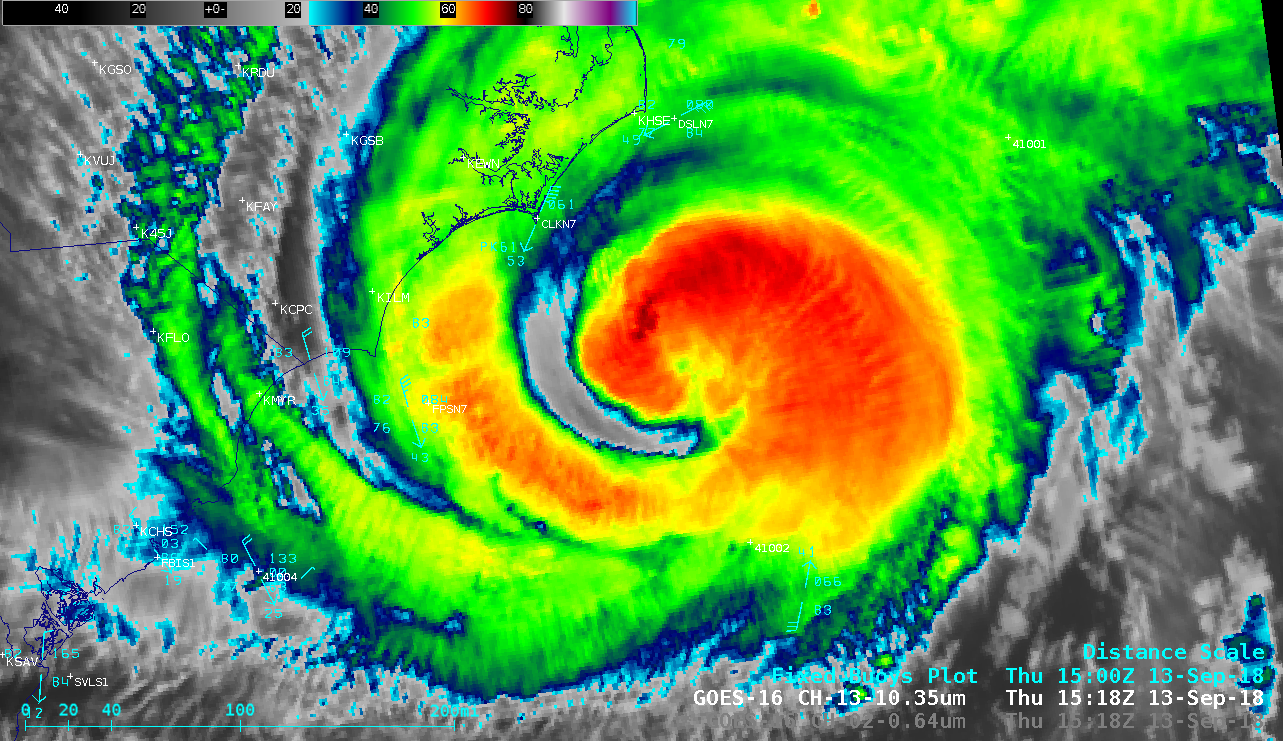
During the afternoon hours, GOES-16 Visible and Infrared images
(below) showed that the eye presentation was beginning to deteriorate as Florence weakened to Category 3 intensity by 21 UTC.
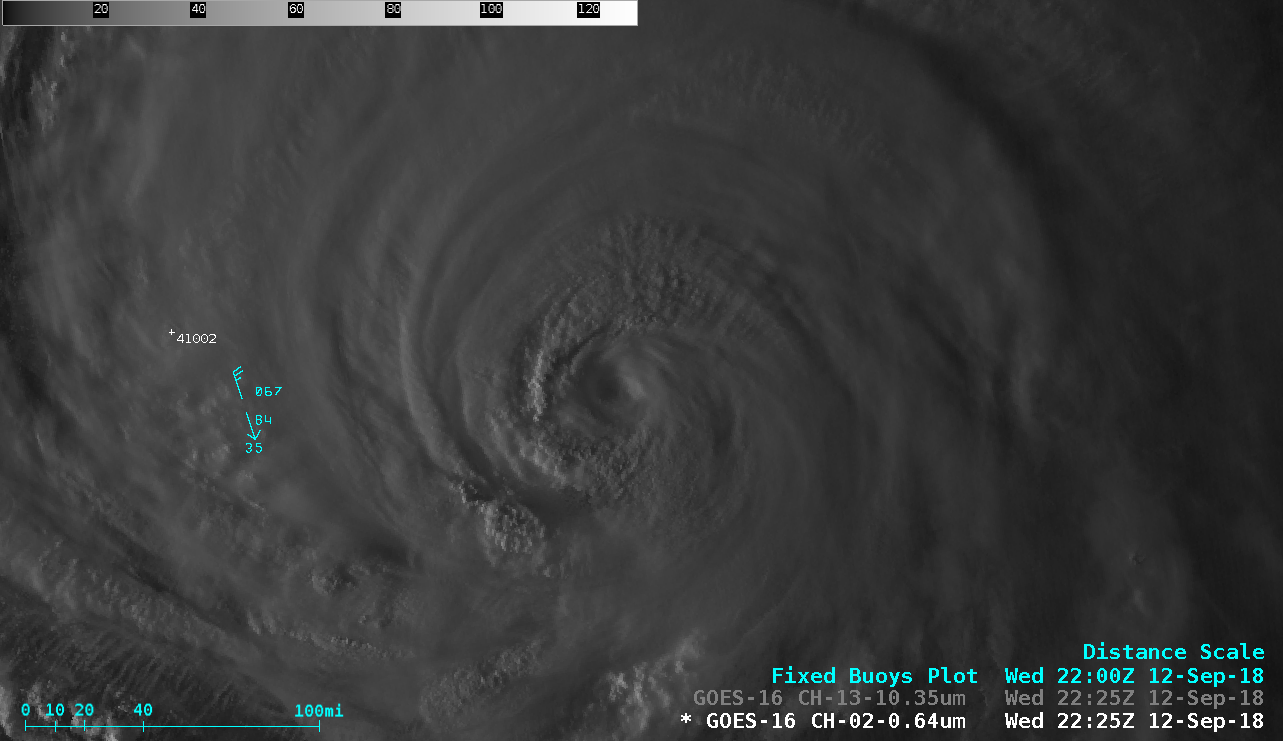
GOES-16 “Red” Visible (0.64 µm) images [click to play MP4 animation]
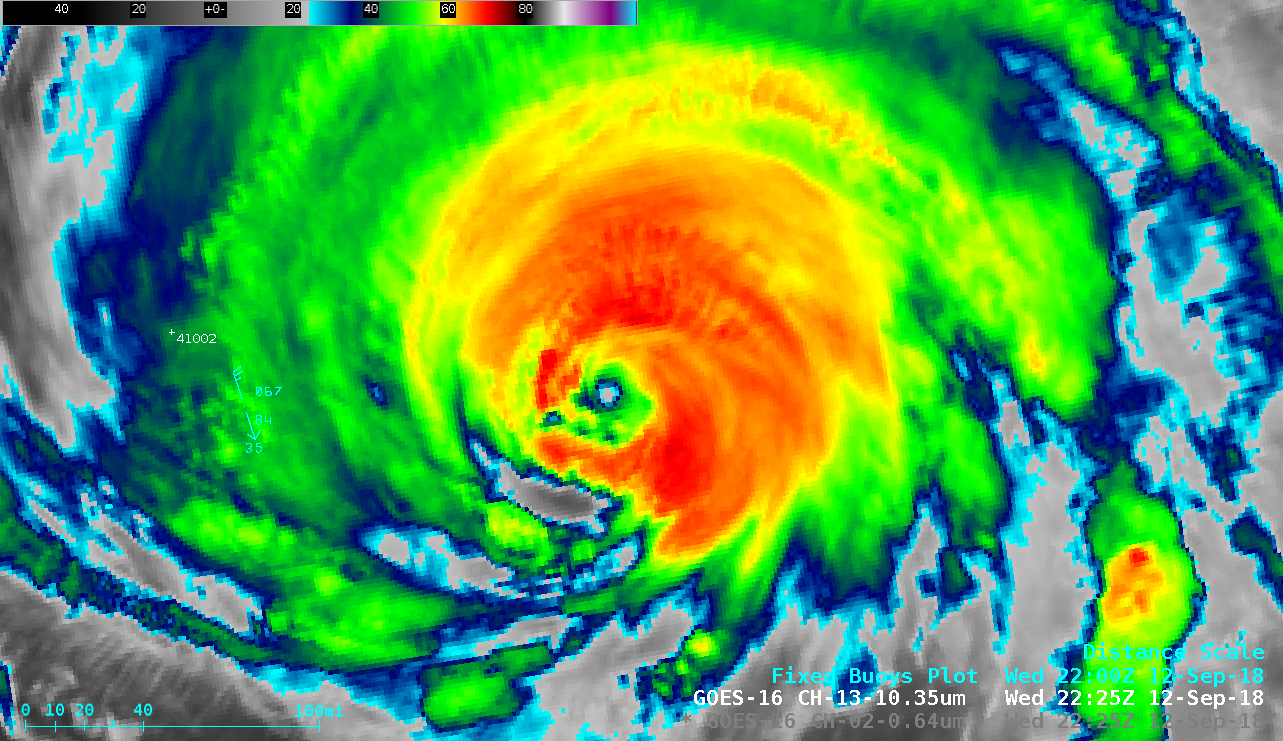
GOES-16 “Clean” Infrared Window {10.3 µm) images [click to play MP4 animation]
The
MIMIC Total Precipitable Water product
(below) indicated that high TPW values associated with Florence began to move inland along the US East Coast by the end of the day.
![MIMIC Total Precipitable Water product [click to enlarge]](https://cimss.ssec.wisc.edu/satellite-blog/wp-content/uploads/sites/5/2018/09/180912_mimic_tpw_Florence_anim.gif)
MIMIC Total Precipitable Water product [click to enlarge]
View only this post
Read Less
![Himawari-8 Infrared Window (10.4 µm) images [click to play MP4 animation]](https://cimss.ssec.wisc.edu/satellite-blog/wp-content/uploads/sites/5/2018/09/HIM08_IR_MANGKHUT_14SEP2018_960x1280_B13_2018257_170215_0001PANEL_00337.GIF)
![GOES-8 Visible (0.65 µm) images, with hourly surface wind barbs and gusts [click to play animation | MP4]](https://cimss.ssec.wisc.edu/satellite-blog/wp-content/uploads/sites/5/2018/09/960914_goes8_visible_Lake_Huron_anim.gif)
![NOAA-20 VIIRS Day/Night Band (0.7 µm) and Infrared Window (11.45 µm) images [click to enlarge]](https://cimss.ssec.wisc.edu/satellite-blog/wp-content/uploads/sites/5/2018/09/180913_0646utc_noaa20_DayNightBand_InfraredWindow_Florence_anim.gif)
![GCOM AMSR2 Microwave (89 GHz), Convective Rain Rate and Surface Rain Rate [click to enlarge]](https://cimss.ssec.wisc.edu/satellite-blog/wp-content/uploads/sites/5/2018/09/180913_0618utc_gcom_amsr2_microwave_rainrates_Florence_anim.gif)
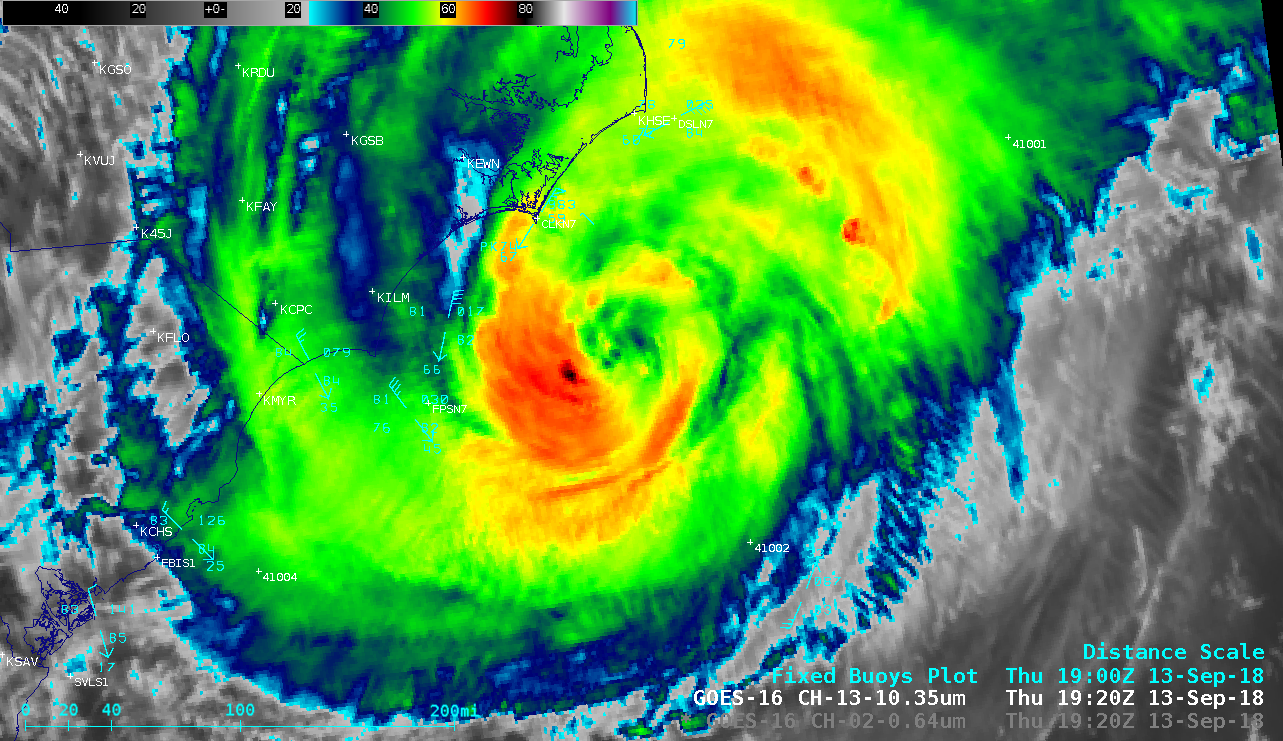
![DMSP-17 SSMIS Microwave (85 GHz) and GOES-16 Infrared Window (10.3 µm) images [click to enlarge]](https://cimss.ssec.wisc.edu/satellite-blog/wp-content/uploads/sites/5/2018/09/180913_1215utc_dmsp17_microwave_goes16_infrared_Florence_anim.gif)

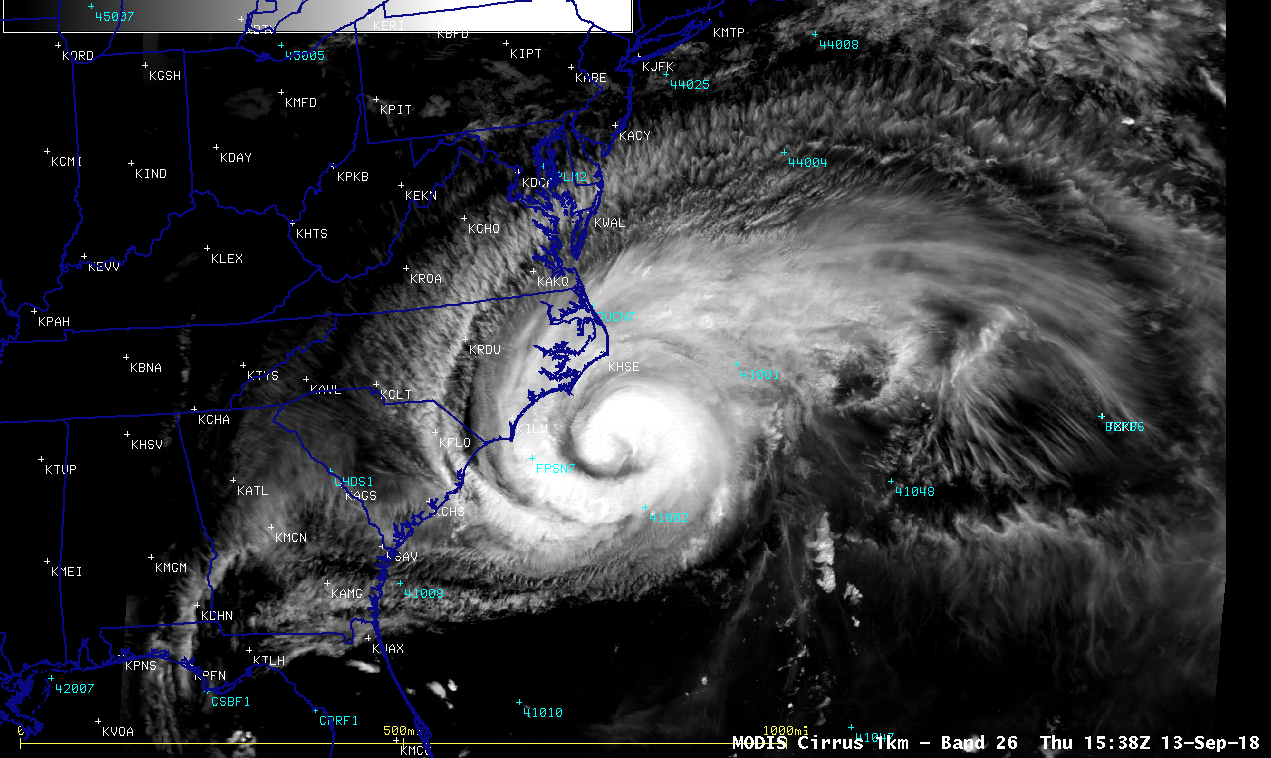
![Terra MODIS Visible (0.65 µm) and Infrared Window (11.0 µm) images at 1538 UTC [click to enlarge]](https://cimss.ssec.wisc.edu/satellite-blog/wp-content/uploads/sites/5/2018/09/180913_1538utc_terra_modis_visible_infrared_Florence_anim.gif)
![NOAA-20 VIIRS Visible (0.64 µm) and Infrared Window (11.45 µm) images at 1804 UTC [click to enlarge]](https://cimss.ssec.wisc.edu/satellite-blog/wp-content/uploads/sites/5/2018/09/180913_1804utc_noaa20_viirs_visible_infrared_Florence_anim.gif)
![Suomi NPP VIIRS Visible (0.64 µm) and Infrared Window (11.45 µm) images at 1854 UTC [click to enlarge]](https://cimss.ssec.wisc.edu/satellite-blog/wp-content/uploads/sites/5/2018/09/180913_1854utc_suomiNPP_viirs_visible_infrared_Florence_anim.gif)
![12 September Terra MODIS Sea Surface Temperature product and 13 September Terra MODIS Visible (0.65 µm) image [click to enlarge]](https://cimss.ssec.wisc.edu/satellite-blog/wp-content/uploads/sites/5/2018/09/180912_modis_sst_180913_modis_visible_Florence_anim.gif)

![GOES-16 Near-Infrared "Cirrus" (1.37 µm) images [click to play MP4 animation]](https://cimss.ssec.wisc.edu/satellite-blog/wp-content/uploads/sites/5/2018/09/G16_CIRRUS_FLORENCE_13SEP2018_960x1280_B4_2018256_180212_0001PANEL_00079.GIF)

