After Hurricane Florence made landfall in North Carolina during the morning hours on 14 September, it moved very slowly (at times only 2-3 mph) southwestward into South Carolina during 15-16 September (surface analyses). Prolonged heavy rainfall resulted (WPC summary), with new state records (see below) for precipitation from a tropical cyclone being set in... Read More
GOES-16 “Clean” Infrared Window (10.3 µm) images, with hourly precipitation type symbols plotted in yellow and SPC storm reports plotted in cyan, 13-17 September [click to play MP4 animation]
After
Hurricane Florence made landfall in North Carolina during the morning hours on
14 September, it moved very slowly (at times only 2-3 mph) southwestward into South Carolina during 15-16 September (
surface analyses). Prolonged heavy rainfall resulted (
WPC summary), with new state records
(see below) for precipitation from a tropical cyclone being set in North Carolina (35.93 inches) and South Carolina (23.63 inches). GOES-16
(GOES-East) “Clean” Infrared Window (
10.3 µm) images every 5 minutes during the 4-day period of 13-16 September
(above) showed the evolution of banding and the development of new convection that produced the heavy rainfall — widespread flooding along with strong winds caused power outages across portions of the 2 states (
NC |
SC), and closed sections of Interstates 95 and 40. Note that the power outages caused extended dropouts of the plotted surface reports — especially in eastern North Carolina; reports were missing when the gray 4-letter station identifiers disappeared — even though many of those sites were likely experiencing heavy rainfall during those dropout times.
Florence also spawned a few tornadoes on 14, 15 and 16 September — SPC storm reports are plotted in cyan on the GOES-16 Infrared images.
Hourly images of the MIMIC Total Precipitable Water product (below) showed tropical moisture associated with Florence as it moved inland during the 13-17 September period.
![MIMIC Total Precipitable Water product [click to play animation | MP4]](https://cimss.ssec.wisc.edu/satellite-blog/wp-content/uploads/sites/5/2018/09/comp20180914.120000_tpw.png)
MIMIC Total Precipitable Water product, 13-17 September [click to play animation | MP4]
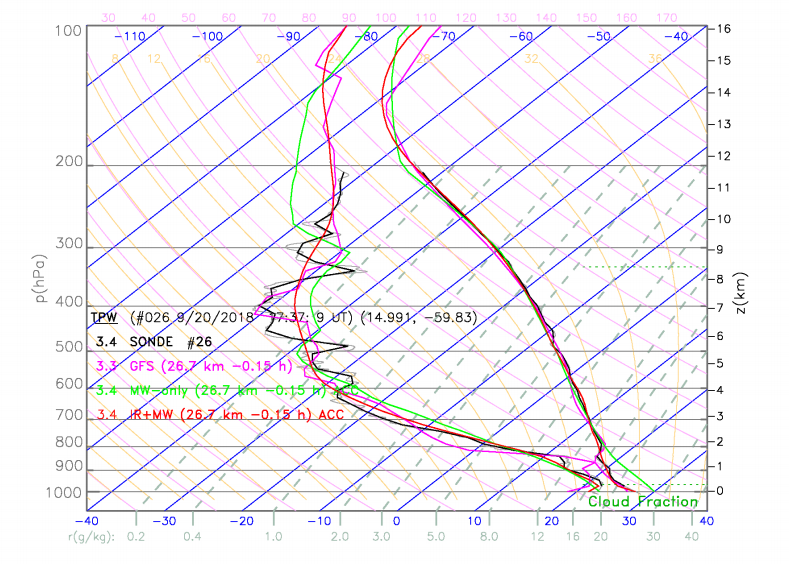
Animations of plots of rawinsonde data from the coastal sites of Newport/Morehead City, North Carolina and Charleston, South Carolina
(below) revealed the increase in deep tropical moisture from 13-16 September — Total Precipitable Water values were as high as 68.6 mm
(2.70 inches) at Newport and 67.8 mm
(2.67 inches) at Charleston.
![Daily plots of rawinsonde data from Newport/Morehead City, North Carolina [click to enlarge]](https://cimss.ssec.wisc.edu/satellite-blog/wp-content/uploads/sites/5/2018/09/180913_180917_kmhx_raobs_anim.gif)
Daily plots of rawinsonde data from Newport/Morehead City, North Carolina [click to enlarge]
![Daily plots of rawinsonde data from Charleston, South Carolina [click to enlarge]](https://cimss.ssec.wisc.edu/satellite-blog/wp-content/uploads/sites/5/2018/09/180913_180917_kchs_raobs_anim.gif)
Daily plots of rawinsonde data from Charleston, South Carolina [click to enlarge]
As the remnants of Florence moved from Kentucky to West Virginia during the daylight hours of 17 September, numerous tornadoes occurred in central Virginia (
SPC storm reports |
NWS Wakefield summary). 1-minute GOES-16 “Red” Visible (0.64 µm) and “Clean” Infrared Window (10.3 µm) images
(below) showed the development of thunderstorms which produced these tornadoes.
![GOES-16 "Red" Visible (0.64 µm, left) and "Clean" Infrared Window (10.3 µm, right) images, with plots of SPC storm reports [click to play MP4 animation]](https://cimss.ssec.wisc.edu/satellite-blog/wp-content/uploads/sites/5/2018/09/G16_VIS_IR_VA_SVR_17SEP2018_960x640_B213_2018260_195321_0002PANELS_00353.GIF)
GOES-16 “Red” Visible (0.64 µm, left) and “Clean” Infrared Window (10.3 µm, right) images, with plots of SPC storm reports [click to play MP4 animation]
===== 18 September Update =====
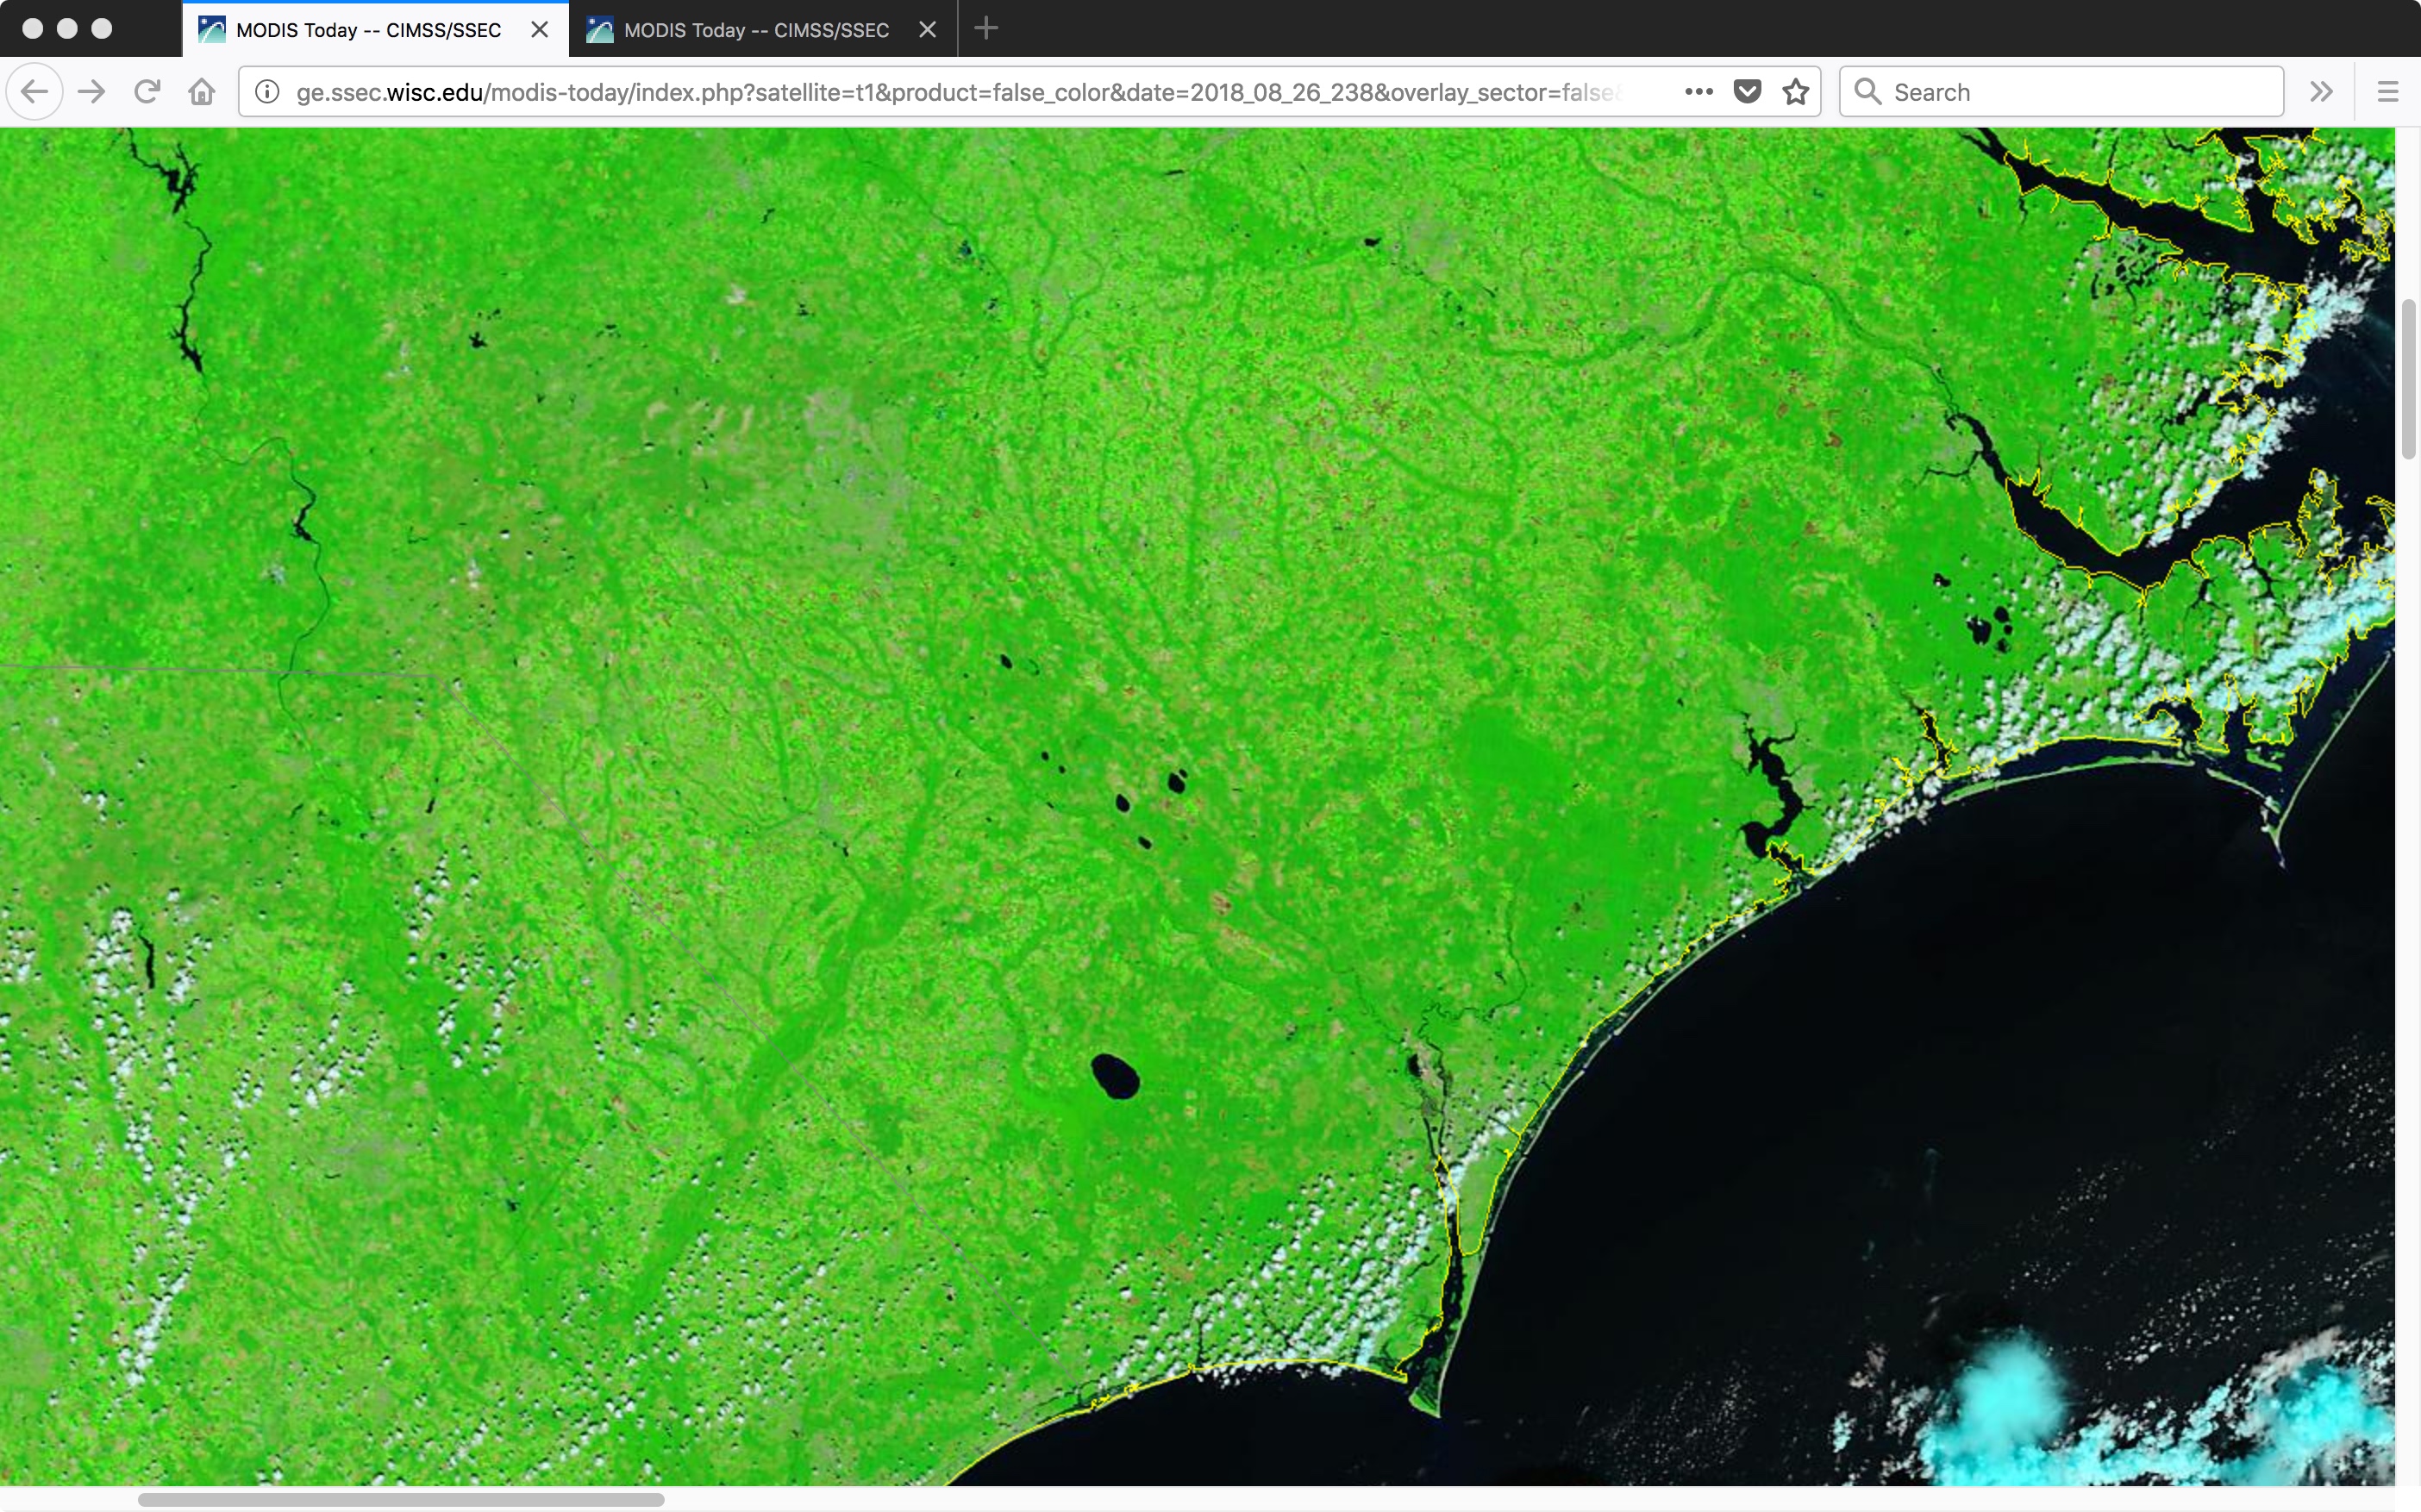
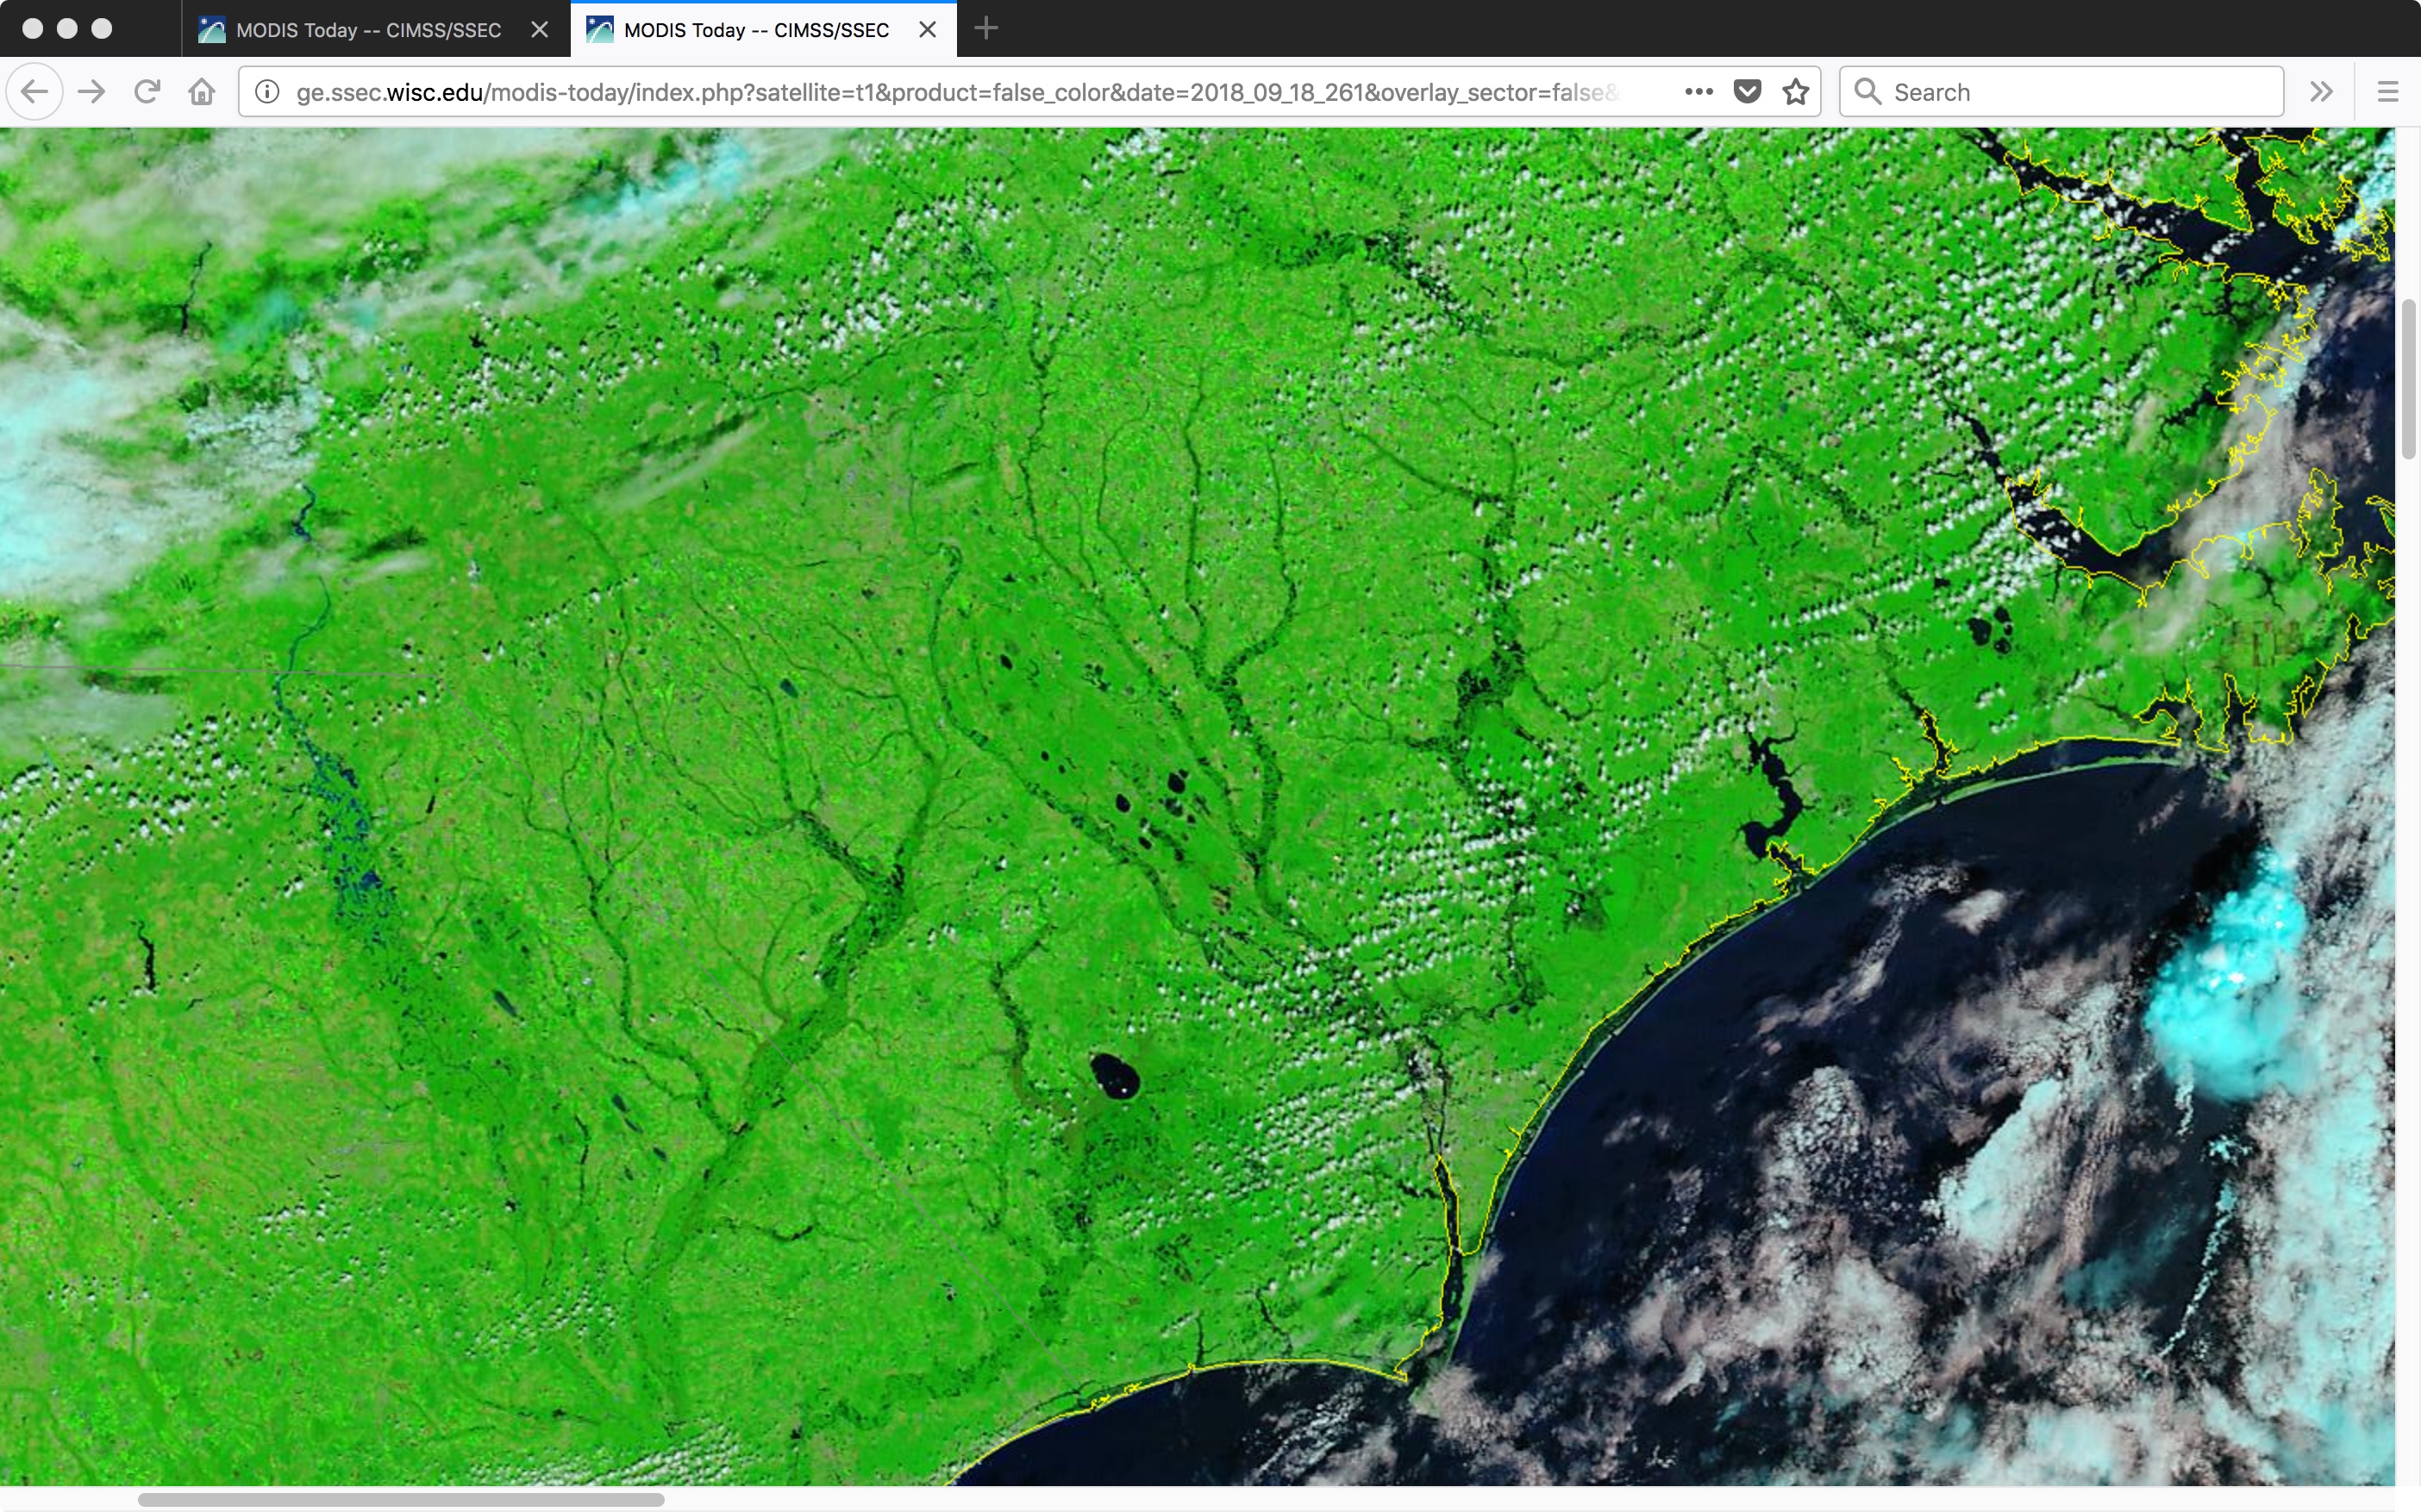
A comparison of before/after (26 August/18 September) Terra MODIS False Color Red-Green-Blue (RGB) images from the
MODIS Today site
(above) showed areas of inland flooding
(increasing water coverage appears as darker shades of blue) in the wake of Florence across far southeastern North Carolina and far northeastern South Carolina.
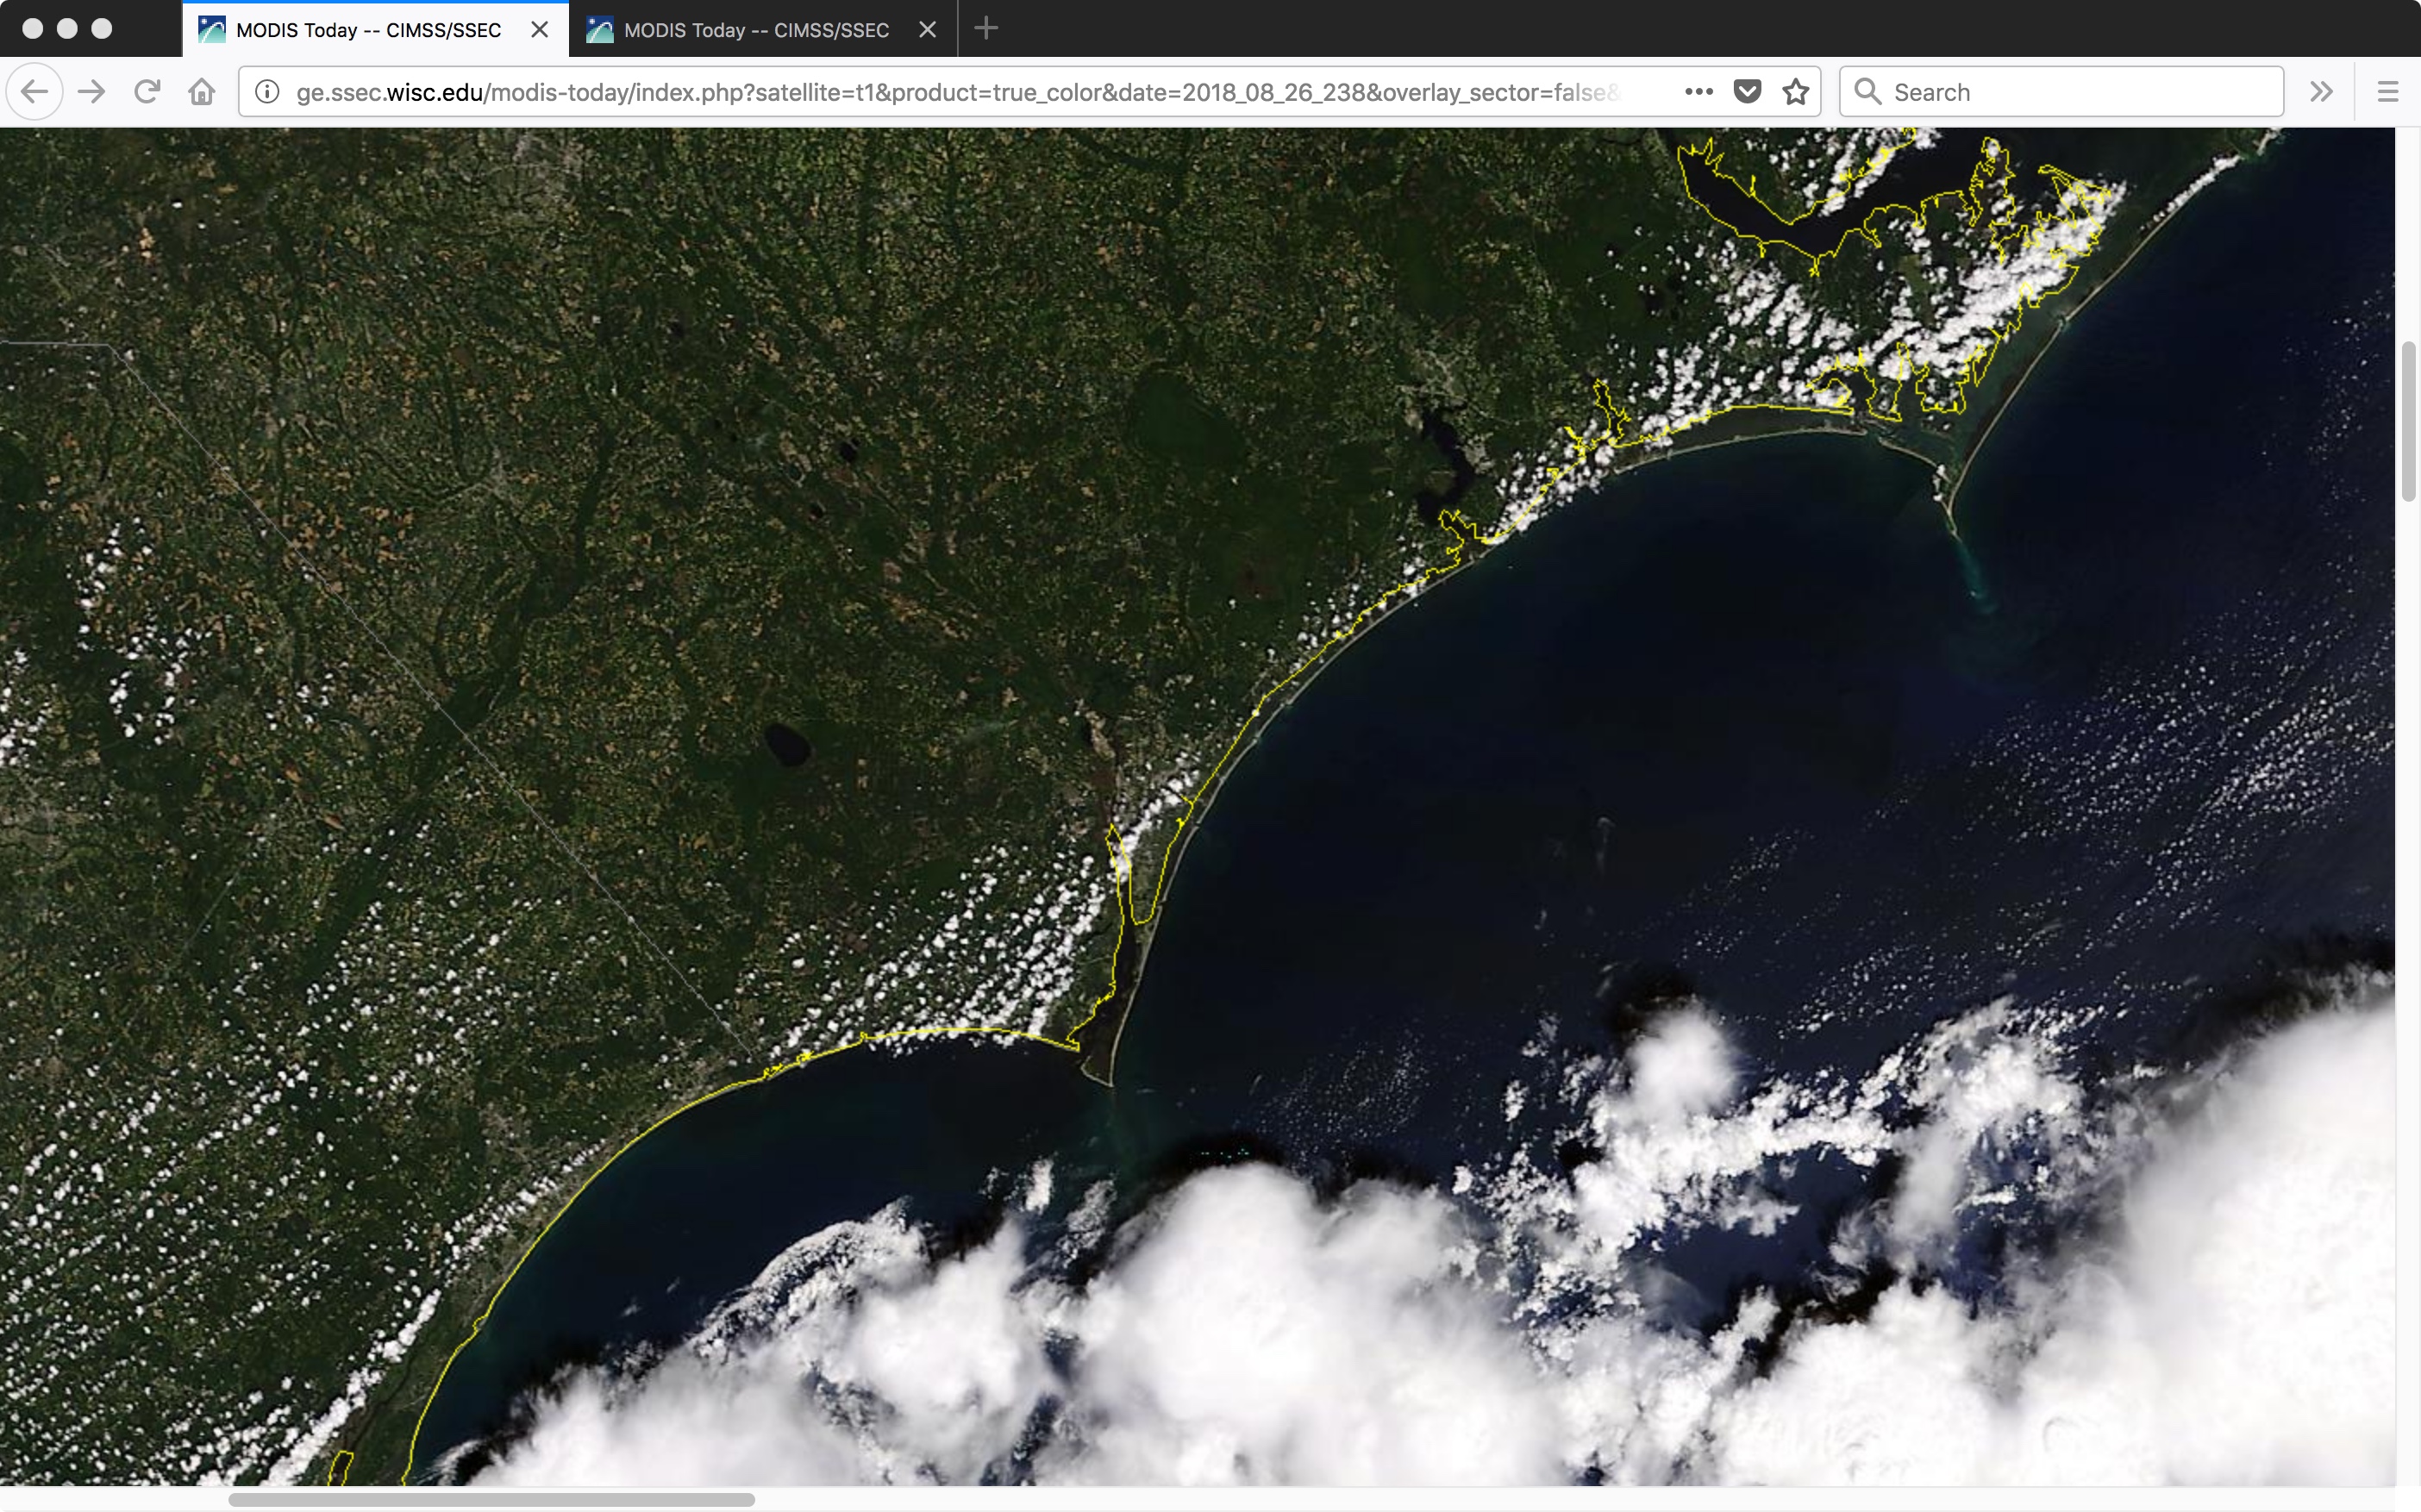
Looking slightly to the south, a similar before/after comparison of Terra MODIS True Color RGB images (below) revealed areas of sediment runoff into the Atlantic Ocean.
View only this post
Read Less
![Metop-A ASCAT surface scatterometer winds [click to enlarge]](https://cimss.ssec.wisc.edu/satellite-blog/wp-content/uploads/sites/5/2018/09/METOP_A_ASCAT_20180920_1335.png)
![GOES-16 Relative Vorticity product [click to play animation | MP4]](https://cimss.ssec.wisc.edu/satellite-blog/wp-content/uploads/sites/5/2018/09/180914_180920_850_vorticity_Florence_anim.gif)
![Sea Surface Temperature and Ocean Heat Content [click to enlarge]](https://cimss.ssec.wisc.edu/satellite-blog/wp-content/uploads/sites/5/2018/09/180920_sst_ohc_Invest98L_anim.gif)
![GOES-16 Mid-level Water Vapor (6.9 µm) images, with deep-layer wind shear analyzed at 22 UTC [click to enlarge]](https://cimss.ssec.wisc.edu/satellite-blog/wp-content/uploads/sites/5/2018/09/180920_goes16_water_vapor_shear_Invest98L_anim.gif)
![GOES-16 Low-level Water Vapor (7.3 µm) images + Total Precipitable Water derived product [click to play MP4 animation]](https://cimss.ssec.wisc.edu/satellite-blog/wp-content/uploads/sites/5/2018/09/flo_remnants_wv_tpw-20180920_180215.png)


![MIMIC Total Precipitable Water product [click to play animation | MP4]](https://cimss.ssec.wisc.edu/satellite-blog/wp-content/uploads/sites/5/2018/09/180913_180917_mimic_tpw_anim.gif)
![Before/after (26 August/18 September) Terra MODIS False Color RGB images [click to enlarge]](https://cimss.ssec.wisc.edu/satellite-blog/wp-content/uploads/sites/5/2018/09/180826_180918_terra_modis_falsecolor_NC_Florence_flooding_anim.gif)
![Terra MODIS True Color RGB images, 26 August vs. 18 September [click to enlarge]](https://cimss.ssec.wisc.edu/satellite-blog/wp-content/uploads/sites/5/2018/09/180826_180918_terra_modis_truecolor_NC_Florence_sediment_anim.gif)

![MIMIC Total Precipitable Water product [click to play animation | MP4]](https://cimss.ssec.wisc.edu/satellite-blog/wp-content/uploads/sites/5/2018/09/180913_180914_mimic_tpw_anim.gif)
![Terra MODIS Visible (0.65 µm) and Infrared Window (11.0 µm) images [click to enlarge]](https://cimss.ssec.wisc.edu/satellite-blog/wp-content/uploads/sites/5/2018/09/180914_1620utc_terra_modis_visible_infrared_Florence_anim.gif)
![Aqua MODIS Visible (0.65 µm) and Infrared Window (11.0 µm) images [click to enlarge]](https://cimss.ssec.wisc.edu/satellite-blog/wp-content/uploads/sites/5/2018/09/180914_1801utc_aqua_modis_visible_infrared_Florence_anim.gif)
![Suomi NPP VIIRS Visible (0.64 µm) and Infrared Window (11.45 µm) images at 1835 UTC [click to enlarge]](https://cimss.ssec.wisc.edu/satellite-blog/wp-content/uploads/sites/5/2018/09/180914_1835utc_suomi_npp_viirs_visible_infrared_Florence_anim.gif)
![Ocean Heat Content data from 14 September [click to enlarge]](https://cimss.ssec.wisc.edu/satellite-blog/wp-content/uploads/sites/5/2018/09/180914_ocean_heat_content_Florence_anim.gif)
