
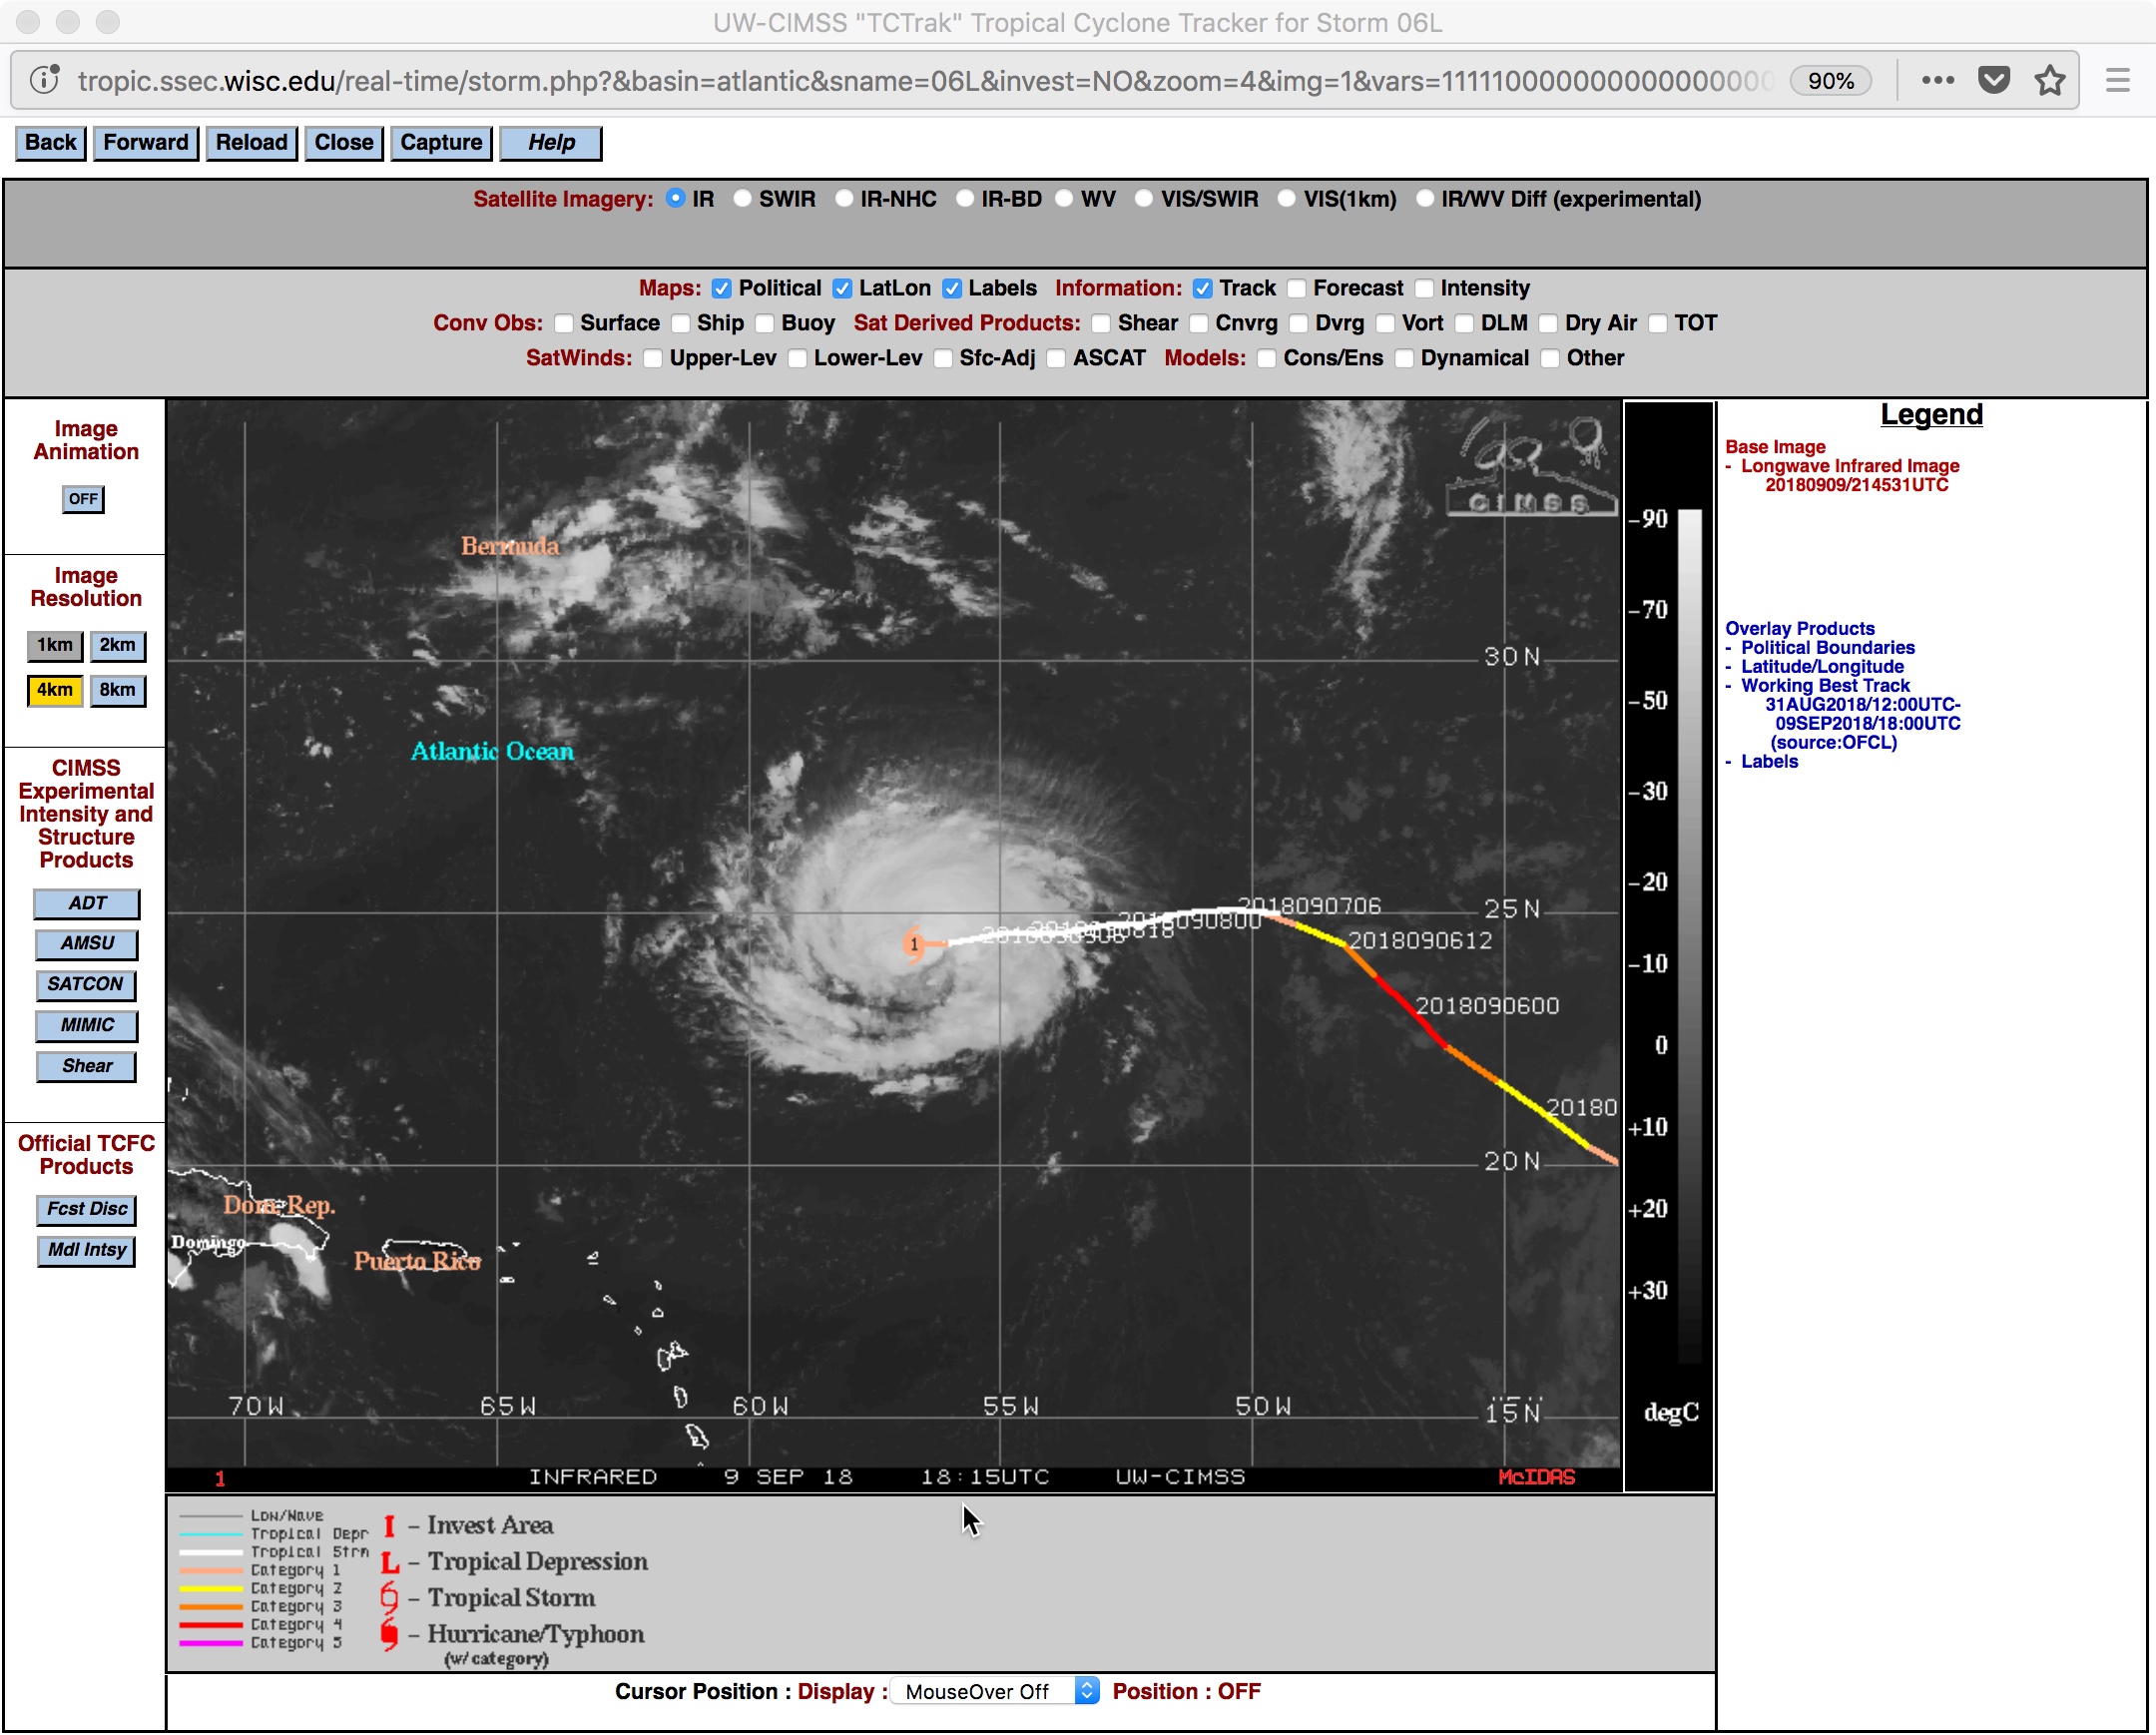
After previously weakening from a Category 4 hurricane (on 04 September) to a tropical storm on 07 September (track/intensity), Florence re-intensified to become a Category 1 hurricane at 15 UTC on 09 September 2018. 1-minute Mesoscale Domain Sector GOES-16 (GOES-East) “Red” Visible (0.63 µm) are shown above, with the corresponding “Clean” Infrared Window... Read More
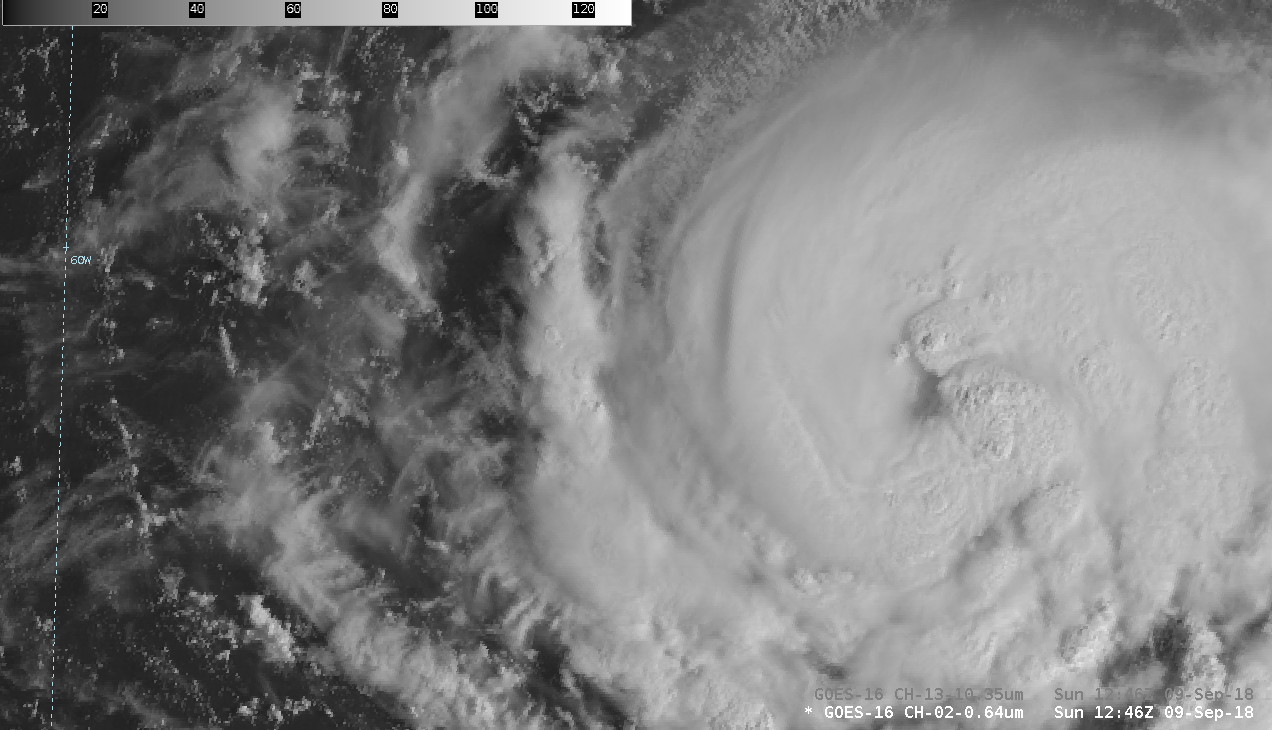
GOES-16 “Red” Visible (0.64 µm) iimages [click to play MP4 animation]
After previously weakening from a Category 4 hurricane (on 04 September) to a tropical storm on 07 September (
track/intensity),
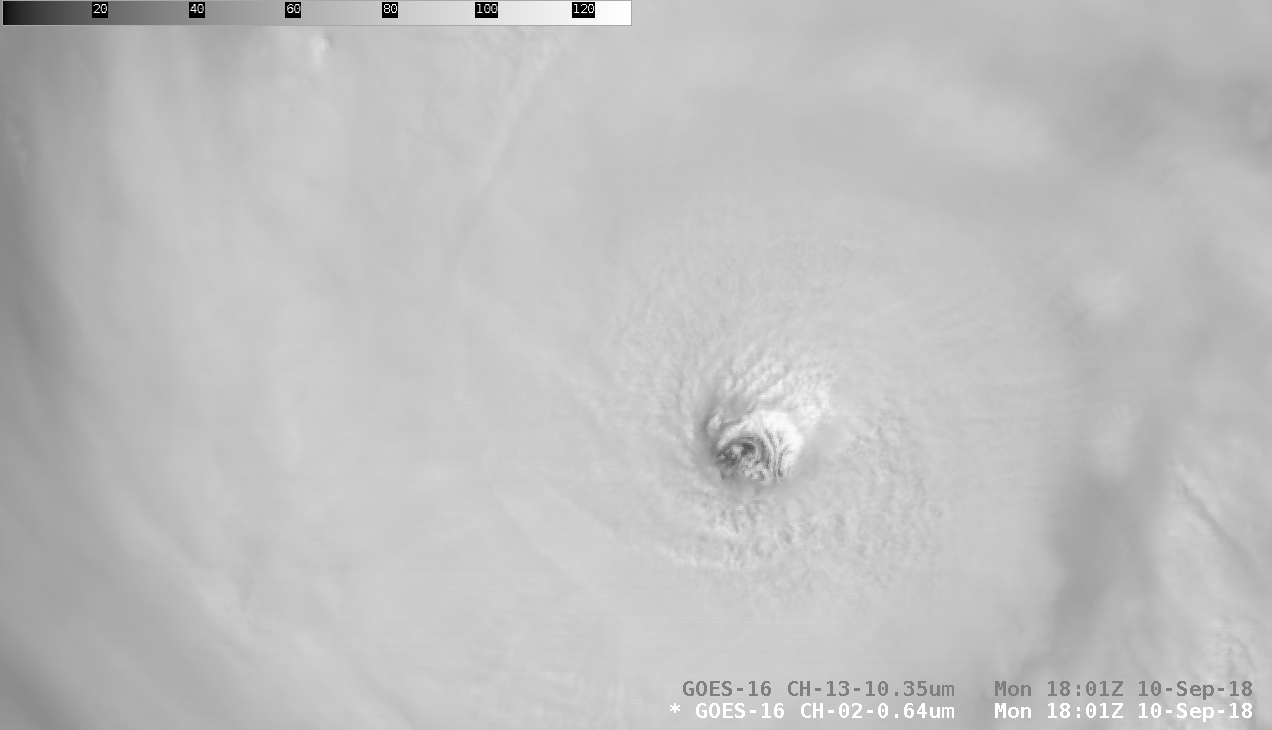
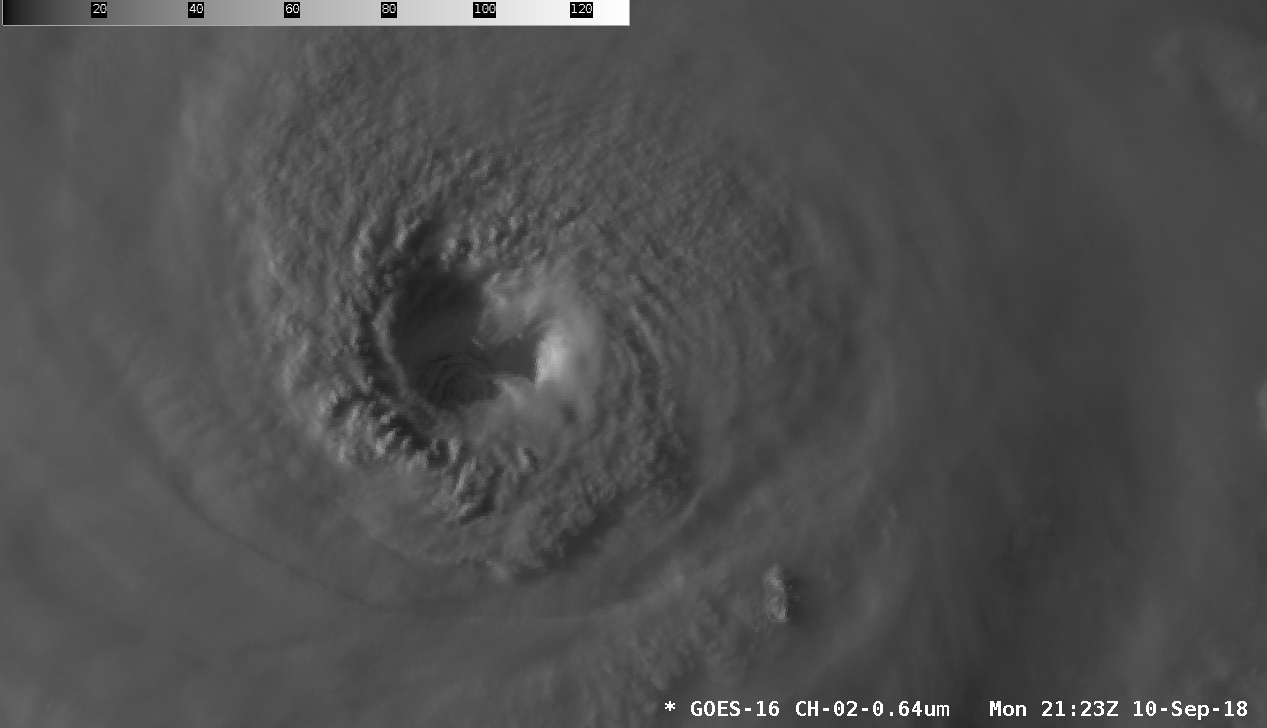
Florence re-intensified to become a Category 1 hurricane at 15 UTC on 09 September 2018. 1-minute
Mesoscale Domain Sector GOES-16
(GOES-East) “Red” Visible (
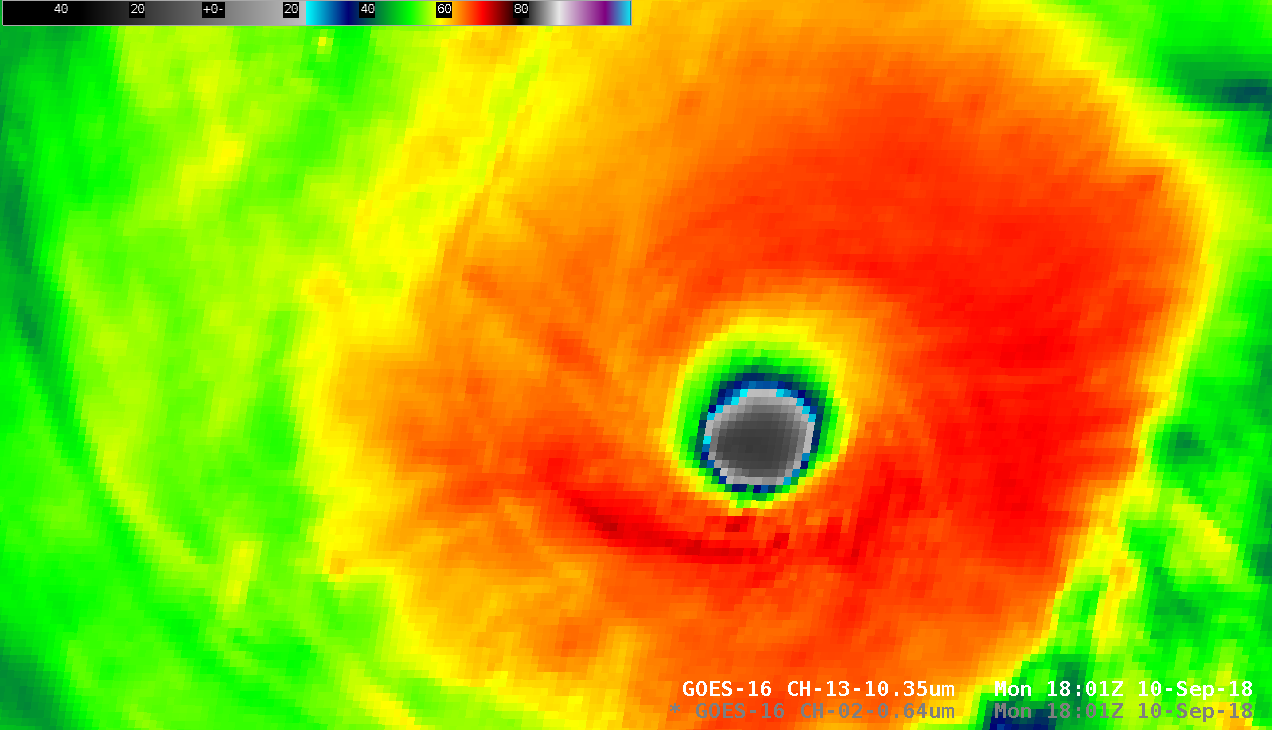
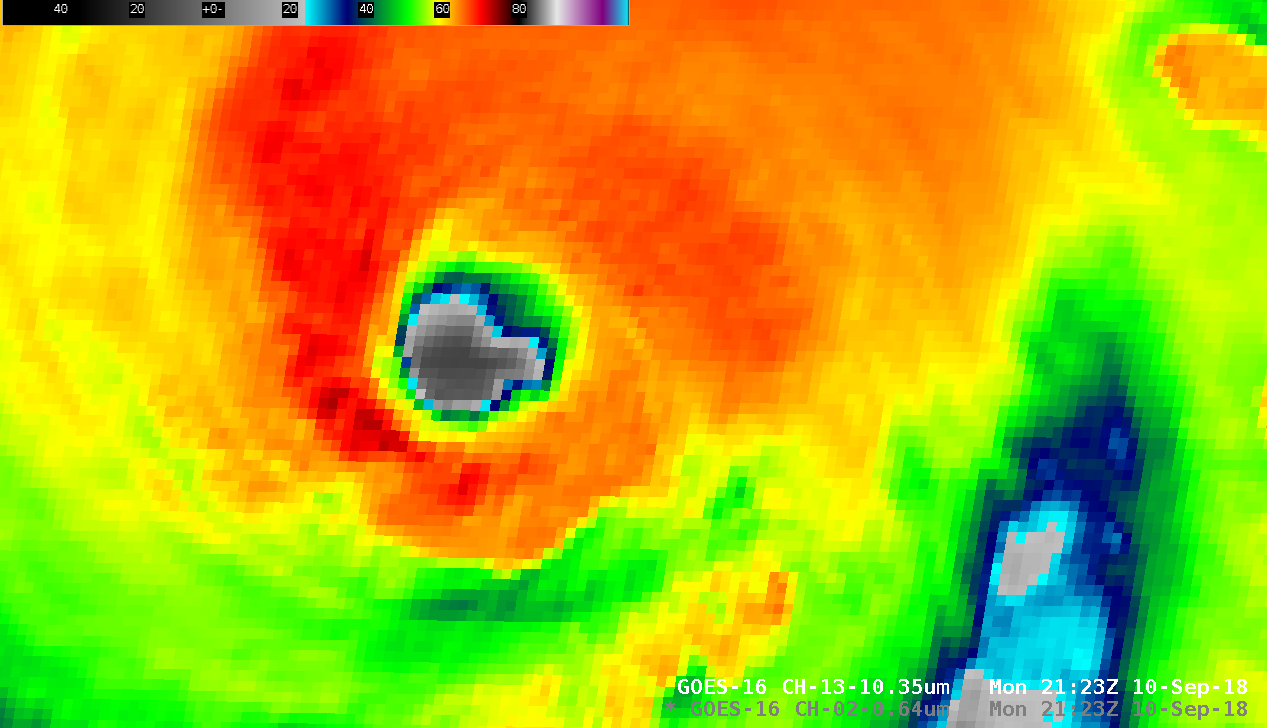
0.63 µm) are shown above, with the corresponding “Clean” Infrared Window (
10.3 µm) images shown below. An eye structure appeared for brief intervals during the day, but was often masked by cloud debris from a series of convective bursts within the surrounding eyewall.
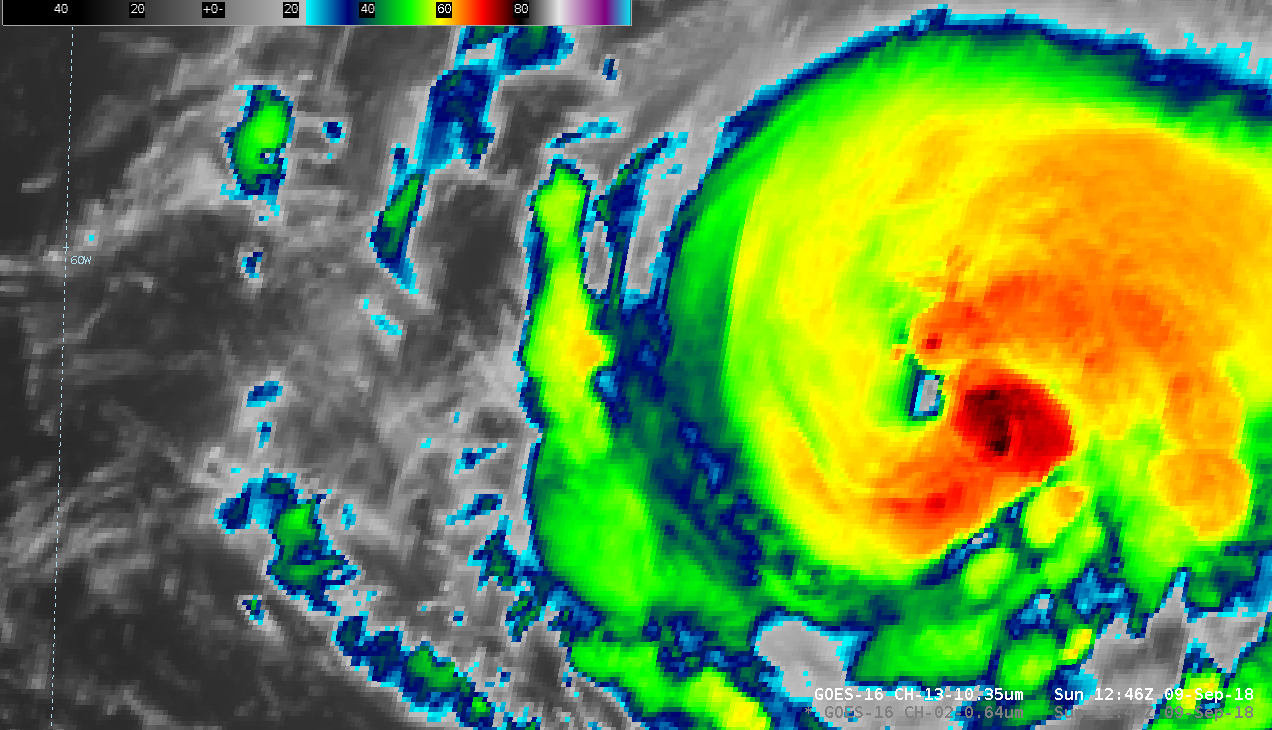
GOES-16 “Clean” Infrared Window (10.3 µm) images [click to play MP4 animation]
![GPM GMI Microwave (85 GHz) image at 1811 UTC [click to enlarge]](https://cimss.ssec.wisc.edu/satellite-blog/wp-content/uploads/sites/5/2018/09/180909_1811utc_gpm_gmi_microwave_Florence.jpeg)
GPM GMI Microwave (85 GHz) image at 1811 UTC [click to enlarge]
GPM GMI
(above) and DMSP-16 SSMIS
(below) Microwave (85 GHz) images from the
CIMSS Tropical Cyclones site revealed that the eye was still partially open at 1811 UTC and 1945 UTC.
![DMSP-16 SSMIS Microwave (85 GHz) image at 1845 UTC [click to enlarge]](https://cimss.ssec.wisc.edu/satellite-blog/wp-content/uploads/sites/5/2018/09/180909_1945utc_dmsp16_ssmis_mw_Florence.jpeg)
DMSP-16 SSMIS Microwave (85 GHz) image at 1845 UTC [click to enlarge]
===== 10 September Update =====
GOES-16 “Red” Visible (0.64 µm) images, with GLM Group lightning [click to enlarge]
GOES-16 GLM lightning Groups
(aggregates of GLM lightning Events) are plotted on “Red” Visible (0.64 µm) images
(above) and “Clean” Infrared Window (10.3 µm) images
(below), courtesy of Dave Santek, SSEC.
GOES-16 “Clean” Infrared Window (10.3 µm) images, with GLM Group lightning [click to enlarge]
Overlapping GOES-16 and GOES-17
Mesoscale Domain Sectors were positioned over Hurricane Florence beginning at 1200 UTC
(providing imagery at 30-second intervals) — Visible animations are shown below.
* GOES-17 images shown here are preliminary and non-operational *
GOES-16 “Red” Visible (0.64 µm) images [click to play MP4 animation]
GOES-17 “Red” Visible (0.64 µm) images [click to play MP4 animation]
Longer animations of 30-second GOES-16 Visible and Infrared images viewed using AWIPS
(below) provided a better view of the mesovortices within the eye. Florence rapidly intensified (
ADT |
SATCON) to a Category 4 hurricane during this period.
GOES-16 “Red” Visible (0.64 µm) images [click to play MP4 animation]
GOES-16 “Clean” Infrared Window (10.3 µm) images [click to play MP4 animation]
One particularly large mesovortex rotated around the eastern edge of the eye after 2100 UTC, significantly eroding the eyewall
(below).
GOES-16 “Red” Visible (0.64 µm) images [click to play MP4 animation]
GOES-16 “Clean” Infrared Window (10.3 µm) images [click to play MP4 animation]
Later in the early evening hours, GOES-16 Infrared imagery
(below) showed an area of pronounced cloud-top warming and a thinning of cloud material just south of the eyewall, as Florence began to undergo an eyewall replacement cycle.
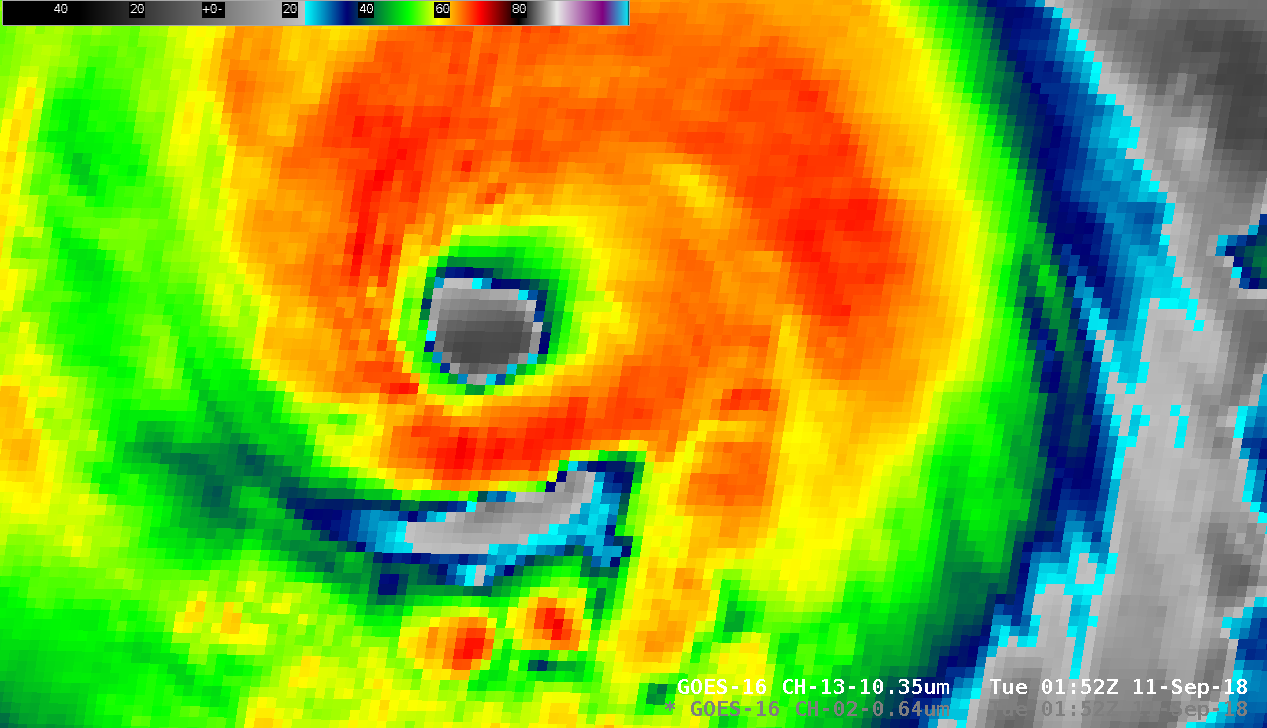
GOES-16 “Clean” Infrared Window (10.3 µm) images [click to play MP4 animation]
View only this post
Read Less
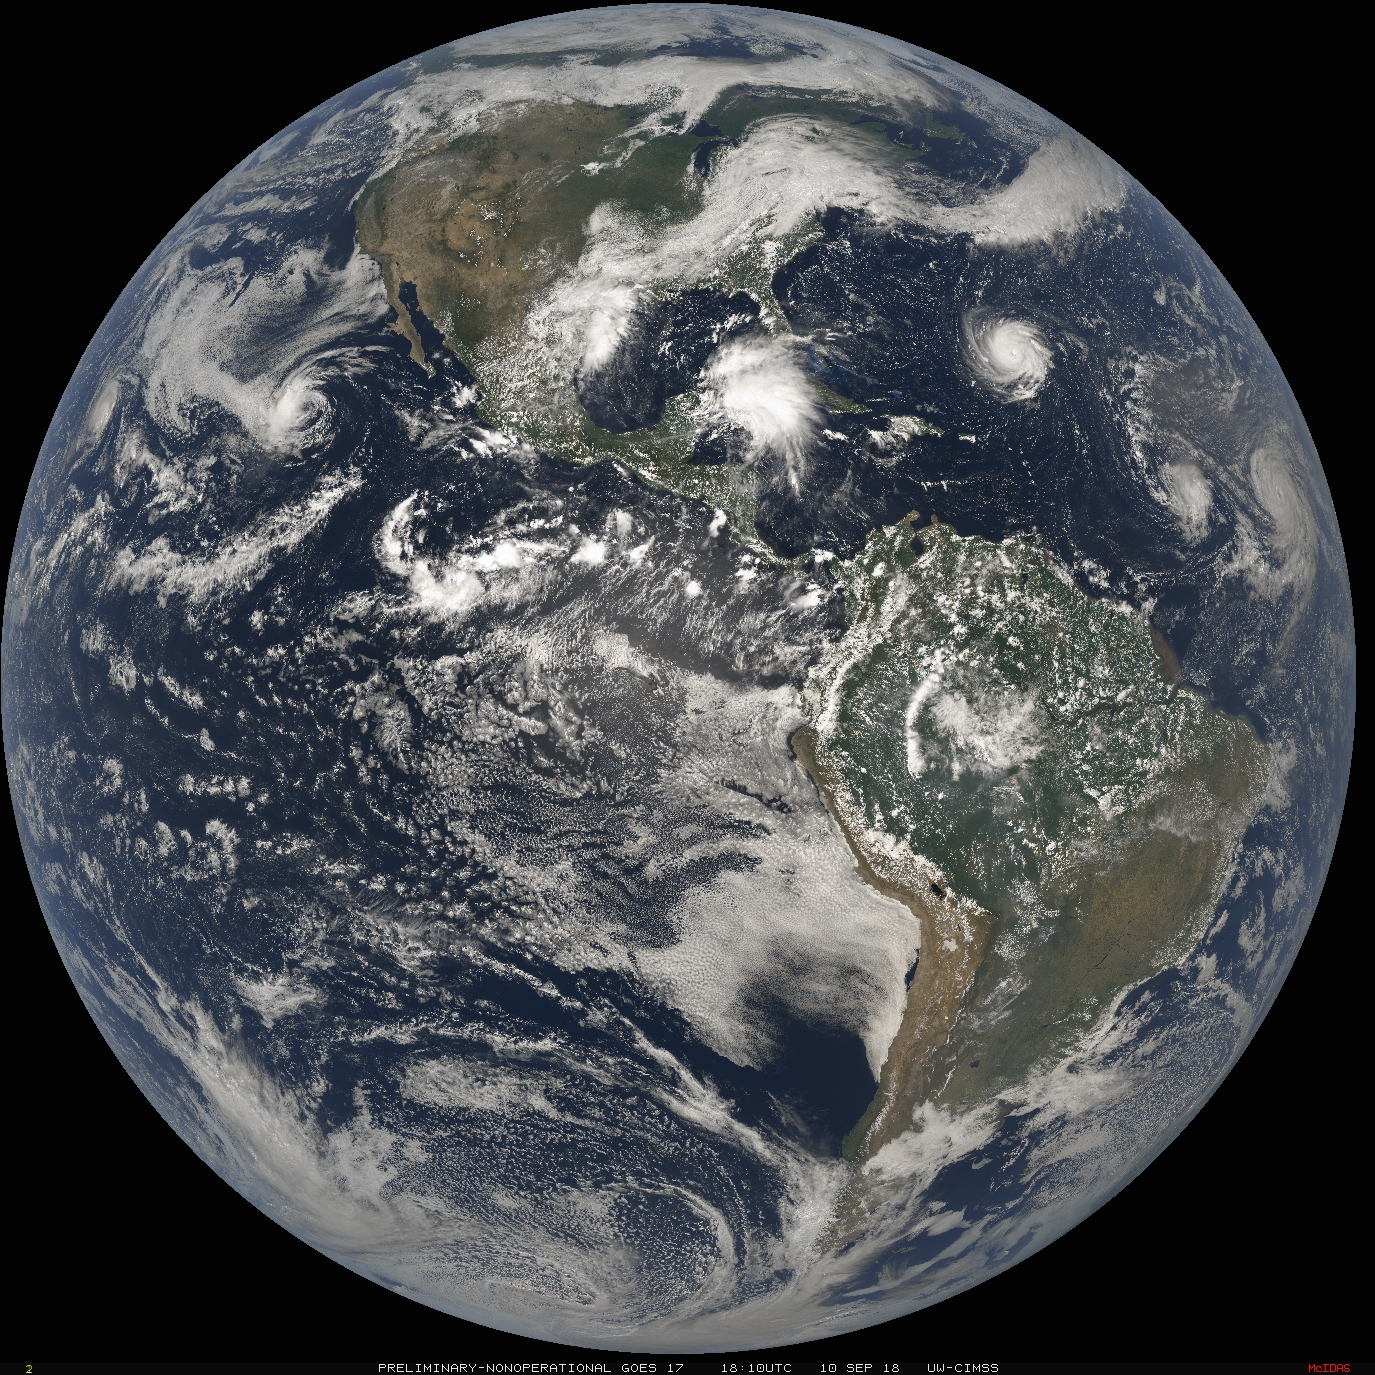
![GOES-17 Full Disk true color images [click to play animation]](https://cimss.ssec.wisc.edu/satellite-blog/wp-content/uploads/sites/5/2018/09/180910_1810utc_goes17_full_disk_natural_color.jpg)

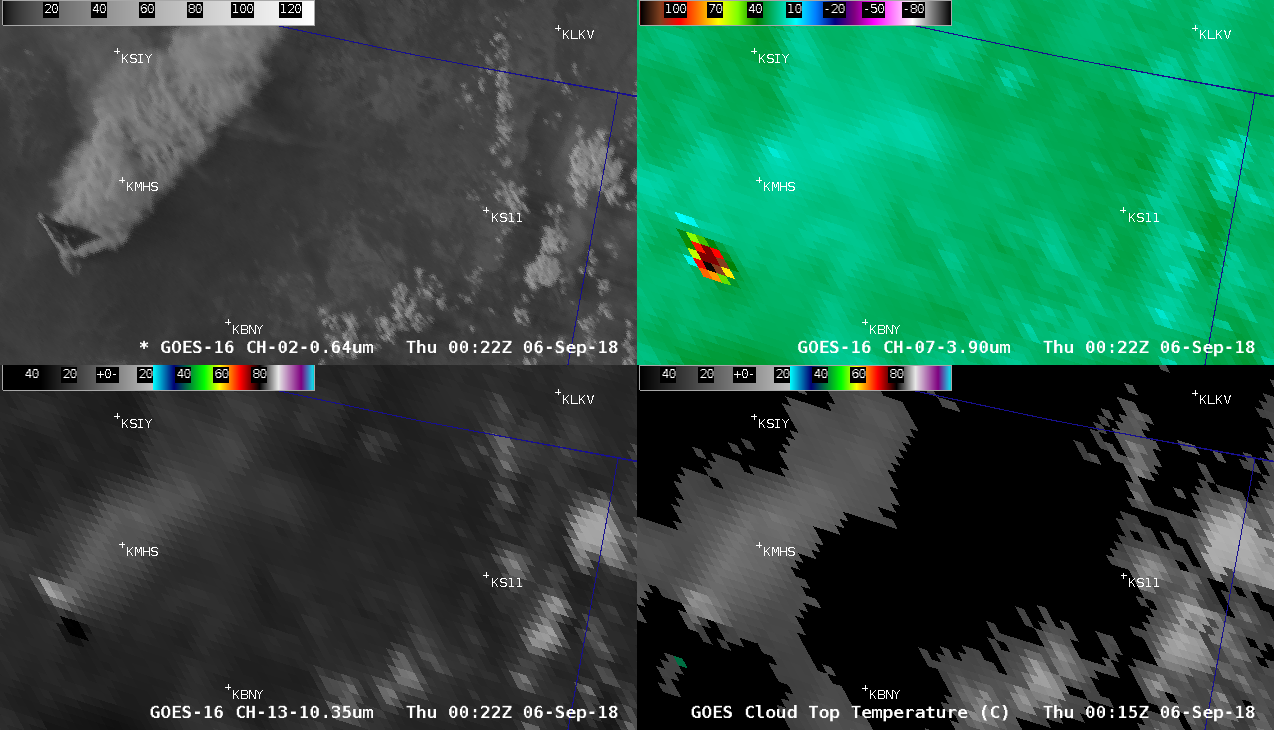
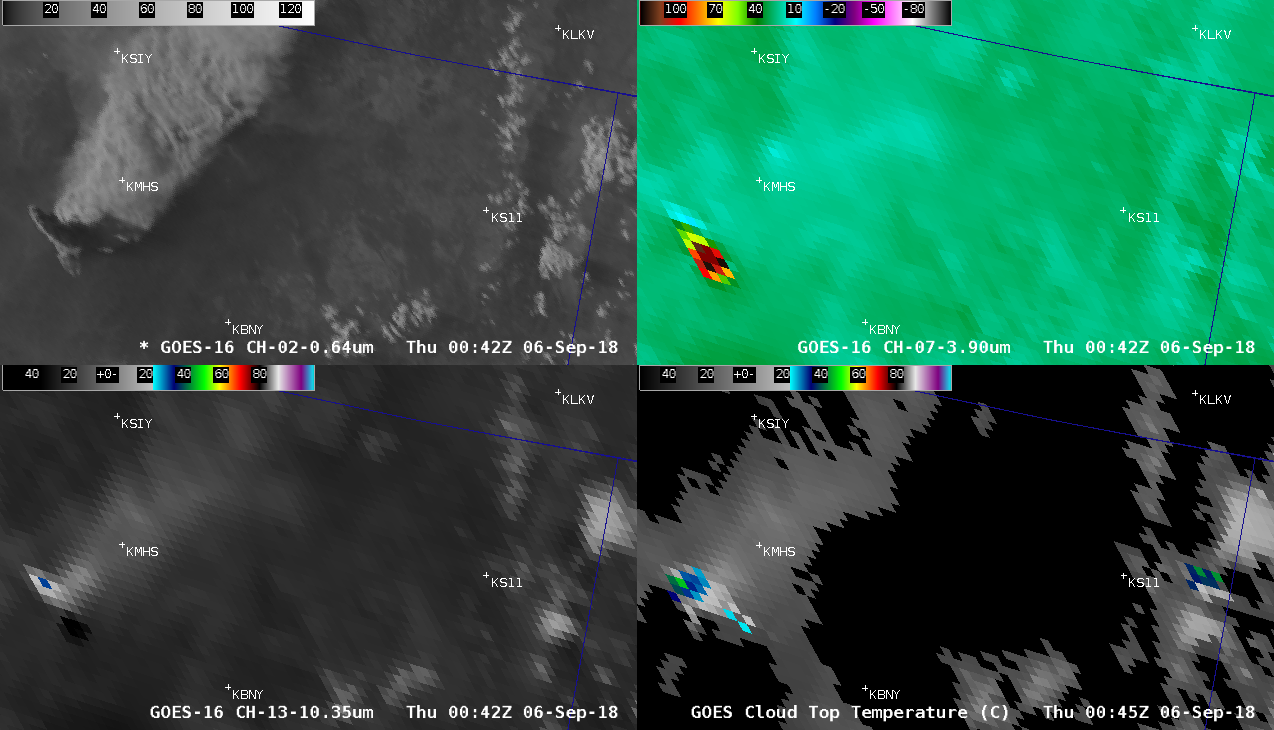
![GOES-16 "Red" Visible (0.64 µm, top), Shortwave Infrared (3.9 µm, middle), "Clean" Infrared Window (10.3 µm, bottom); Interstate 5 is plotted in cyan [click to play animation | MP4]](https://cimss.ssec.wisc.edu/satellite-blog/wp-content/uploads/sites/5/2018/09/180905_goes16_visible_shortwaveInfrared_infraredWindow_Delta_Fire_CA_pyroCb_anim.gif)
![GOES-17 "Red" Visible (0.64 µm, top), Shortwave Infrared (3.9 µm, middle), "Clean" Infrared Window (10.3 µm, bottom) images; Interstate 5 is plotted in cyan [click to play animation | MP4]](https://cimss.ssec.wisc.edu/satellite-blog/wp-content/uploads/sites/5/2018/09/180905_goes17_visible_shortwaveInfrared_infraredWindow_Delta_Fire_CA_pyroCb_anim.gif)
