![Suomi NPP VIIRS Visible (0.64 µm) and Infrared Window (11.45 µm) images [click to enlarge]](https://cimss.ssec.wisc.edu/satellite-blog/wp-content/uploads/sites/5/2018/09/180924_2215utc_suomiNPP_viirs_visible_infrared_PANC_TS_anim.gif)
Suomi NPP VIIRS Visible (0.64 µm) and Infrared Window (11.45 µm) images [click to enlarge]
View of thunderstorm moving into Anchorage on Sept 24, 2018. (Photo credit: Charley Palmer) @NWSAnchorage @DaveSnider @AlaskaWx pic.twitter.com/iM11OtRvGk
— Brian Brettschneider (@Climatologist49) September 25, 2018
In far northeastern Alaska, snow cover across the North Slope and Brooks Range was evident in a sequence of Suomi NPP VIIRS Visible (0.64 µm) images (below). Since there were also areas of low cloud present (both north and south of the primary snow cover), the VIIRS Shortwave Infrared (3.74 µm) images could be used to discriminate between these low clouds — whose supercooled water droplets were effective reflectors of solar radiation, making then appear warmer or darker gray — and the cloud-free areas of snow cover.
![Sequence of 4 Suomi NPP VIIRS Visible (0.64 µm) and Shortwave Infrared (3.74 µm) images [click to enlarge]](https://cimss.ssec.wisc.edu/satellite-blog/wp-content/uploads/sites/5/2018/09/180924_suomiNPP_viirs_visible_shortwaveInfrared_Alaska_anim.gif)
Sequence of 4 Suomi NPP VIIRS Visible (0.64 µm) and Shortwave Infrared (3.74 µm) images [click to enlarge]
The temp has dropped to 3 degrees above zero F at Toolik Field station as of 6AM.
— NWS Fairbanks (@NWSFairbanks) September 25, 2018
Finally, along the Alaska Peninsula, Suomi NPP VIIRS Day/Night Band (0.7 µm) and Shortwave Infrared (3.74 µm) images revealed the bright glow and hot thermal signature of the ongoing eruption of Mount Veniaminof at 1204 UTC and 1344 UTC (below).
![Suomi NPP VIIRS Day/Night Band (0.7 µm) and Shortwave Infrared (3.74 µm) images at 1204 UTC [click to enlarge]](https://cimss.ssec.wisc.edu/satellite-blog/wp-content/uploads/sites/5/2018/09/180925_1204utc_suomiNPP_viirs_DayNightBand_shortwaveInfrared_Veniaminof_AK_anim.gif)
Suomi NPP VIIRS Day/Night Band (0.7 µm) and Shortwave Infrared (3.74 µm) images at 1204 UTC [click to enlarge]
![Suomi NPP VIIRS Day/Night Band (0.7 µm) and Shortwave Infrared (3.74 µm) images at 1344 UTC [click to enlarge]](https://cimss.ssec.wisc.edu/satellite-blog/wp-content/uploads/sites/5/2018/09/180925_1344utc_suomiNPP_viirs_DayNightBand_shortwaveInfrared_Veniaminof_AK_anim.gif)
Suomi NPP VIIRS Day/Night Band (0.7 µm) and Shortwave Infrared (3.74 µm) images at 1344 UTC [click to enlarge]
![GOES-17 Shortwave Infrared (3.74 µm) images [click to play animation | MP4]](https://cimss.ssec.wisc.edu/satellite-blog/wp-content/uploads/sites/5/2018/09/180925_goes17_shortwave_infrared_Mount_Veniaminof_AK_anim.gif)
GOES-17 Shortwave Infrared (3.74 µm) images [click to play animation | MP4]
GOES-17 “Red” Visible (0.64 µm) images [click to play animation | MP4]
* GOES-17 images shown here are preliminary and non-operational *
View only this post Read Less
![Himawari-8 Infrared Window (10.4 µm) images [click to play animation | MP4]](https://cimss.ssec.wisc.edu/satellite-blog/wp-content/uploads/sites/5/2018/09/180923_180924_himawari8_infrared_Super_Typhoon_Trami_anim.gif)
![Himawari-8 Infrared Window (10.4 µm) images, with deep-layer wind shear analysis at 00 UTC [click to enlarge]](https://cimss.ssec.wisc.edu/satellite-blog/wp-content/uploads/sites/5/2018/09/180924_himawari8_infrared_00utc_shear_Trami_anim.gif)
![NOAA-20 VIIRS Day/Night Band (0.7 µm) and Infrared Window (11.45 µm) images [click to enlarge]](https://cimss.ssec.wisc.edu/satellite-blog/wp-content/uploads/sites/5/2018/09/180925_1634utc_noaa20_DayNightBand_InfraredWindow_Trami_anim.gif)
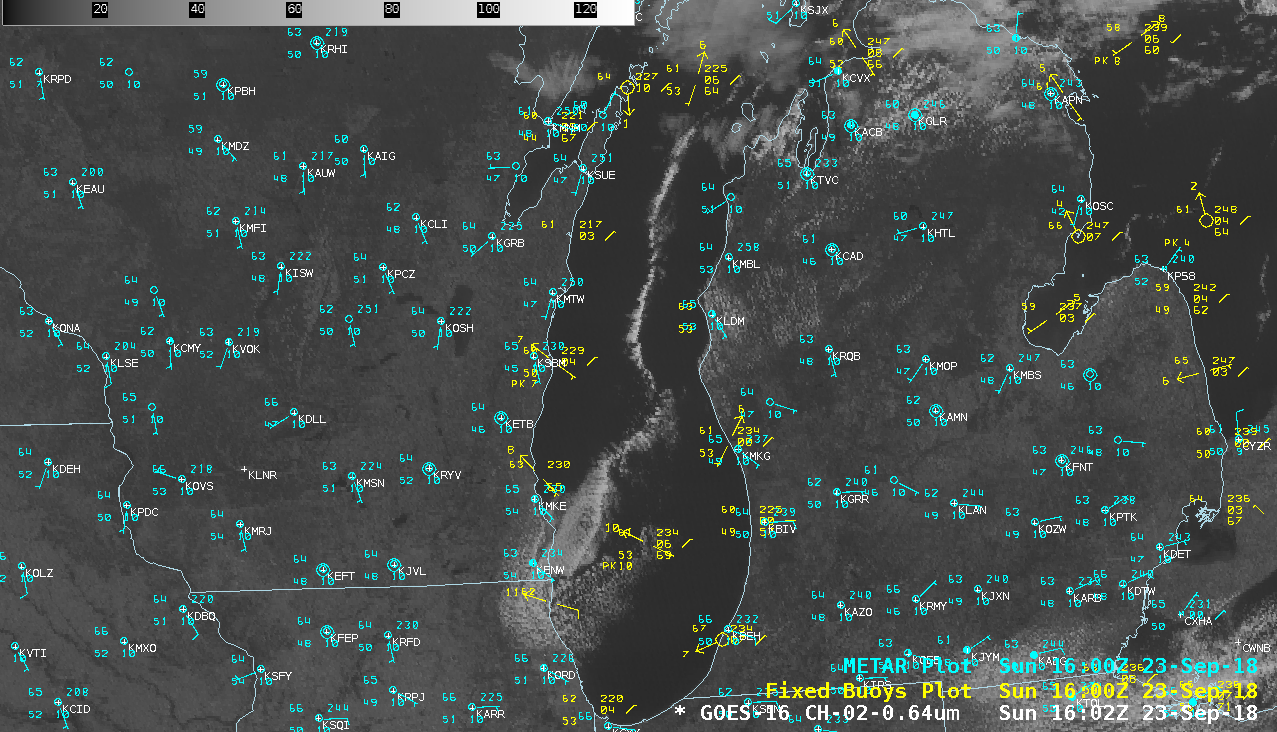

![VIIRS Day/Night Band (0.7 µm) images from Suomi NPP at 0743 UTC and NOAA-20 at 0832 UTC [click to enlarge]](https://cimss.ssec.wisc.edu/satellite-blog/wp-content/uploads/sites/5/2018/09/180923_suomiNPP_noaa20_viirs_DayNightBand_Lake_Michigan_anim.gif)
![Terra/Aqua MODIS Sea Surface Temperature product [click to enlarge]](https://cimss.ssec.wisc.edu/satellite-blog/wp-content/uploads/sites/5/2018/09/180923_modis_SeaSurfaceTemperature_Lake_Michigan_anim.gif)
![Terra/Aqua MODIS Sea Surface Temperature product, with RTMA surface winds [click to enlarge]](https://cimss.ssec.wisc.edu/satellite-blog/wp-content/uploads/sites/5/2018/09/180923_modis_SeaSurfaceTemperature_rtma_surface_winds_Lake_Michigan_anim.gif)
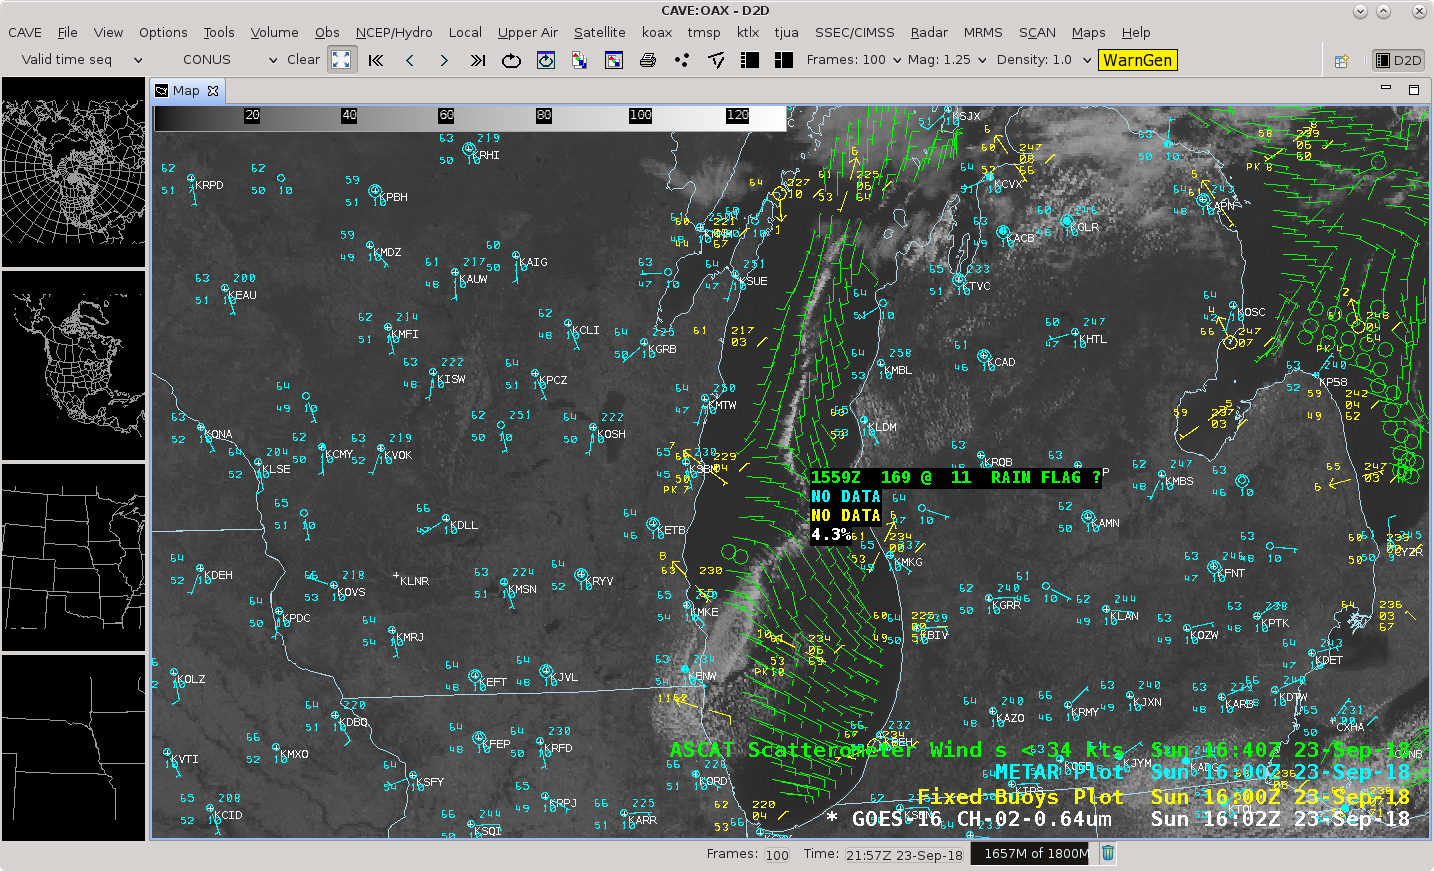
![Terra MODIS Sea Surface Temperature product, with RTMA surface winds and Metop ASCAT winds [click to enlarge]](https://cimss.ssec.wisc.edu/satellite-blog/wp-content/uploads/sites/5/2018/09/180923_terra_modis_sst_rtma_ascat_winds_anim.gif)

