The Garden Route Fires had been burning since about 24 October 2018 near George along the southern coast of South Africa (media story). On 29 October, EUMETSAT Meteosat-11 High Resolution Visible (0.8 µm), Shortwave Infrared (3.92 µm) and Longwave Infrared Window (10.8 µm) images (above) showed an elongated west-to-east oriented thermal... Read More
![Meteosat-11 Visible (0.8 µm), Shortwave Infrared (3.92 µm) and Longwave Infrared Window (10.8 µm) images [click to play animation | MP4]](https://cimss.ssec.wisc.edu/satellite-blog/wp-content/uploads/sites/5/2018/10/MET11_VIS_SWIR_IR_SOUTH_AFRICA_PYROCB_29OCT2018_2018302_131500_0003PANELS_ANOT.gif)
Meteosat-11 Visible (0.8 µm, top), Shortwave Infrared (3.92 µm, center) and Longwave Infrared Window (10.8 µm, bottom) images [click to play animation | MP4]
The Garden Route Fires had been burning since about 24 October 2018 near George along the southern coast of South Africa (
media story). On 29 October,
EUMETSAT Meteosat-11 High Resolution Visible (0.8 µm), Shortwave Infrared (3.92 µm) and Longwave Infrared Window (10.8 µm) images
(above) showed an elongated west-to-east oriented thermal anomaly or fire “hot spot”
(red pixels) just northeast of George
(station identifier FAGG) on Shortwave Infrared imagery during the hours leading up to the formation of a
pyrocumulonimbus (pyroCb) cloud around 1300 UTC. The pyroCb exhibited the characteristic
warm (+10 to +15ºC, darker gray enhancement) shortwave infrared cloud-top signature just off the coast at
1315 UTC, — this is due to enhanced solar reflection off ice crystals that are
smaller compared to those of conventional thunderstorm tops.
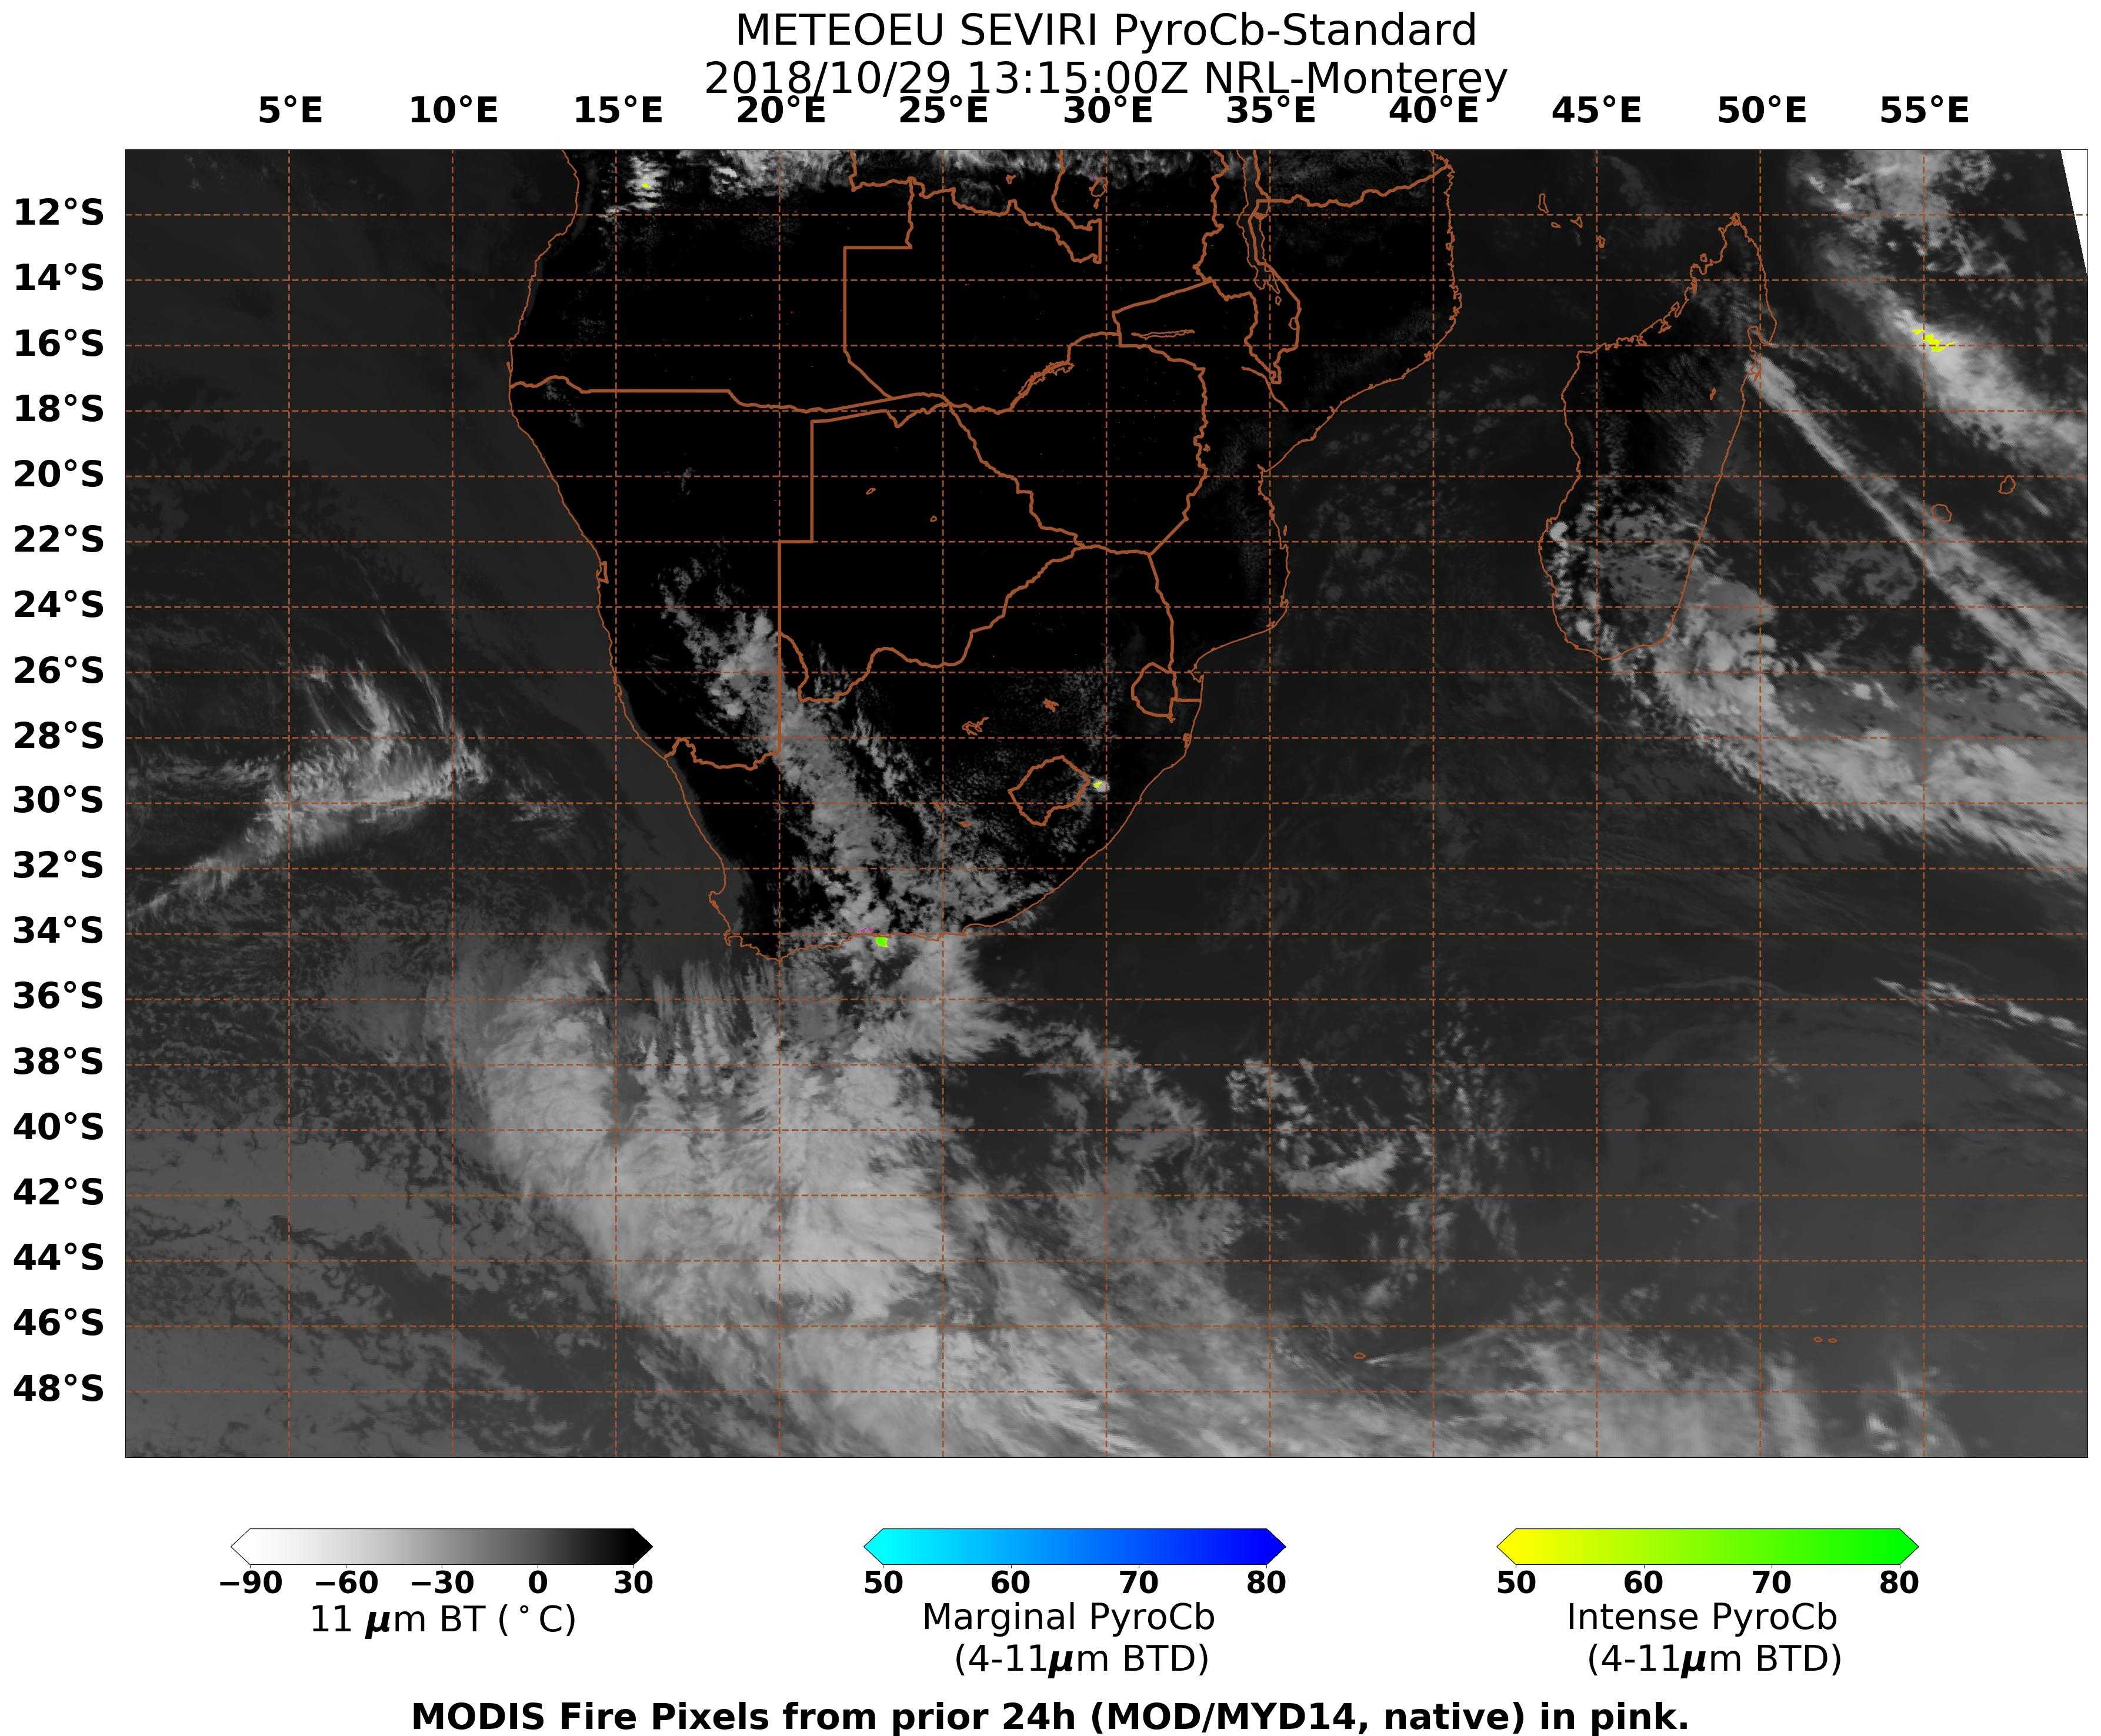
Zooming out a bit to follow the southeastward drift of the pyroCb cloud (below), the coldest cloud-top 10.8 µm infrared brightness temperature (BT) was -61ºC (darker red enhancement) at 1315 UTC — then the cloud tops remained in the -55 to -59ºC range (orange enhancement) for the next 6 hours or so. Leveraging the large difference between cold 10.8 µm and warm 3.92 µm BTs, NRL calculates a pyroCb index, which classified this feature as an “intense pyroCb” (1315 UTC | animation). The coldest 10.8 µm cloud-top BT of -61ºC roughly corresponds to an altitude of 13.5 km based on 12 UTC rawinsonde data from Port Elizabeth (plot | list).
![Meteosat-11 Shortwave Infrared (3.92 µm, left) and Longwave Infrared Window (10.8 µm, right) images [click to play animation | MP4]](https://cimss.ssec.wisc.edu/satellite-blog/wp-content/uploads/sites/5/2018/10/MET11_SWIR_IR_ZA_PYROCB_29OCT2018_2018302_131500_0002PANELS.GIF)
Meteosat-11 Shortwave Infrared (3.92 µm, left) and Longwave Infrared Window (10.8 µm, right) images [click to play animation | MP4]
Imagery from NOAA-19 at 1420 UTC (courtesy of René Servranckx) also revealed the warm
(dark gray) Shortwave Infrared pyroCb signature, along with a minimum cloud-top infrared BT of -58.1ºC
(below).
![NOAA-19 AVHRR imagery at 1420 UTC [click to enlarge]](https://cimss.ssec.wisc.edu/satellite-blog/wp-content/uploads/sites/5/2018/10/181029_1420utc_noaa19_South_Africa_pyrocb.jpg)
NOAA-19 AVHRR imagery at 1420 UTC [click to enlarge]
A Suomi NPP VIIRS True Color Red-Green-Blue (RGB) image at 1230 UTC
(below) was about a half hour before the formation of the pyroCb, but it did show a signature of smoke drifting southeastward off the coast.
![Suomi NPP VIIRS True Color RGB image [click to enlarge]](https://cimss.ssec.wisc.edu/satellite-blog/wp-content/uploads/sites/5/2018/10/181029_snpp_viirs_tc_Africa.jpeg)
Suomi NPP VIIRS True Color RGB image [click to enlarge]
On the following day (30 October), a NOAA-20 VIIRS True Color image
(below) showed the classic comma cloud signature of a mid-latitude cyclone south of the coast, with the band of cold-frontal clouds extending northward across Lesotho. Note the thick plume of smoke spreading eastward within the strong post-frontal westerly winds.
![NOAA-20 VIIRS True Color RGB image [click to enlarge]](https://cimss.ssec.wisc.edu/satellite-blog/wp-content/uploads/sites/5/2018/10/181030_1118utc_noaa20_viirs_truecolor_South_Africa_smoke_anim.gif)
NOAA-20 VIIRS True Color RGB image [click to enlarge]
A time series of of surface observations from George
(below) supported the idea of a cold frontal passage: ahead of the front, temperatures rapidly rose to 104ºF/40ºC (with a dew point of 39ºF/4ºC)
on 28 October about 1.5 hours prior to the formation of the pyroCb — then strong westerly winds (gusting to 40 knots/21 mps) with rising pressures and falling temperatures followed on 30 October.
![Time series plot of of surface observations from George [click to enlarge]](https://cimss.ssec.wisc.edu/satellite-blog/wp-content/uploads/sites/5/2018/10/181028_181030_FAGG_SFCMG.GIF)
Time series plot of of surface observations from George [click to enlarge]
The pyroCb research community believes that this is the first documented case of a pyroCb on the African continent.
View only this post
Read Less
![Meteosat-11 Visible (0.8 µm), Shortwave Infrared (3.92 µm) and Longwave Infrared Window (10.8 µm) images [click to play animation | MP4]](https://cimss.ssec.wisc.edu/satellite-blog/wp-content/uploads/sites/5/2018/10/181029_meteosat11_visible_shortwaveInfrared_infraredWindow_South_Africa_pyrocb_anim.gif)
![Meteosat-11 Shortwave Infrared (3.92 µm, left) and Longwave Infrared Window (10.8 µm, right) images [click to play animation | MP4]](https://cimss.ssec.wisc.edu/satellite-blog/wp-content/uploads/sites/5/2018/10/181029_meteosat11_shortwaveInfrared_infraredWindow_South_Africa_pyrocb_anim.gif)
![Before (10 October) and after (27 October) Aqua MODIS False Color RGB images [click to enlarge]](https://cimss.ssec.wisc.edu/satellite-blog/wp-content/uploads/sites/5/2018/10/181010_181027_aqua_modis_truecolor_Nueces_River_TX_anim.gif)
![Suomi NPP VIIRS Visible (0.64 µm), Near-Infrared Vegetation (0.86 µm) and Near-Infrared Snow/Ice (1.61 µm) images [click to enlarge]](https://cimss.ssec.wisc.edu/satellite-blog/wp-content/uploads/sites/5/2018/10/181027_1918utc_suomiNPP_viirs_visible_nearInfraredVegetation_nearInfraredSnowIce_Nueces_River_TX_anim.gif)
![Aqua MODIS False Color RGB images from 27 and 28 October [click to enlarge]](https://cimss.ssec.wisc.edu/satellite-blog/wp-content/uploads/sites/5/2018/10/181027_181028_aqua_modis_falsecolor_Nueces_River_TX_flood_wave_anim.gif)

![Himawari-8 "Red" Visible (0.64 µm, left) and "Clean" Infrared Window (10.4 µm, right) images [click to play MP4 animation]](https://cimss.ssec.wisc.edu/satellite-blog/wp-content/uploads/sites/5/2018/10/HIM08_VIS_IR_YUTU_26OCT2018_2018300_002944_HIMAWARI-8_0002PANELS.GIF)
![DMSP-17 SSMIS Microwave (85 GHz) and Himawari-8 Infrared Window (10.4 µm) images [click to enlarge]](https://cimss.ssec.wisc.edu/satellite-blog/wp-content/uploads/sites/5/2018/10/181026__2123utc_dmsp17_microwave_2130utc_himawari8_infrared_Yutu_anim.gif)
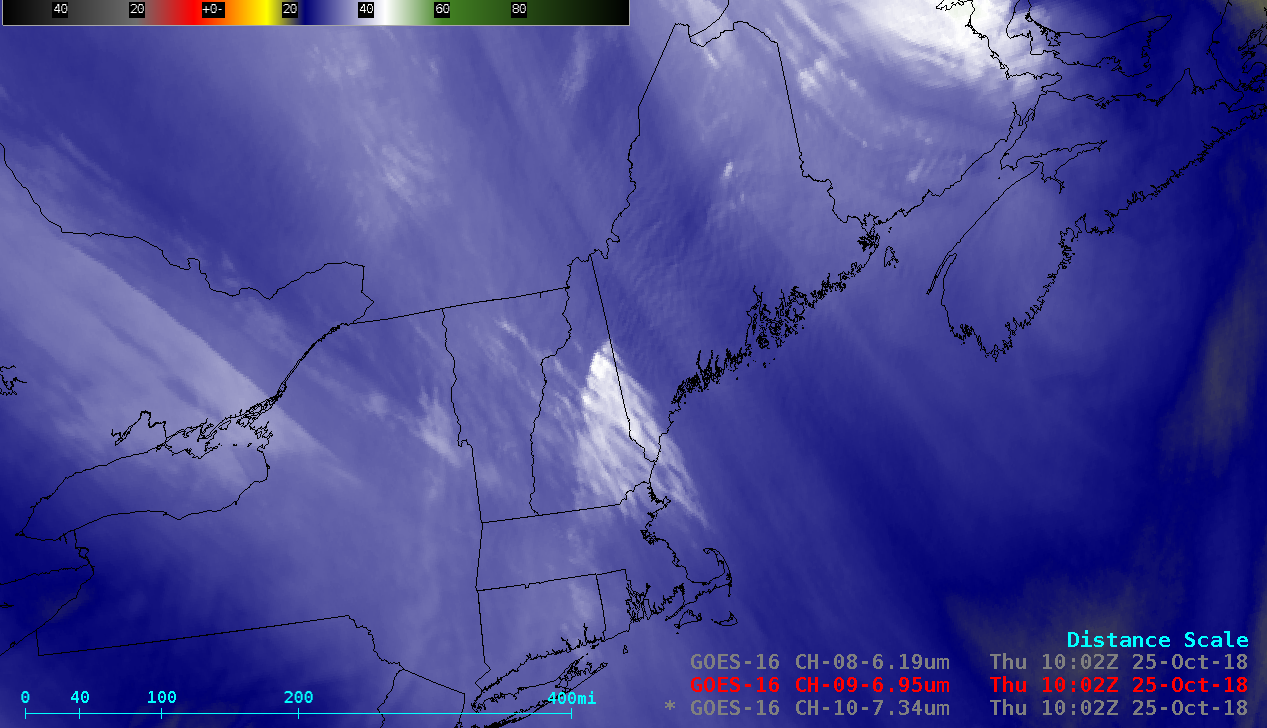
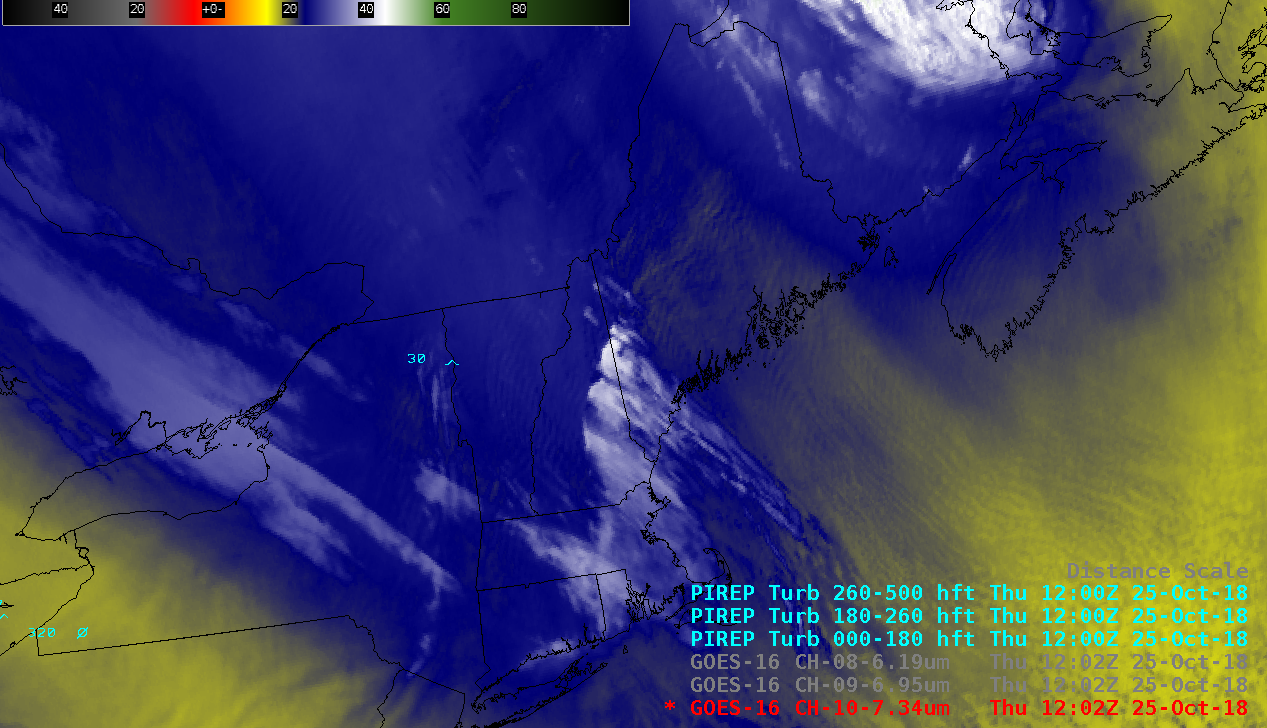
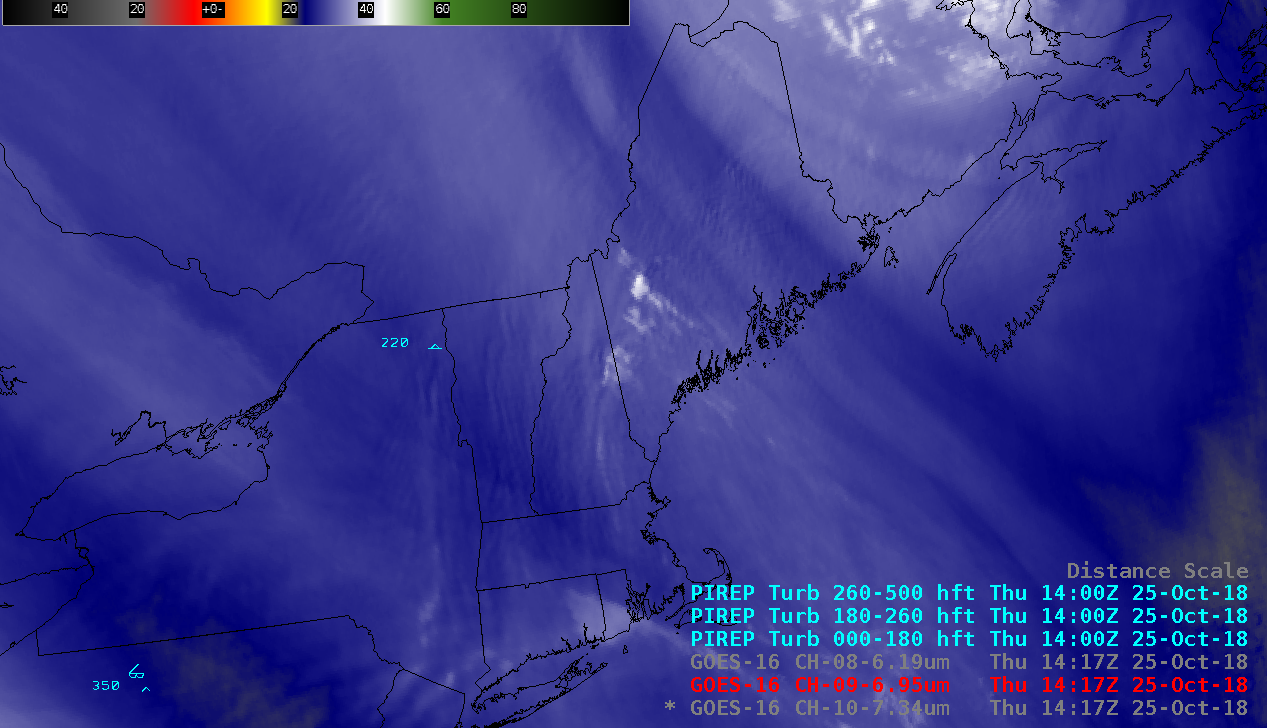
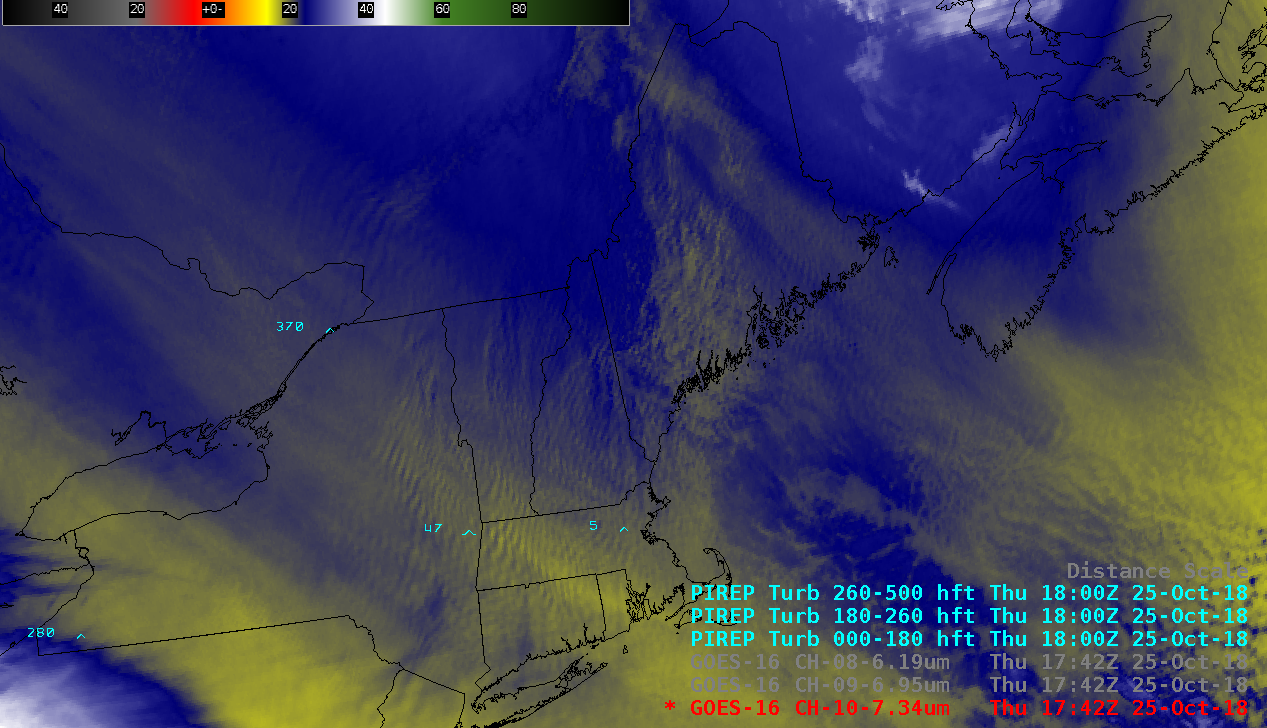
![GOES-16 Low-level (7.3 µm), Mid=level (6.9 µm) and Upper-level (6.2 µm) Water Vapor images [click to play MP4 animation]](https://cimss.ssec.wisc.edu/satellite-blog/wp-content/uploads/sites/5/2018/10/neus_wv9-20181025_100219.png)
![GOES-16 Mid-level Water Vapor (6.9 µm) image + Topography [click to enlarge]](https://cimss.ssec.wisc.edu/satellite-blog/wp-content/uploads/sites/5/2018/10/181025_goes16_waterVapor_topography_anim.gif)
![GOES-16 Mid-level (6.9 µm) Water Vapor images, with RAP40 wind isotachs at 300 hPa [click to play animation | MP4]](https://cimss.ssec.wisc.edu/satellite-blog/wp-content/uploads/sites/5/2018/10/181026_goes16_waterVapor_300hPa_winds_Northeast_US_anim.gif)
![Aqua MODIS Water Vapor (6.7 µm) and Infrared Window (11.0 µm) images [click to enlarge]](https://cimss.ssec.wisc.edu/satellite-blog/wp-content/uploads/sites/5/2018/10/181025_0648utc_aqua_modis_waterVapor_infrared_Northeast_US_anim.gif)
![Suomi NPP (0603 UTC) and NOAA-20 (0650 UTC) VIIRS Day/Night Band (0.7 µm) images [click to enlarge]](https://cimss.ssec.wisc.edu/satellite-blog/wp-content/uploads/sites/5/2018/10/181025_06utc_suomiNPP_noaa20_viirs_dayNightBand_Northeast_US_anim.gif)
![GOES-16 Cloud Top Height product [click to play animation | MP4]](https://cimss.ssec.wisc.edu/satellite-blog/wp-content/uploads/sites/5/2018/10/181026_goes16_cloudTopHeight_Northeast_US_anim.gif)
![GOES-16 Cloud Top Phase product [click to play animation | MP4]](https://cimss.ssec.wisc.edu/satellite-blog/wp-content/uploads/sites/5/2018/10/181026_goes16_cloudTopPhase_Northeast_US_anim.gif)
