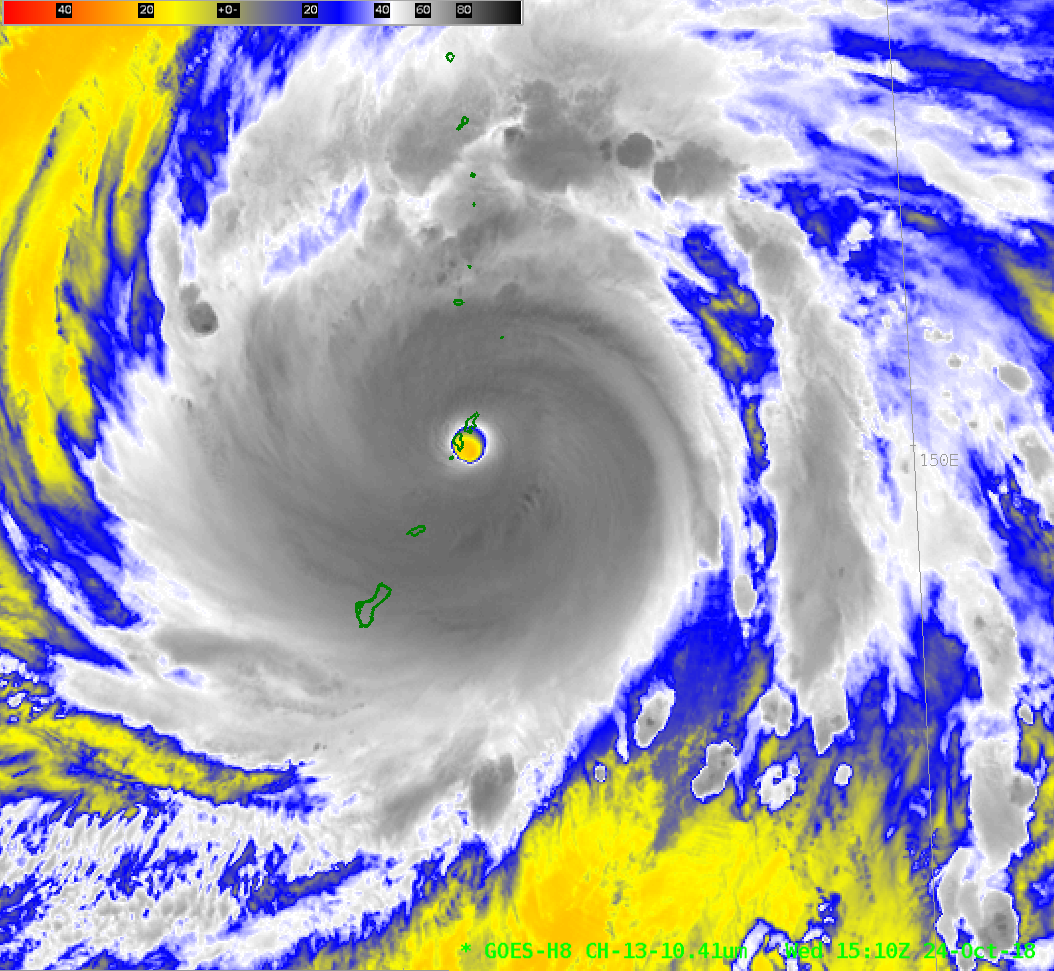
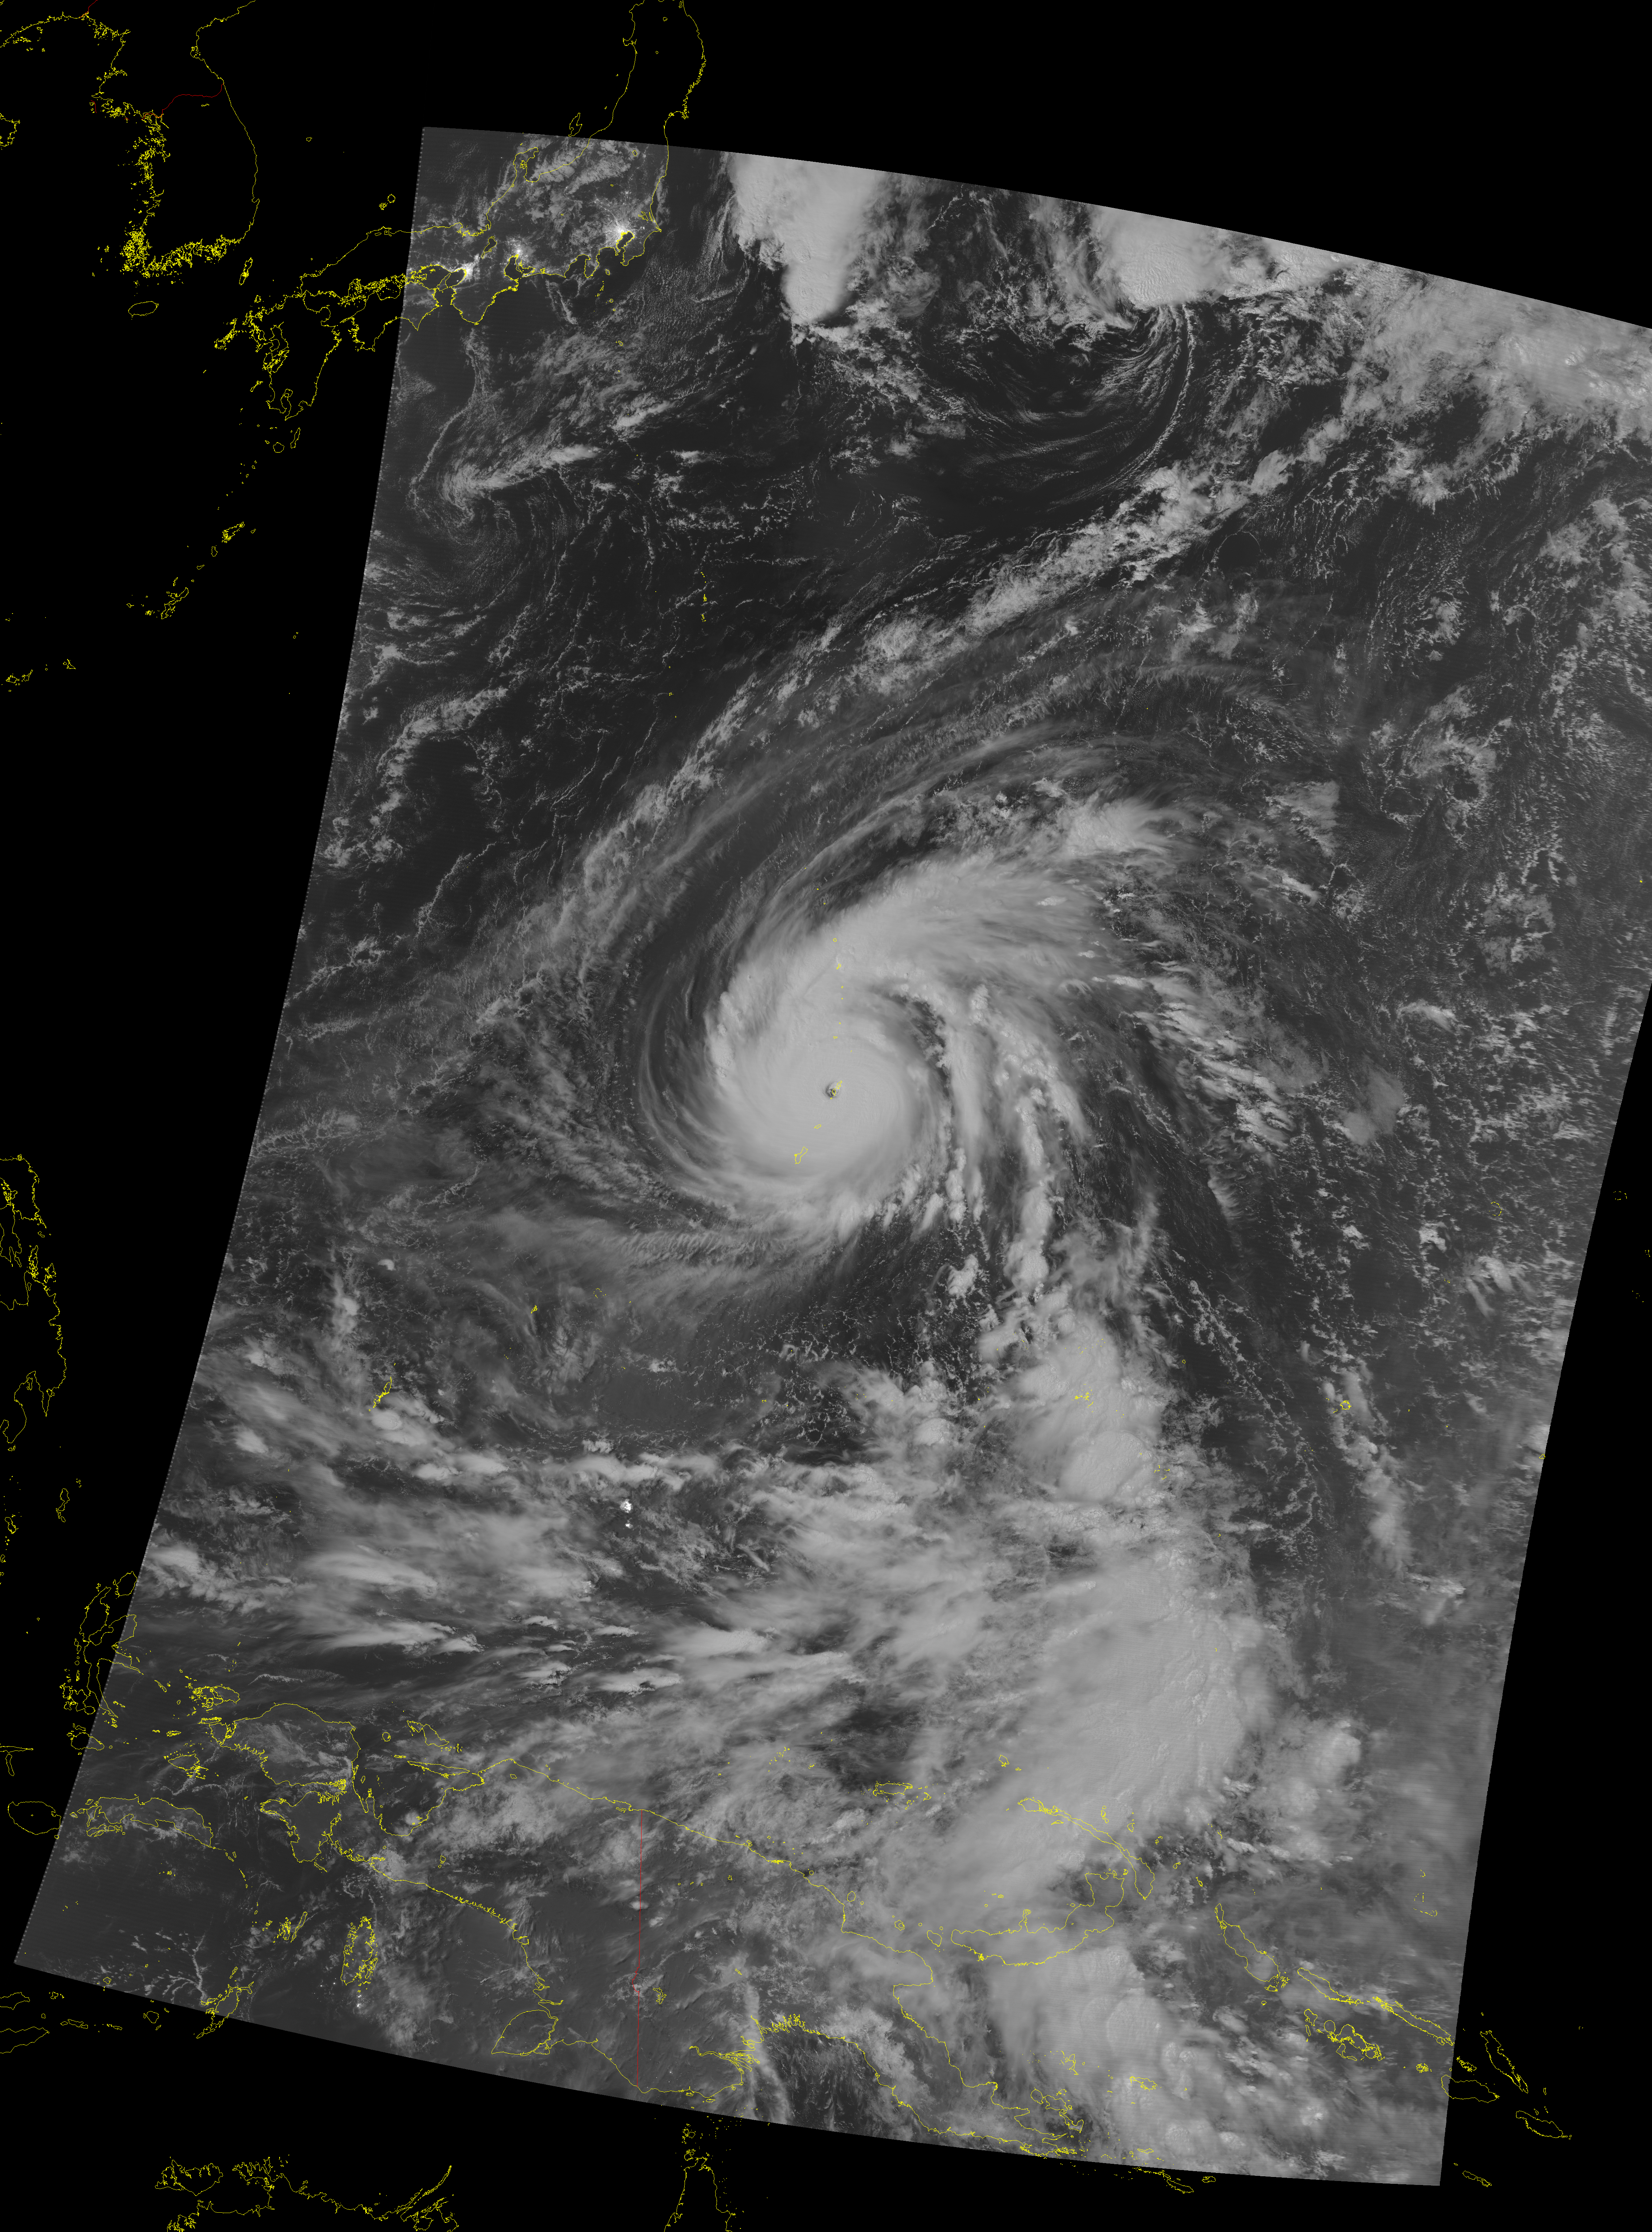
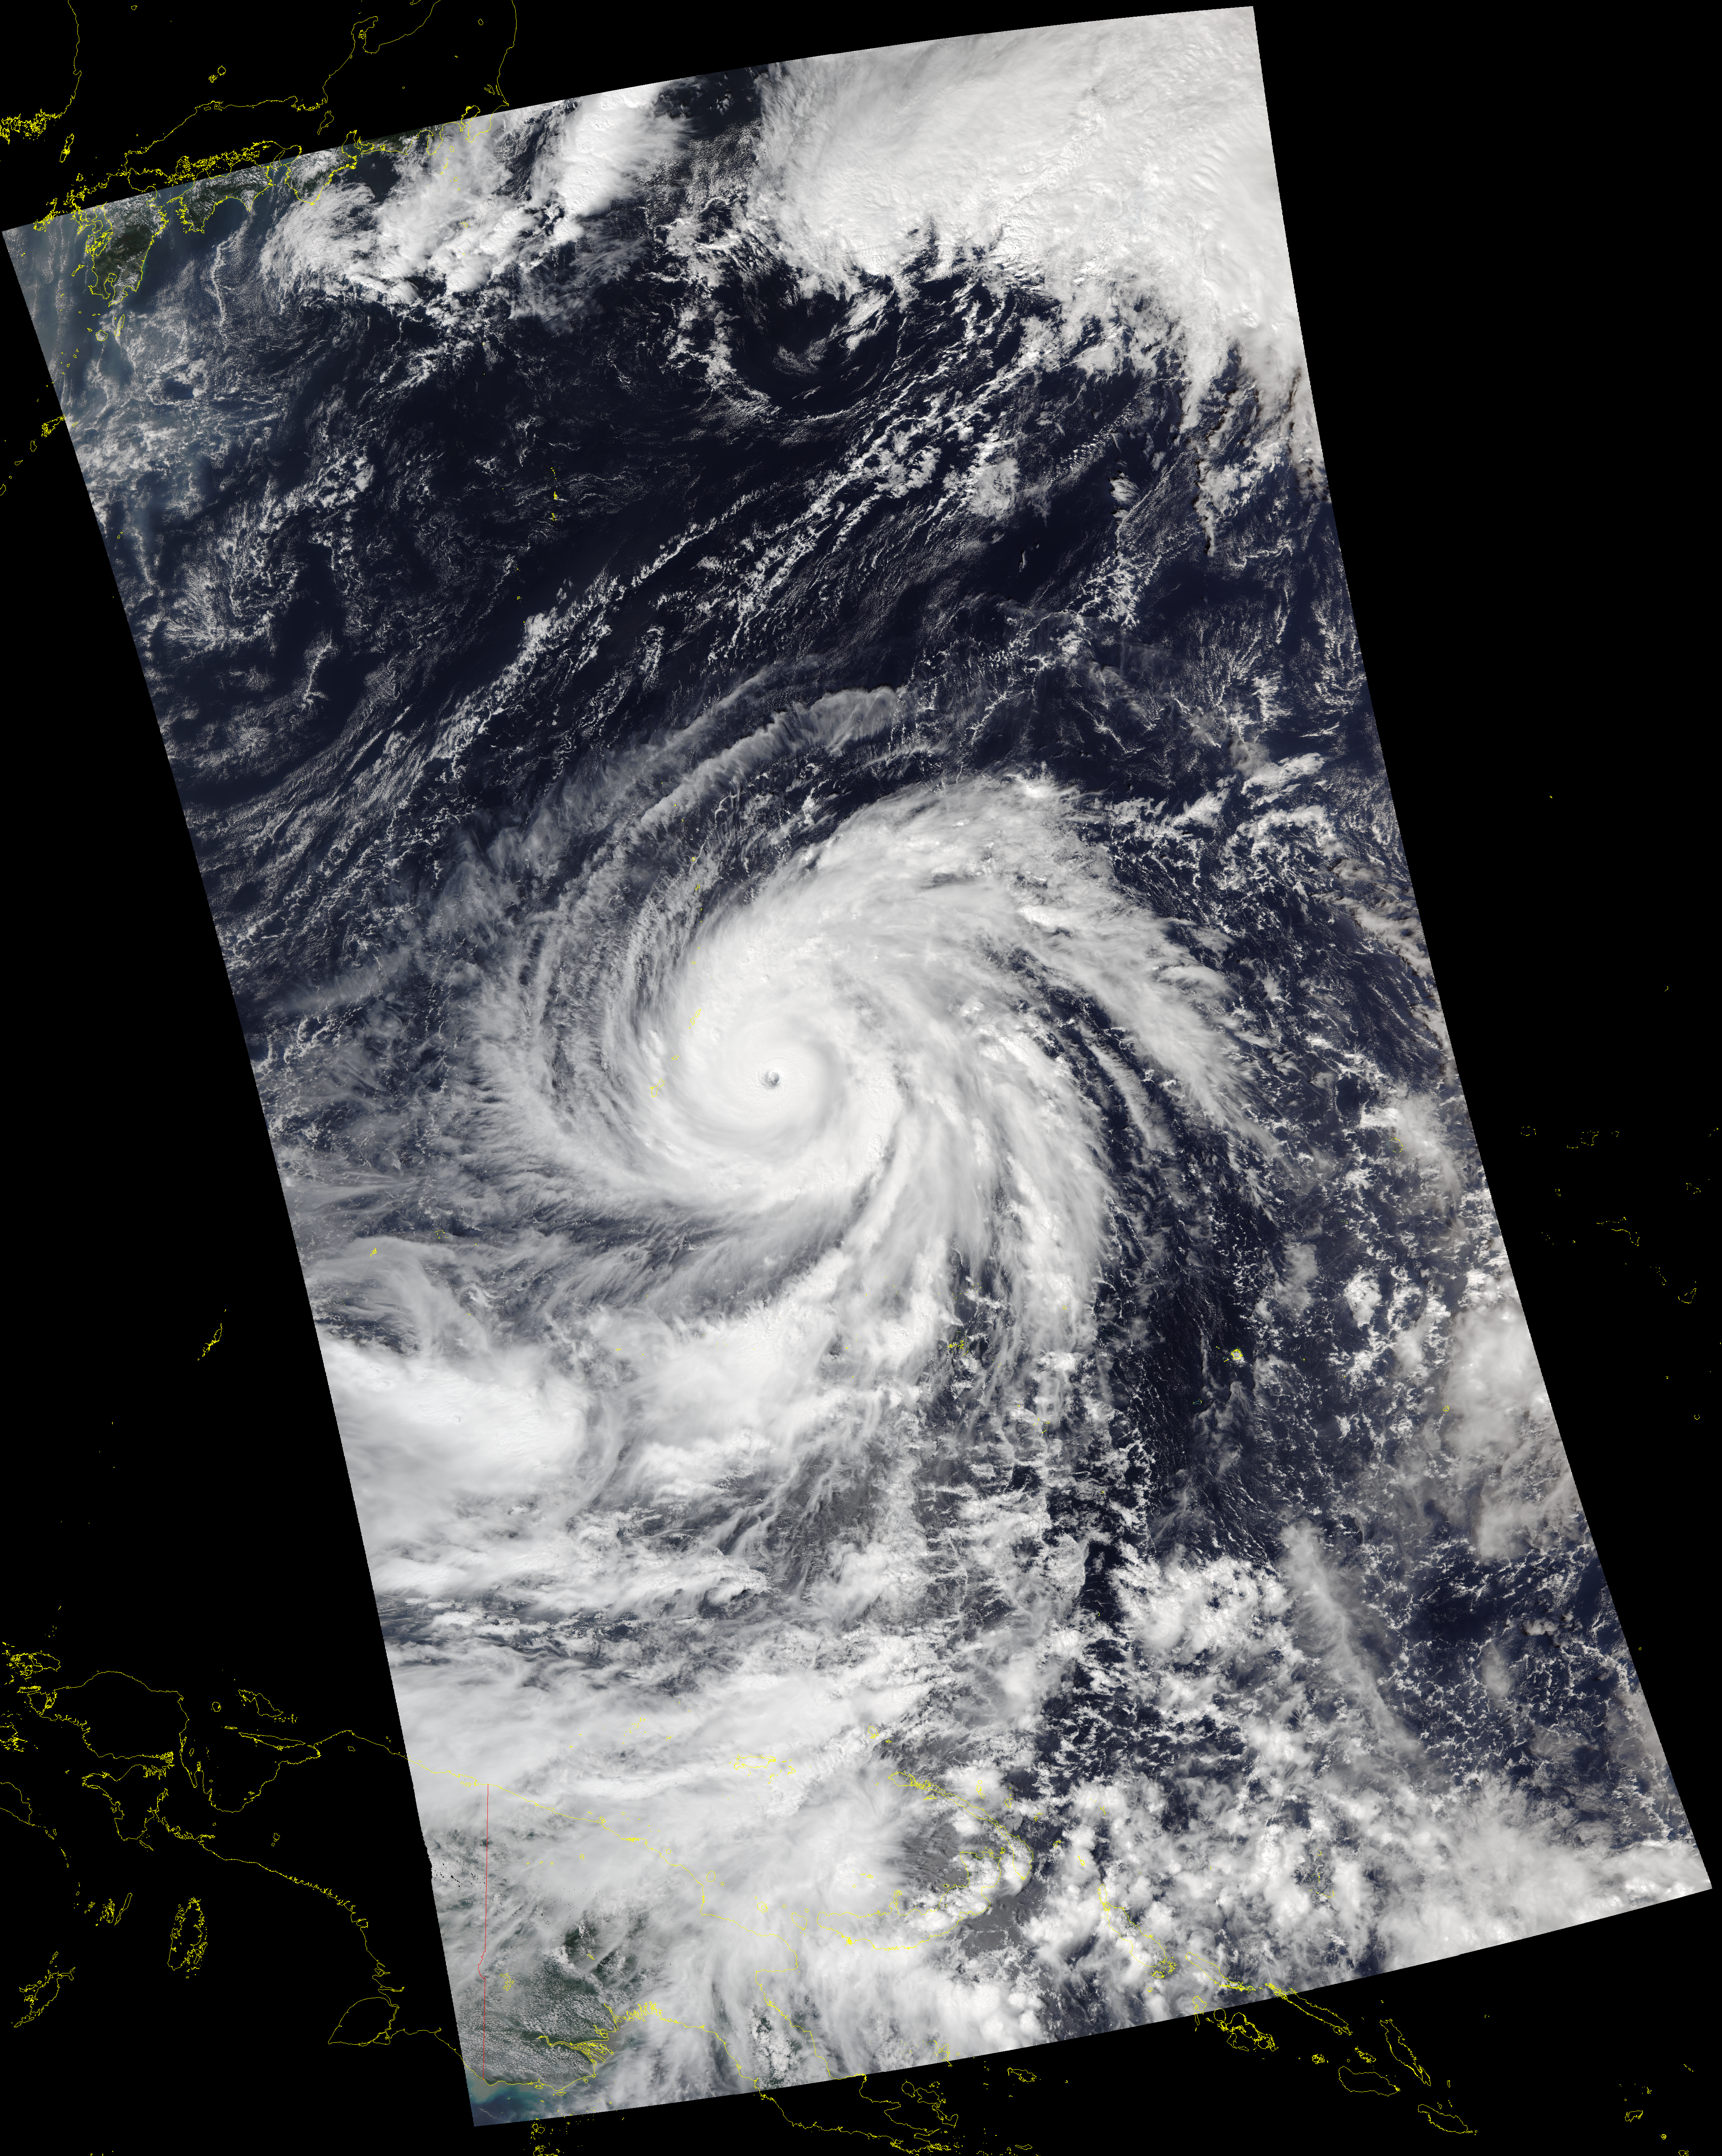
Himawari-8 “Clean Window” Infrared (10.41 µm) Imagery, 0900-1540 UTC on 24 October 2018 (Click to animate)
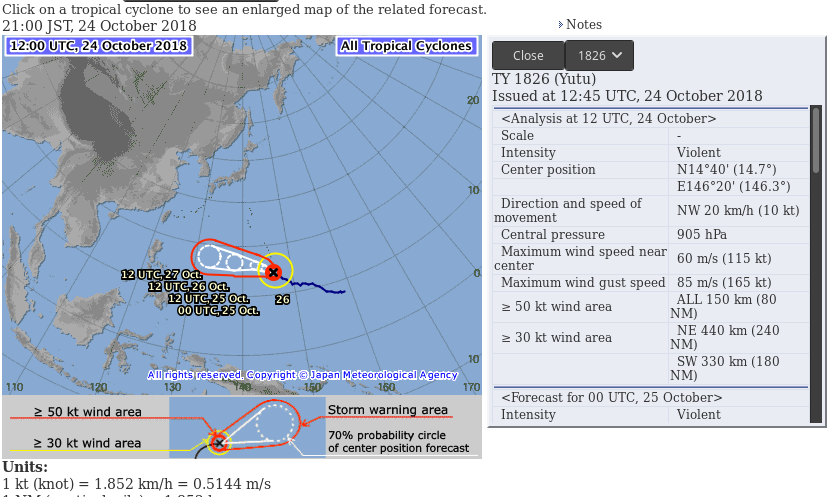
Himawari-8 Clean Window Infrared (10.41 µm) imagery shows Super Typhoon Yutu poised to hit Tinian and Saipan in the Marianas Islands, to the northeast of Guam. The 0900 UTC Advisory from the Joint Typhoon Warning Center shows a storm with sustained winds of 145 knots, with strengthening forecast. JMA estimates a surface pressure of 905 hPa! (Link)
(Himawari data courtesy JMA and the NWS Pacific Region)
Update: Landfall on Tinian and Saipan occurred just before 1500 UTC; a closer view using 2.5 minute rapid scan Himawari-8 imagery can be seen here (station plot PGSN is Saipan, where reliable observations ceased after 1452 UTC).
Added: From William Straka, CIMSS. NOAA-20 had a fortuitous overpass, almost directly over Tinian at landfall. The Day Night Band Visible (0.7 µm) Imagery (with a full moon) and 11.45 µm infrared imagery is shown below).
NOAA-20 VIIRS Day Night Band visible (0.7 µm) imagery and I05 infrared (11.45 µm) imagery, 1551 UTC on 24 October 2018 (Click to enlarge)
CIMSS helps manage a Direct Broadcast (DB) antenna at the National Weather Service on Guam, and that antenna received both NOAA-20 and GCOM data as the eye was over, or close to, Tinian. Microwave imagery from The Advanced Microwave Scanning Radiometer 2 (AMSR-2) on JAXA’s GCOM satellite, below, (courtesy Kathy Strabala, CIMSS) at 36.5 GHz and 89.0 GHz, reveals cloud and rainband structures that infrared imagery cannot. In particular, the 89.0 GHz imagery suggests the formation of an outer eyewall ouside the very compact inner eye. This typically is the start of an eyewall replacement cycle.
GCOM AMSR-2 imagery at 36.5 and 89.0 GHz, 1601 UTC on 24 October 2018 (Click to enlarge)
The DB antenna also processed data from NOAA-20, the same overpass as shown above, zoomed in over Tinian. The antenna is able to capture data over much of the western Pacific Basin, as the Day Night Band visible image shows below. A true color image from the previous overpass on Guam, 12 hours earlier, during daytime (0311 UTC on 24 October), is here.
NOAA-20 VIIRS Day Night Band visible (0.7 µm) imagery, 1544 UTC on 24 October 2018 (Click to enlarge)
View only this post Read Less

![Plot of Guam rawinsonde data [click to enlarge]](https://cimss.ssec.wisc.edu/satellite-blog/wp-content/uploads/sites/5/2018/10/181023_PGUM_RAOBS.GIF)
![Himawari-8 Mid-level Water Vapor (6.9 µm) images, with mid/upper-level satellite-derived winds [click to enlarge]](https://cimss.ssec.wisc.edu/satellite-blog/wp-content/uploads/sites/5/2018/10/181023_himawari8_waterVapor_winds_Yutu_anim.gif)
![Suomi NPP VIIRS Day/Night Band (0.7 µm) and Infrared Window (11.45 µm) images [click to enlarge]](https://cimss.ssec.wisc.edu/satellite-blog/wp-content/uploads/sites/5/2018/10/181022_0852utc_suomiNPP_viirs_dayNightBand_infraredWindow_Willa_anim.gif)
![GOES-16 "Red" Visible (0.64 µm) and "Clean" Infrared Window (10.3 µm) images [click to play MP4 animation]](https://cimss.ssec.wisc.edu/satellite-blog/wp-content/uploads/sites/5/2018/10/G16_VIS_IR_WILLA_22OCT2018_2018295_161827_GOES-16_0002PANELS.GIF)
![GOES-16 "Red" Visible (0.64 µm) and "Clean" Infrared Window (10.3 µm) images [click to play MP4 animation]](https://cimss.ssec.wisc.edu/satellite-blog/wp-content/uploads/sites/5/2018/10/willa_stereo.jpeg)

![GOES-16 Shortwave Infrared (3.9 µm) images [click to play animation | MP4]](https://cimss.ssec.wisc.edu/satellite-blog/wp-content/uploads/sites/5/2018/10/181020_181021_goes16_shortwaveInfrared_Ontario_plume_anim.gif)
![Suomi NPP VIIRS Day/Night Band (0.7 µm), Shortwave Infrared (3.74 µm), Infrared Window (11.45 µm) and Fog.stratus BTD (11.45-3.74 µm) images [click to enlarge]](https://cimss.ssec.wisc.edu/satellite-blog/wp-content/uploads/sites/5/2018/10/181021_0716utc_suomiNPP_viirs_DayNightBand_shortwaveInfrared_infraredWindow_fogBTD_Ontario_plume_anim.gif)
![Terra/Aqua MODIS and NOAA-20/Suomi NPP VIIRS Fog/stratus BTD images [click to enlarge]](https://cimss.ssec.wisc.edu/satellite-blog/wp-content/uploads/sites/5/2018/10/181021_modis_viirs_fogBTD_Ontario_plume_anim.gif)
