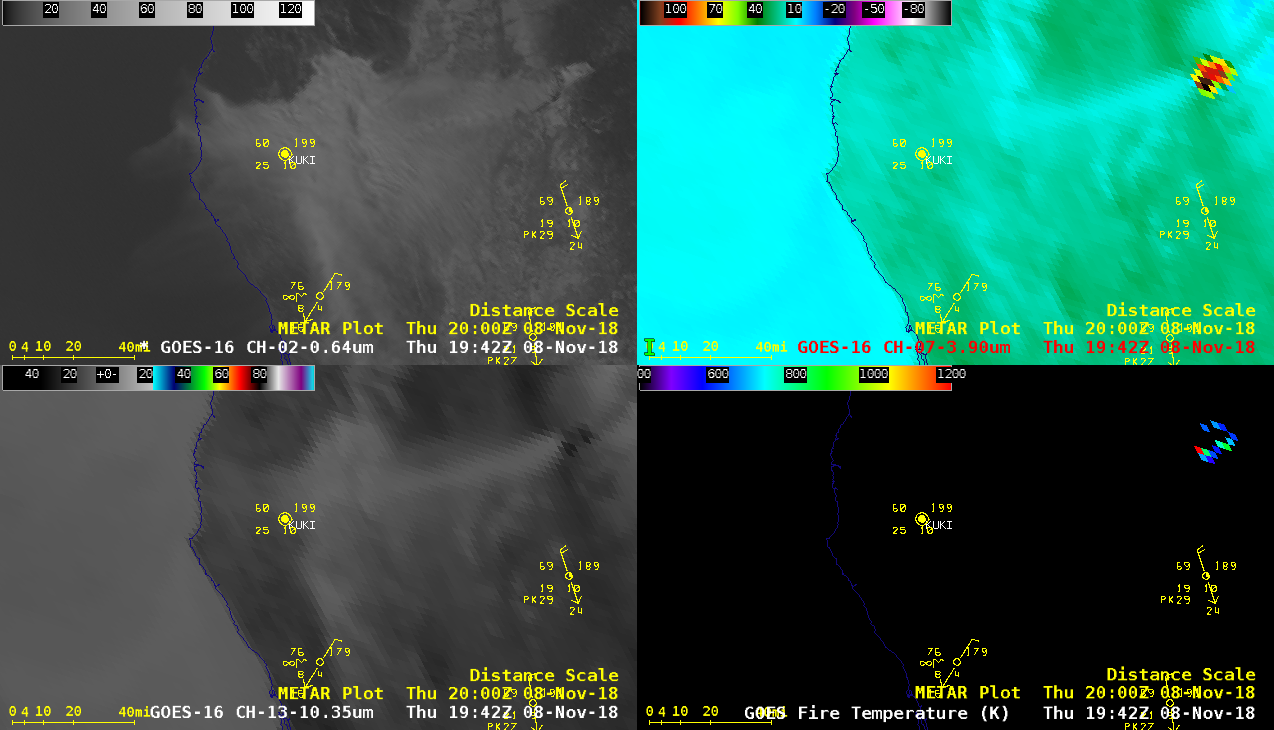
GOES-16 “Red” Visible (0.64 µm, top left), Shortwave Infrared (3.9 µm, top right), “Clean” Infrared Window (10.3 µm, bottom left) and Fire Temperature (bottom right) [click to play animation | MP4]
The
Camp Fire started around 1433 UTC or 6:33 AM local time on
08 November 2018 in Northern California; the rapid spread of the fire prompted evacuations and forced road closures. GOES-16
(GOES-East) GOES-16 “Red” Visible (
0.64 µm), Shortwave Infrared (
3.9 µm), “Clean” Infrared Window (
10.3 µm) and
Fire Temperature (above) showed the initial evolution of the fire at 5-minute intervals — especially noteworthy were (1) the rapid vertical jump of the smoke column at
1547 UTC, which cast a long shadow to the northwest
, and (2) Fire Temperature values that exceeded 2000 K
(bright red pixels) at numerous times, with a maximum value just over 2300 K.
A GOES-16 Mesoscale Domain Sector was positioned over California beginning at 2115 UTC, providing imagery at 1-minute intervals — a comparison of Visible and Shortwave Infrared images (below) showed how quickly the hot thermal signature of the fire (yellow to red enhancement) advanced southwestward during the remaining 3 hours of daylight. Just northwest of the fire, Chico (station identifier KCIC) reported very low relative humidity values (6% at 21 UTC), as seen by the large spread between temperature and dewpoint late in the day.
GOES-16 “Red” Visible (0.64 µm, left) and Shortwave Infrared (3.9 µm, right) images [click to play MP4 animation]
1-km resolution NOAA-18 AVHRR Visible (0.64 µm), Near-Infrared “Vegetation” (0.86 µm), Shortwave Infrared (3.7 µm) and Infrared Window (10.8 µm) images
(below) showed the bifurcation of the smoke plume as well as the large, very hot thermal signature of the fire at 1712 UTC or 9:12 AM local time.
![NOAA-18 AVHRR Visible (0.64 µm), Near-Infrared "Vegetation" (0.86 µm), Shortwave Infrared (3.7 µm) and Infrared Window (10.8 µµ) images [click to enlarge]](https://cimss.ssec.wisc.edu/satellite-blog/wp-content/uploads/sites/5/2018/11/181108_1712utc_noaa18_visible_vegetation_shortwaveInfrared_infraredWindow_Camp_Fire_CA_anim.gif)
NOAA-18 AVHRR Visible (0.64 µm), Near-Infrared “Vegetation” (0.86 µm), Shortwave Infrared (3.7 µm) and Infrared Window (10.8 µm) images [click to enlarge]
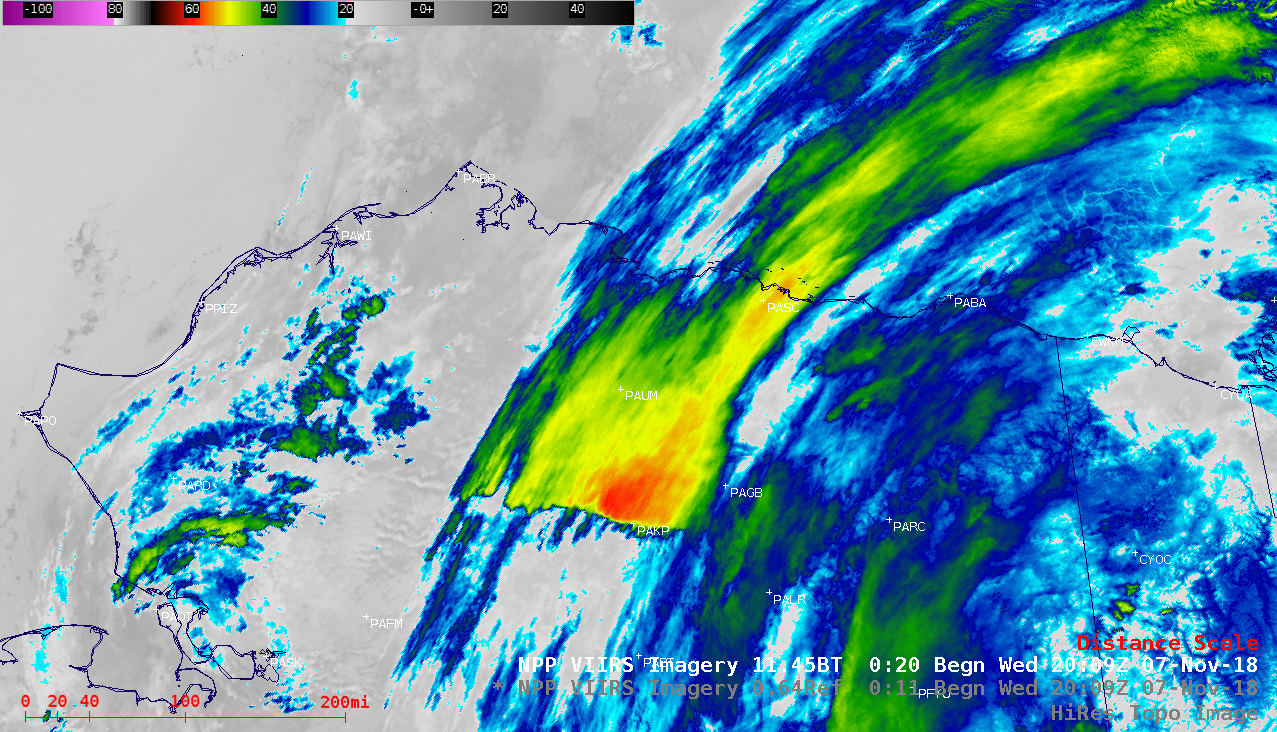
NOAA-20 VIIRS Visible (0.64 µm), Near-Infrared “Snow/Ice” (1.61 µm) and Infrared Window (11.45 µm) images [click to enlarge]
Higher spatial resolution views were provided by NOAA-20 VIIRS Visible (0.64 µm), Near-Infrared “Snow/Ice” (1.61 µm) and Infrared Window (11.45 µm) images
(above) and by Aqua MODIS Visible (0.65 µm), Near-Infrared “Snow/Ice” (1.61 µm) and Infrared Window (11.0 µm) images
(below). [Note: the NOAA-20 VIIRS images are incorrectly labeled as Suomi NPP]
Aqua MODIS Visible (0.65 µm), Near-Infrared “Snow/Ice” (1.61 µm) and Infrared Window (11.0 µm) images [click to enlarge]
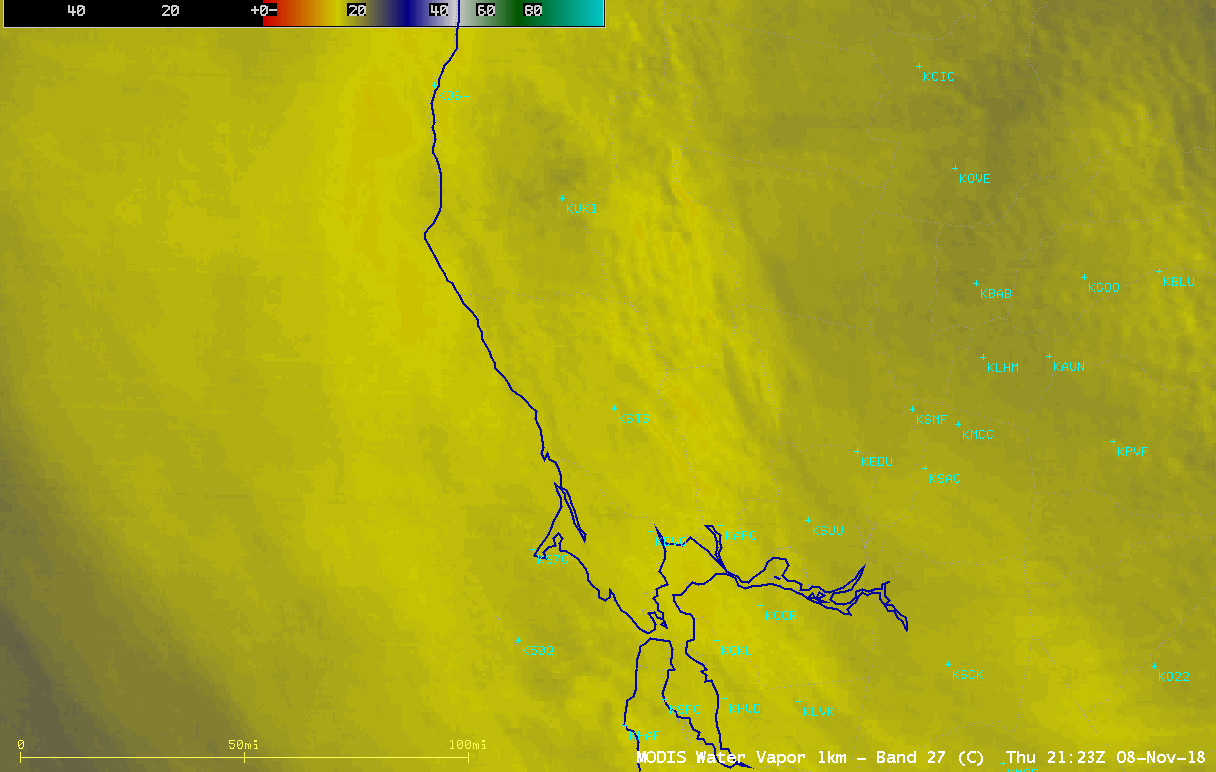
Alternative views of the NOAA-20 VIIRS and Aqua MODIS images are shown below (using legacy AWIPS-1).They include Shortwave Infrared images from the 2 satellites, which reveal the very large
(approximately 10 miles in length) thermal anomaly or fire “hot spot”. Due to the very dry atmosphere over the region (MODIS 6.7 µm
Water Vapor image), the smoke could be clearly seen on the MODIS 1.37 µm Cirrus image (since there was very little attenuation of upwelling 1.37 µm radiation by middle/upper-tropospheric water vapor).
![NOAA-20 Visible (0.64 µm), Day/Night Band (0.7 µm), Near-Infrared "Snow/Ice" (1.61 µm), Shortwave Infrared (3.74 µm) and Infrared Window (11.45 µm) images [click to enlarge]](https://cimss.ssec.wisc.edu/satellite-blog/wp-content/uploads/sites/5/2018/11/181108_2037utc_noaa20_viirs_visible_dayNightBand_snowIce_shortwaveInfrared_infraredWindow_Camp_Fire_CA_anim.gif)
NOAA-20 Visible (0.64 µm), Day/Night Band (0.7 µm), Near-Infrared “Snow/Ice” (1.61 µm), Shortwave Infrared (3.74 µm) and Infrared Window (11.45 µm) images [click to enlarge]
![Aqua MODIS Visible (0.65 µm), Near-Infrared "Cirrus" (1.37 µm), Near-Infrared "Snow/Ice" (1.61 µm), Shortwave Infrared (3.7 µm) and Infrared Window (11.0 µm) images [click to enlarge]](https://cimss.ssec.wisc.edu/satellite-blog/wp-content/uploads/sites/5/2018/11/181108_2123utc_aqua_modis_visible_cirrus_snowIce_shortwaveInfrared_infraredWindow_Camp_Fire_CA_anim.gif)
Aqua MODIS Visible (0.65 µm), Near-Infrared “Cirrus” (1.37 µm), Near-Infrared “Snow/Ice” (1.61 µm), Shortwave Infrared (3.7 µm) and Infrared Window (11.0 µm) images [click to enlarge]
As a result of the unusual dryness air mass across the region, the
00 UTC Oakland sounding set a record low Total Precipitable Water value for the date (3 mm or 0.12 inch):
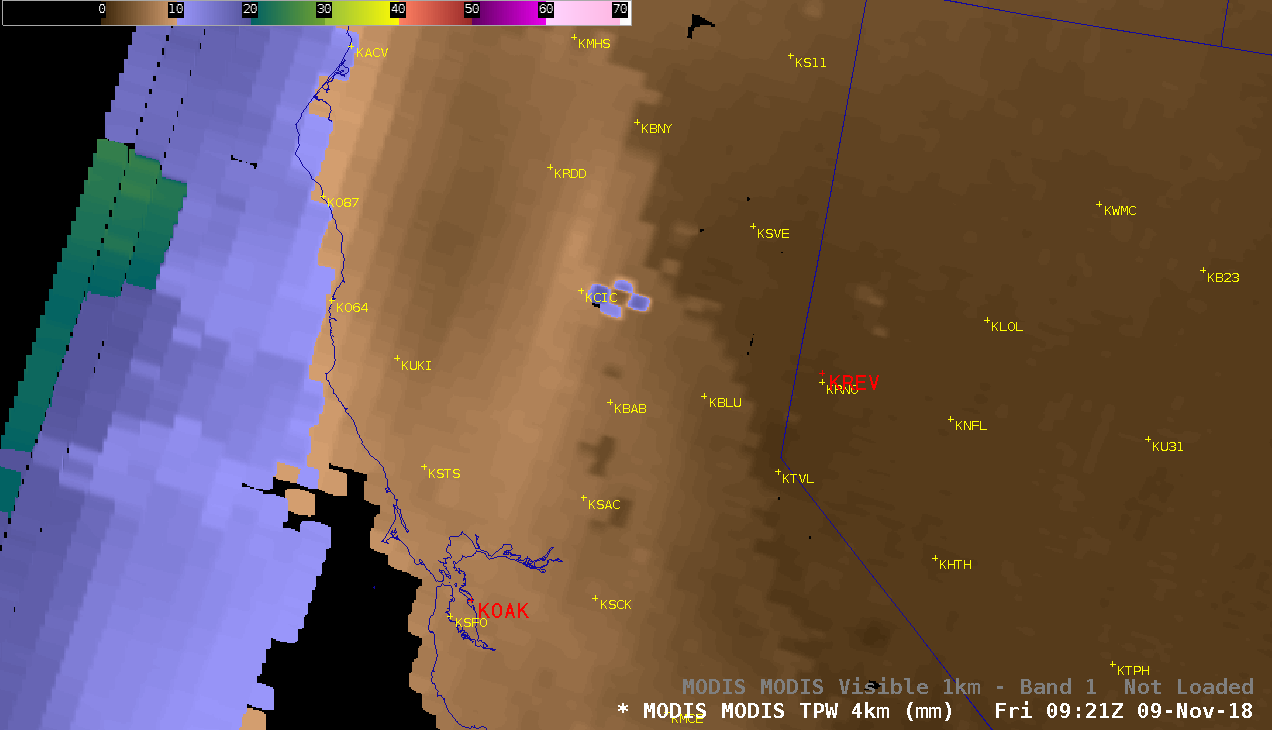
The Aqua MODIS Total Precipitable Water product at 2123 UTC (below) showed widespread values in the 3-5 mm range (darker shades of brown) over much or northern California. 12 hours later, the TPW value from the 12 UTC Oakland sounding was slightly lower (2.9 mm or 0.11 inch) — and the MODIS TPW product at 0921 UTC continued to show widespread dry air over California.
![Aqua MODIS Total Precipitable Water product and Visible (0.65 µm) image at 2123 UTC [click to enlarge]](https://cimss.ssec.wisc.edu/satellite-blog/wp-content/uploads/sites/5/2018/11/181108_2123utc_modis_totalPrecipitableWater_visible_NorCal_anim.gif)
Aqua MODIS Total Precipitable Water product and Visible (0.65 µm) image at 2123 UTC [click to enlarge]
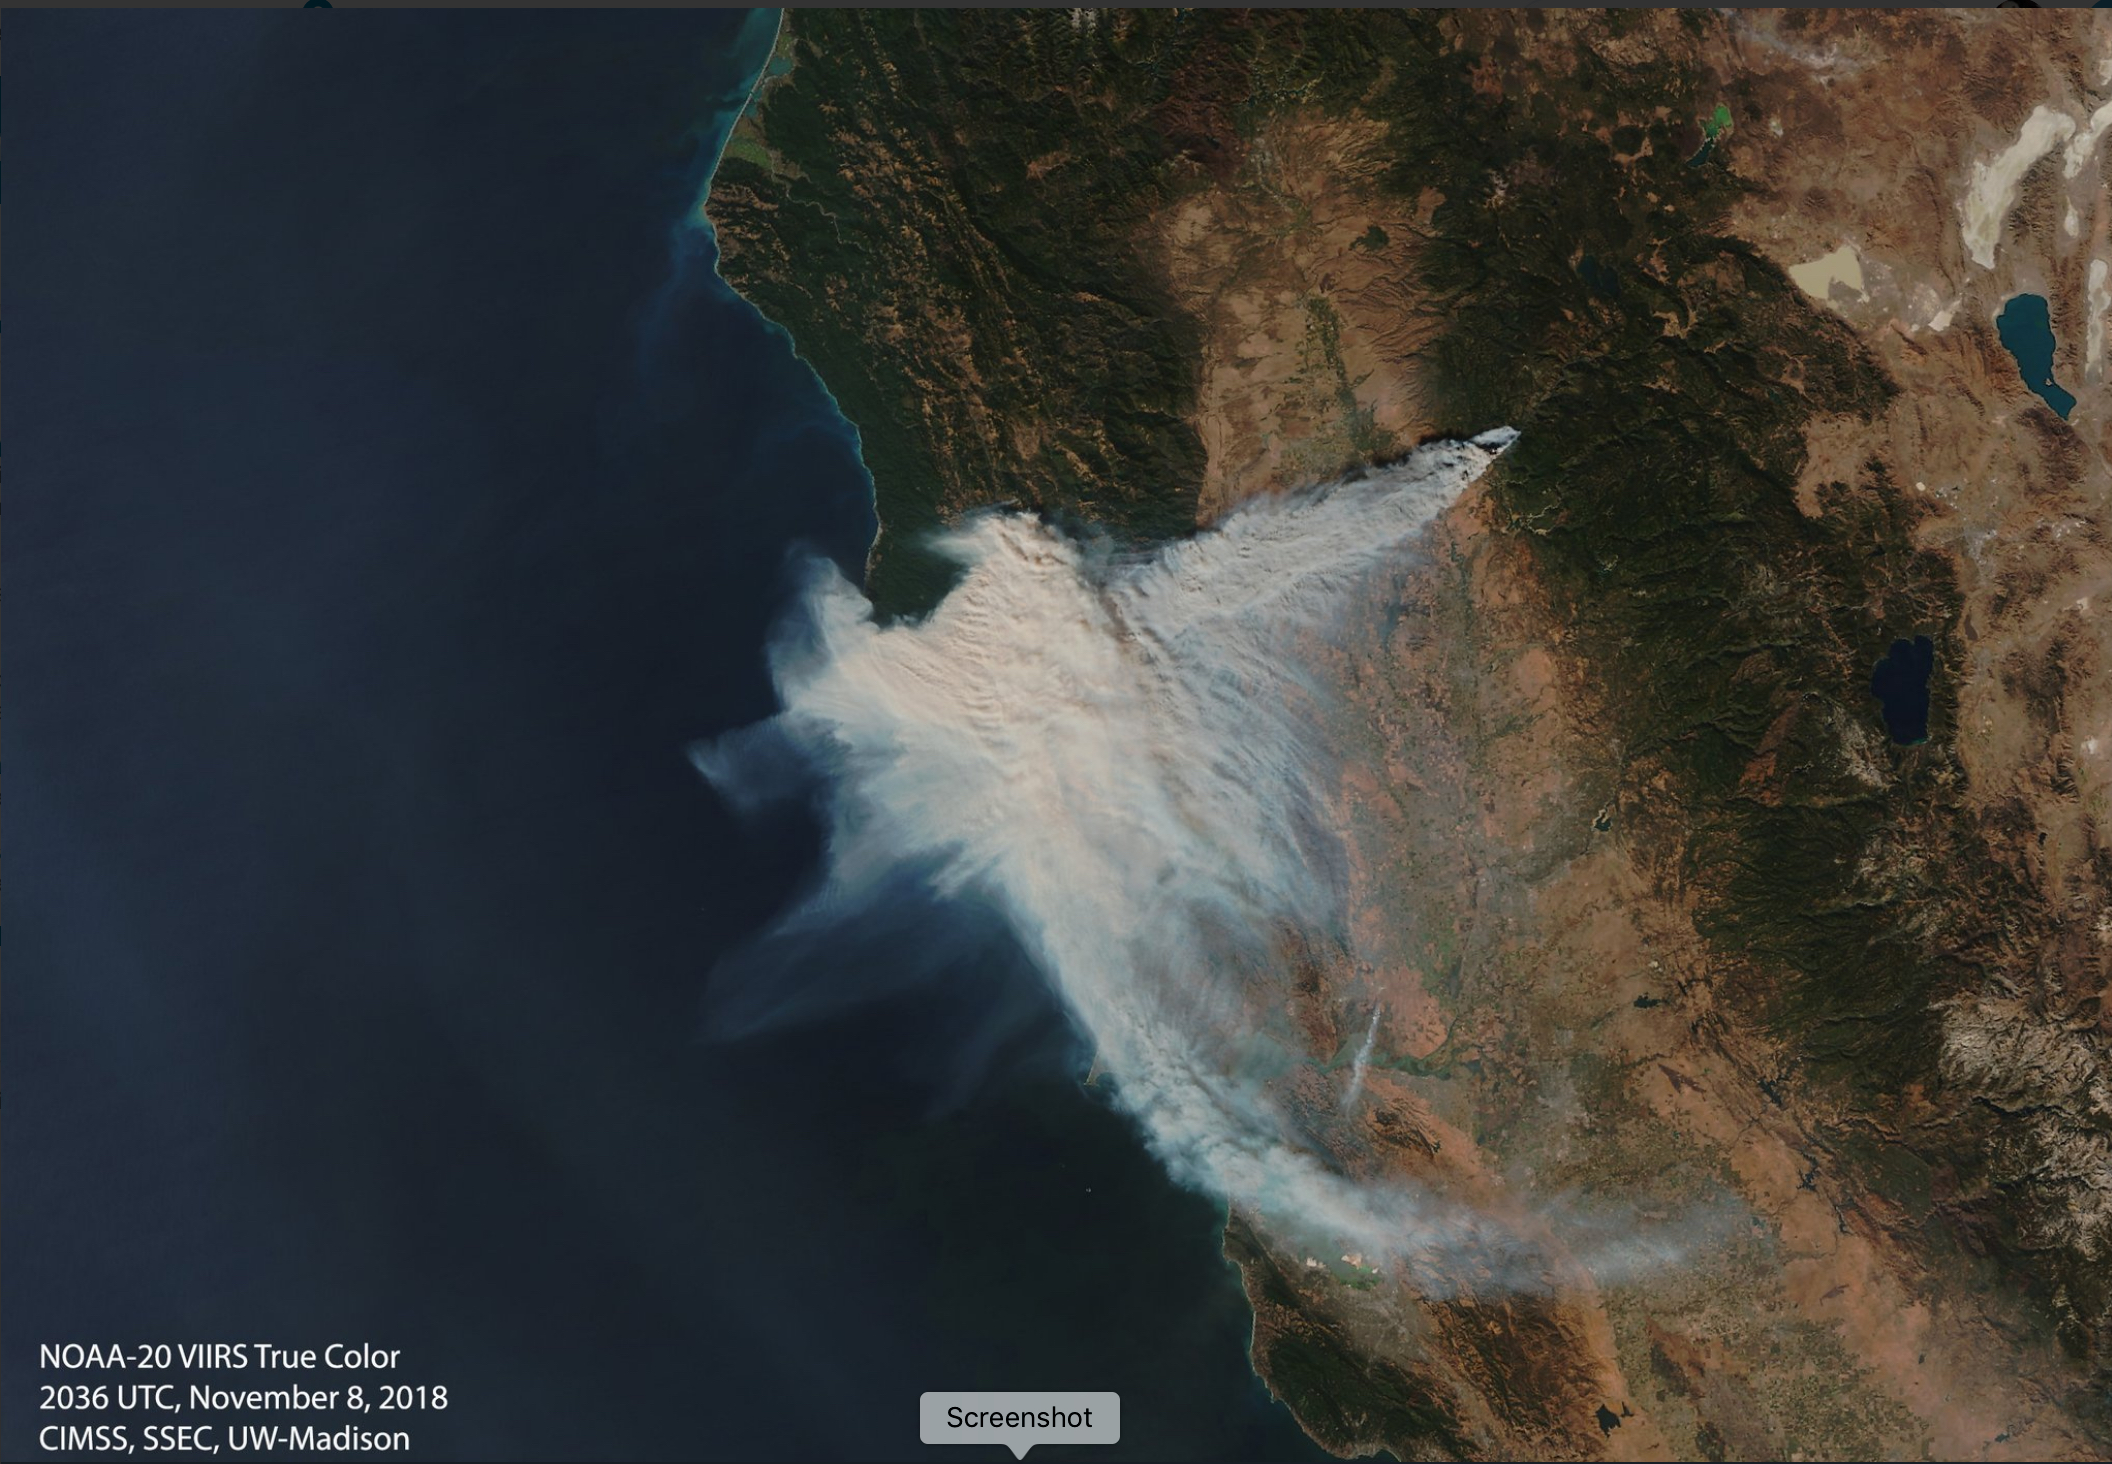
True Color Red-Green-Blue (RGB) imagery from NOAA-20 VIIRS
(below) provided a good view of the smoke.
![NOAA-20 VIIRS True Color RGB image [click to enlarge]](https://cimss.ssec.wisc.edu/satellite-blog/wp-content/uploads/sites/5/2018/11/181108_2036utc_noaa20_viirs_truecolor_Camp_Fire_CA.jpg)
NOAA-20 VIIRS True Color RGB image [click to enlarge]
A NOAA-15 AVHRR Shortwave Infrared image at 0225 UTC or 6:25 PM local time
(below) depicted the very large thermal anomaly of the fire.
![NOAA-15 AVHRR Shortwave Infrared (3.7 µm) image; major highways are plotted in cyan, with Interstate highways plotted in red [click to enlarge]](https://cimss.ssec.wisc.edu/satellite-blog/wp-content/uploads/sites/5/2018/11/181109_0225UTC_NOAA15_SWIR_CA.GIF)
NOAA-15 AVHRR Shortwave Infrared (3.7 µm) image; major highways are plotted in cyan, with Interstate highways plotted in red [click to enlarge]
The smoke had an adverse impact on air quality over 100 miles from the fire source: the surface visibility dropped to 1 mile at Santa Rosa KSTS and 2 miles at San Francisco International Airport KSFO
(below).
![Time series of surface observations for Santa Rosa [click to enlarge]](https://cimss.ssec.wisc.edu/satellite-blog/wp-content/uploads/sites/5/2018/11/181108_KSTS_SFCMG.GIF)
Time series of surface observations from Santa Rosa [click to enlarge]
![Time series of surface observations from San Francisco International Airport [click to enlarge]](https://cimss.ssec.wisc.edu/satellite-blog/wp-content/uploads/sites/5/2018/11/181108_KSFO_SFCMG.GIF)
Time series of surface observations from San Francisco International Airport [click to enlarge]
===== 09 November Update =====
![NOAA-20 VIIRS Day/Night Band (0.7 µm) and Shortwave Infrared (3.74 µm) images [click to enlarge]](https://cimss.ssec.wisc.edu/satellite-blog/wp-content/uploads/sites/5/2018/11/181109_0849utc_noaa20_viirs_dayNightBand_shortwaveInfrared_Camp_Fire_CA_anim.gif)
NOAA-20 VIIRS Day/Night Band (0.7 µm) and Shortwave Infrared (3.74 µm) images [click to enlarge]
Nighttime VIIRS Day/Night Band (0.7 µm) and Shortwave Infrared (3.74 µm) images from NOAA-20 at 0849 UTC
(above) and Suomi NPP at 0942 UTC
(below) revealed the bright glow and the large, hot thermal anomaly of the Camp Fire.
![Suomi NPP VIIRS Day/Night Band (0.7 µm) and Shortwave Infrared (3.74 µm) images [click to enlarge]](https://cimss.ssec.wisc.edu/satellite-blog/wp-content/uploads/sites/5/2018/11/181109_0942utc_suomiNPP_viirs_dayNightBand_shortwaveInfrared_Camp_Fire_CA_anim.gif)
Suomi NPP VIIRS Day/Night Band (0.7 µm) and Shortwave Infrared (3.74 µm) images [click to enlarge]
VIIRS True Color RGB images from Suomi NPP at 2104 UTC and NOAA-20 at 2154 UTC
(below) showed the broad extent of the smoke from the Camp Fire in northern California as well as the Woolsey Fire in southern California. These images were captured and processed by the CIMSS/SSEC Direct Broadcast ground station.
![Suomi NPP VIIRS True Color RGB image at 2104 UTC [click to enlarge]](https://cimss.ssec.wisc.edu/satellite-blog/wp-content/uploads/sites/5/2018/11/181109_2104utc_suomiNPP_viirs_truecolor_CalFires_smoke.jpg)
Suomi NPP VIIRS True Color RGB image at 2104 UTC [click to enlarge]
![NOAA-20 VIIRS True Color RGB image at 2154 UTC [click to enlarge]](https://cimss.ssec.wisc.edu/satellite-blog/wp-content/uploads/sites/5/2018/11/181109_2154utc_noaa20_viirs_truecolor_CalFires_smoke.jpg)
NOAA-20 VIIRS True Color RGB image at 2154 UTC [click to enlarge]
An animation of 1-minute GOES-16 Visible and Shortwave Infrared images
(below) revealed several plume jumps over the fire source from 15-19 UTC — and toward the end of the day, a decrease in the areal coverage and intensity of hot pixels indicated that extreme fire conditions were easing and containment efforts were slowing the spread of the fire.
![GOES-16 "Red" Visible (0.64 µm, left) and Shortwave Infrared (3.9 µm, right) images [click to play MP4 animation]](https://cimss.ssec.wisc.edu/satellite-blog/wp-content/uploads/sites/5/2018/11/G16_VIS_SWIR_NORCAL_FIRES_09NOV2018_2018313_190125_GOES-16_0002PANELS.GIF)
GOES-16 “Red” Visible (0.64 µm, left) and Shortwave Infrared (3.9 µm, right) images [click to play MP4 animation]
Abnormally dry to extreme drought conditions across California were a contributing factor to this and other wildfires across the state.
![US Drought Monitor conditions as of 06 November [click to enlarge]](https://cimss.ssec.wisc.edu/satellite-blog/wp-content/uploads/sites/5/2018/11/181106_CA_drought_monitor.png)
US Drought Monitor conditions as of 06 November [click to enlarge]
====== 11 November Update =====
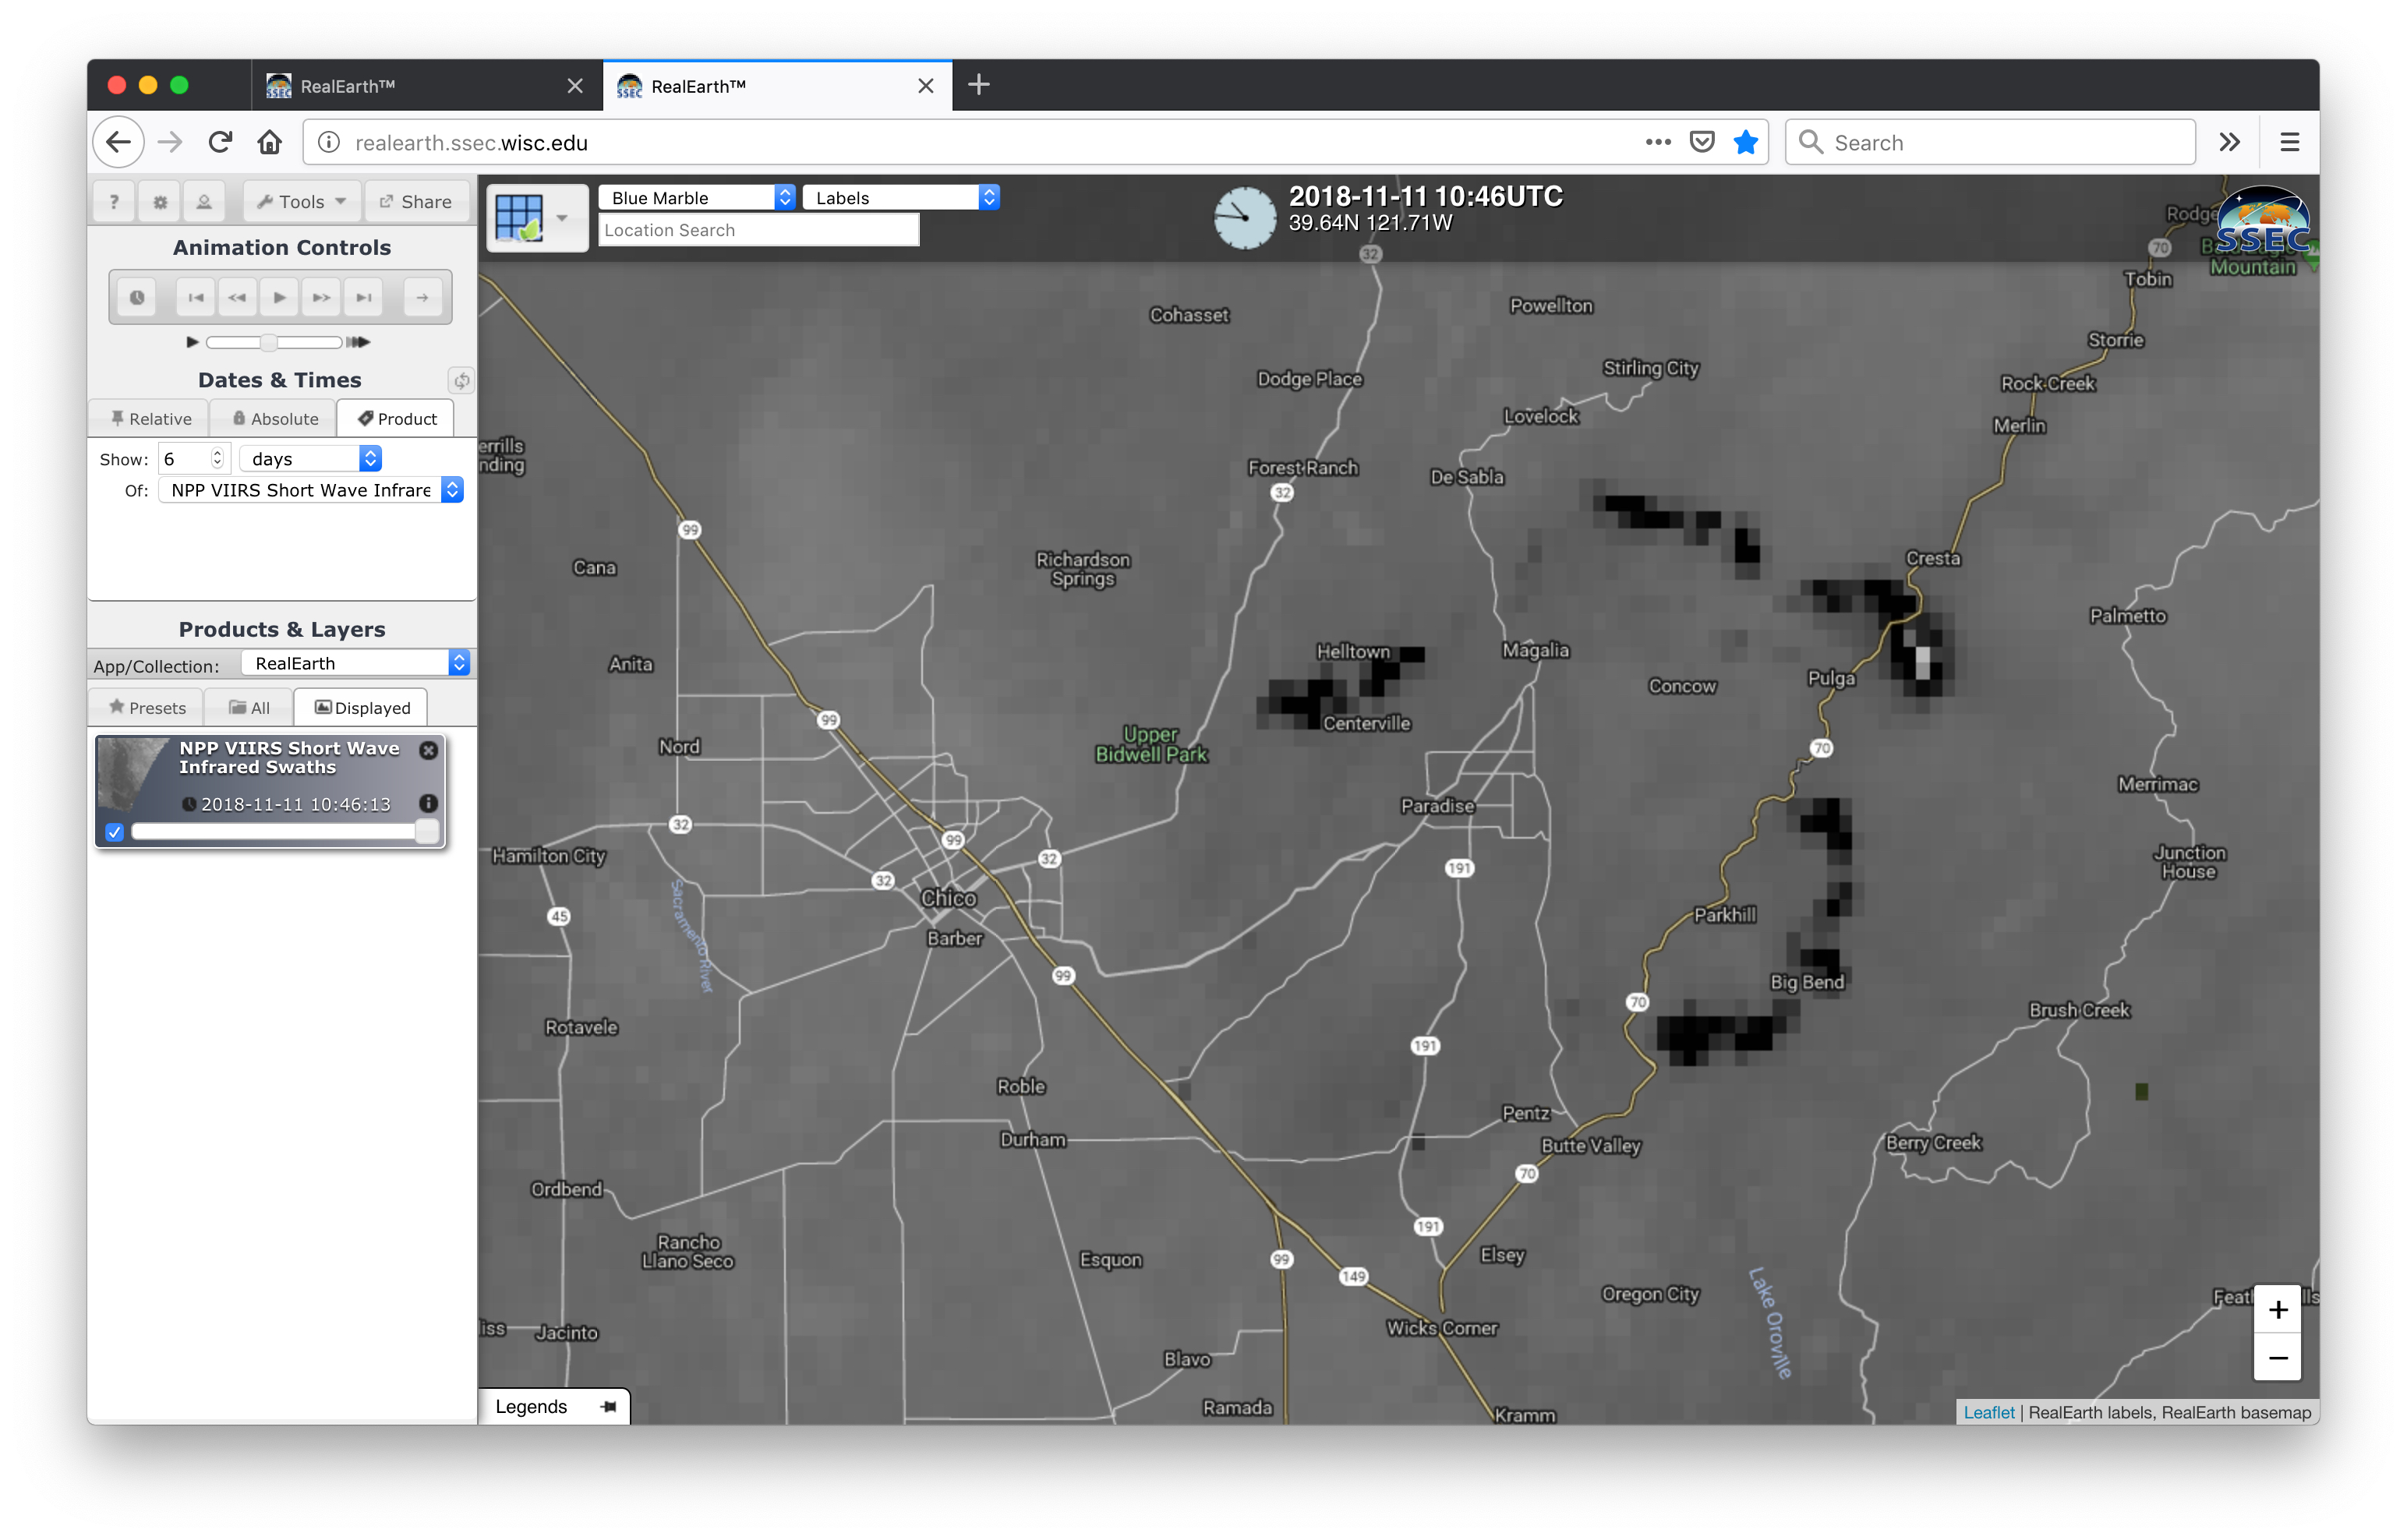
![Suomi NPP VIIRS Shortwave Infrared (3.74 µm) images [click to play animation]](https://cimss.ssec.wisc.edu/satellite-blog/wp-content/uploads/sites/5/2018/11/181108_1943utc_viirs_swir_camp.jpg)
Suomi NPP VIIRS Shortwave Infrared (3.74 µm) images [click to play animation]
A sequence of Suomi NPP VIIRS Shortwave Infrared (3.74 µm) images centered at Paradise, California viewed using
RealEarth (above) showed the spread of the Camp Fire thermal anomaly
(dark black pixels) during the period
1943 UTC on 08 November to
1046 UTC on 11 November.
1-minute GOES-16 Visible and Shortwave Infrared images (below) showed the development of new smoke plume and hot thermal signatures around the periphery of the ongoing Camp Fire during the day on 11 November. As of 1849 UTC (10:49 AM local time), the fire had burned 109,000 acres and was listed as 25% contained.
![GOES-16 “Red” Visible (0.64 µm, left) and Shortwave Infrared (3.9 µm, right) images [click to play MP4 animation]](https://cimss.ssec.wisc.edu/satellite-blog/wp-content/uploads/sites/5/2018/11/G16_VIS_SWIR_NORCAL_FIRES_11NOV2018_2018315_220125_GOES-16_0002PANELS.GIF)
GOES-16 “Red” Visible (0.64 µm, left) and Shortwave Infrared (3.9 µm, right) images [click to play MP4 animation]
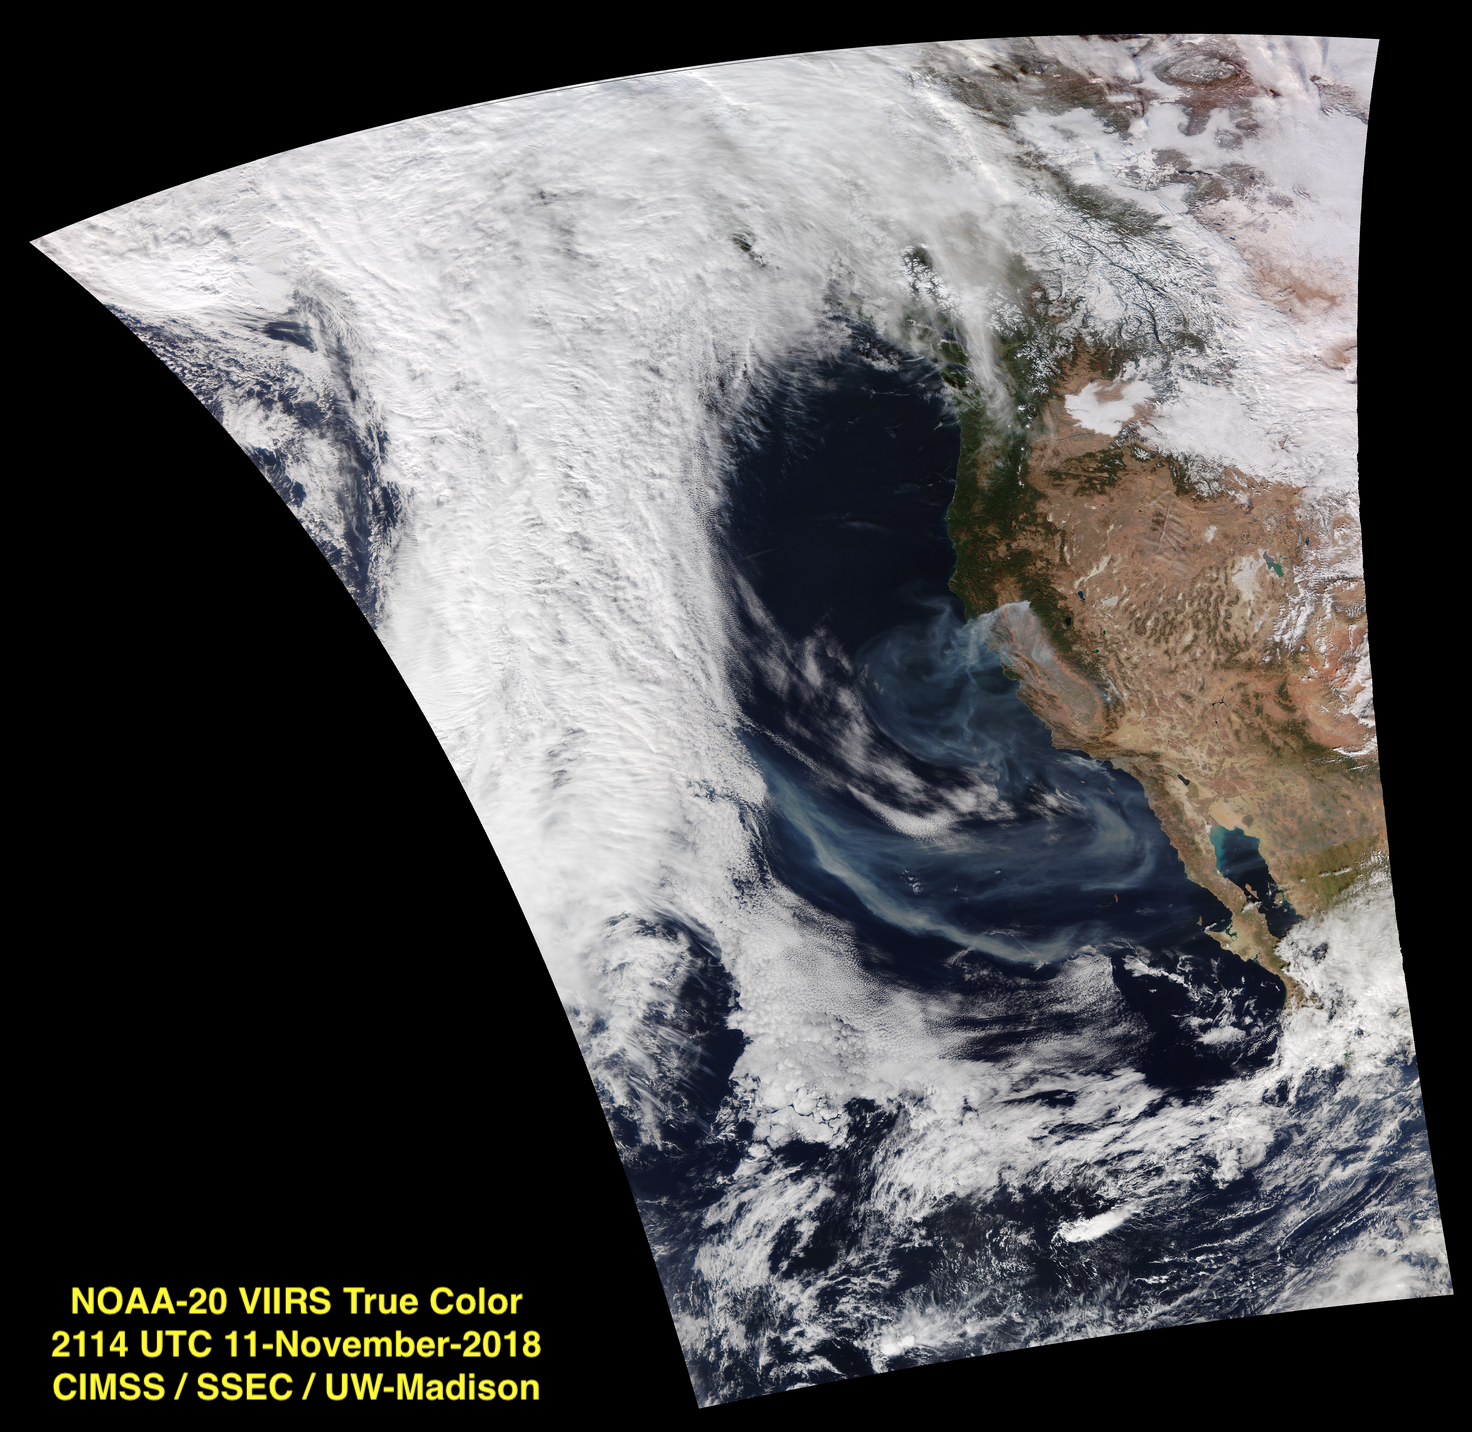
The new smoke plume — as well as residual smoke from previous days of burning — could be seen on VIIRS True Color RGB imagery from Suomi NPP at 2029 UTC and NOAA-20 at 2114 UTC
(below). The entire image swaths as captured and processed by the Direct Broadcast ground station at CIMSS/SSEC can be seen
here and
here.
![Suomi NPP VIIRS True Color RGB image at 2029 UTC [click to enlarge]](https://cimss.ssec.wisc.edu/satellite-blog/wp-content/uploads/sites/5/2018/11/181111_2029utc_suomiNPP_viirs_truecolor_NorCal.jpg)
Suomi NPP VIIRS True Color RGB image at 2029 UTC [click to enlarge]
![NOAA-20 VIIRS True Color RGB image at 2114 UTC [click to enlarge]](https://cimss.ssec.wisc.edu/satellite-blog/wp-content/uploads/sites/5/2018/11/181111_2114utc_noaa20_viirs_truecolor_NorCal.jpg)
NOAA-20 VIIRS True Color RGB image at 2114 UTC [click to enlarge]
The Camp Fire claimed 85 lives, burned 153,000 acres and destroyed nearly 19,000 structures — making it both the deadliest and the most destructive wildfire on record for the state of California.
View only this post
Read Less
![GOES-16 “Red” Visible (0.64 µm, left) and Shortwave Infrared (3.9 µm, right) images [click to play MP4 animation]](https://cimss.ssec.wisc.edu/satellite-blog/wp-content/uploads/sites/5/2018/11/G16_VIS_SWIR_SOCAL_FIRES_09NOV2018_2018313_200125_GOES-16_0002PANELS.GIF)
![GOES-16 Shortwave Infrared (3.9 µm) images [click to play MP4 animation]](https://cimss.ssec.wisc.edu/satellite-blog/wp-content/uploads/sites/5/2018/11/G16_SWIR_SOCAL_FIRES_08_10NOV2018_2018313_190125_GOES-16_0001PANEL.GIF)
![Suomi NPP VIIRS Day/Night Band (0.7 µm) and Shortwave Infrared (3.74 µm) images at 0923 UTC [click to enlarge]](https://cimss.ssec.wisc.edu/satellite-blog/wp-content/uploads/sites/5/2018/11/181110_0923utc_suomiNPP_viirs_shortwaveInfrared_dayNightBand_Woolsey_Fire_CA_anim.gif)
![MODIS and VIIRS Visible images [click to enlarge]](https://cimss.ssec.wisc.edu/satellite-blog/wp-content/uploads/sites/5/2018/11/181109_modis_viirs_visible_Woolsey_Fire_anim.gif)
![Suomi NPP VIIRS True Color image at 2104 UTC [click to enlarge]](https://cimss.ssec.wisc.edu/satellite-blog/wp-content/uploads/sites/5/2018/11/181109_2104utc_suomiNPP_viirs_truecolor_SoCal_smoke.jpg)
![NOAA-20 VIIRS True Color image at 2154 UTC [click to enlarge]](https://cimss.ssec.wisc.edu/satellite-blog/wp-content/uploads/sites/5/2018/11/181109_2154utc_noaa20_viirs_truecolor_SoCal_smoke.jpg)
![Suomi NPP VIIRS True Color RGB and Aerosol Optical Depth [click to enlarge]](https://cimss.ssec.wisc.edu/satellite-blog/wp-content/uploads/sites/5/2018/11/181109_2104utc_suomiNPP_viirs_truecolor_aerosolOpticalDepth_anim.gif)
![Suomi NPP VIIRS True Color RGB image at 2029 UTC [click to enlarge]](https://cimss.ssec.wisc.edu/satellite-blog/wp-content/uploads/sites/5/2018/11/181111_2029utc_suomiNPP_viirs_truecolor_SoCal.jpg)
![NOAA-20 VIIRS True Color RGB image at 2114 UTC [click to enlarge]](https://cimss.ssec.wisc.edu/satellite-blog/wp-content/uploads/sites/5/2018/11/181111_2114utc_noaa20_viirs_truecolor_SoCal.jpg)
![GOES-16 "Red" Visible (0.64 µm) images, with hourly surface weather type plotted in yellow [click to play MP4 animation]](https://cimss.ssec.wisc.edu/satellite-blog/wp-content/uploads/sites/5/2018/11/G16_VIS_GLM_FLASHES_DLH_LES_09NOV2018_2018313_210155_GOES-16_0001PANEL.GIF)
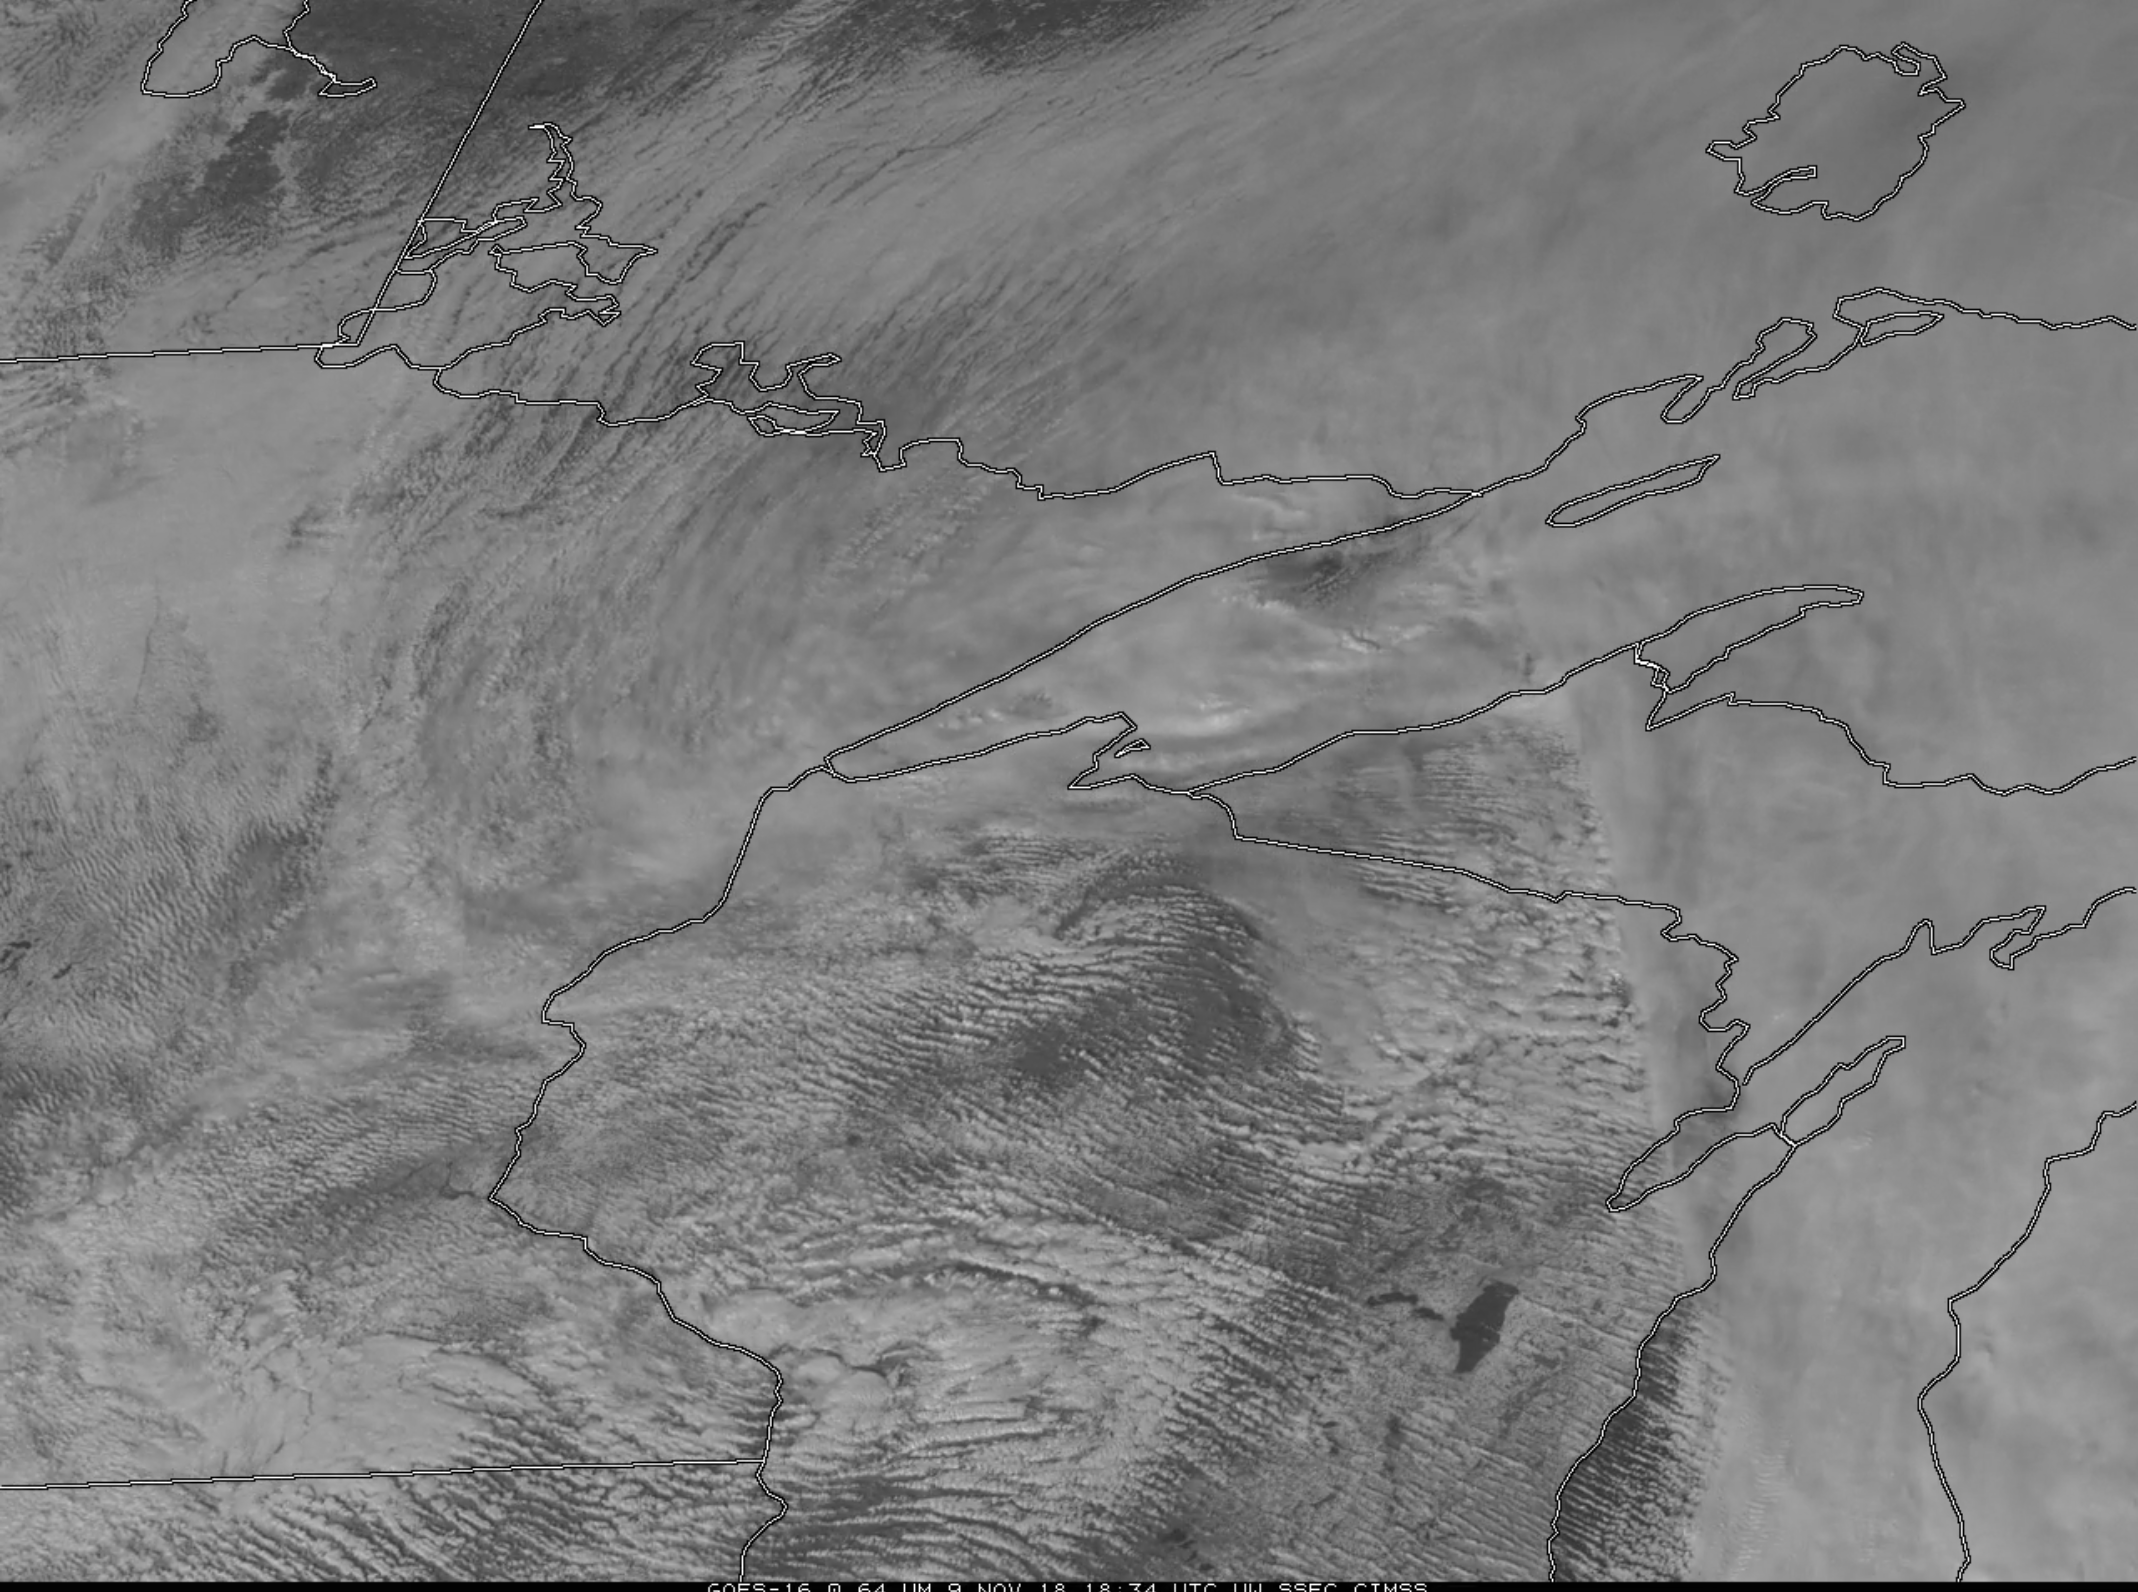
![Suomi NPP and NOAA-20 VIIRS Visible (0.64 µm) and Infrared Window (11.45 µm) images, with Topography [click to enlarge]](https://cimss.ssec.wisc.edu/satellite-blog/wp-content/uploads/sites/5/2018/11/181109_viirs_visible_infrared_Lake_Superior_anim.gif)
![Snow Depth at 12 UTC on 09 and 10 November, plus 24-hour snow accumulation ending at 12 UTC on 10 November [click to enlarge]](https://cimss.ssec.wisc.edu/satellite-blog/wp-content/uploads/sites/5/2018/11/181109_181110_snowdepth_snowfall_DLH_les_anim.gif)
![Suomi NPP VIIRS Shortwave Infrared (3.74 µm) images [click to play animation]](https://cimss.ssec.wisc.edu/satellite-blog/wp-content/uploads/sites/5/2018/11/181108_181111_viirs_shortwaveInfrared_Camp_Fire_CA_anim.gif)
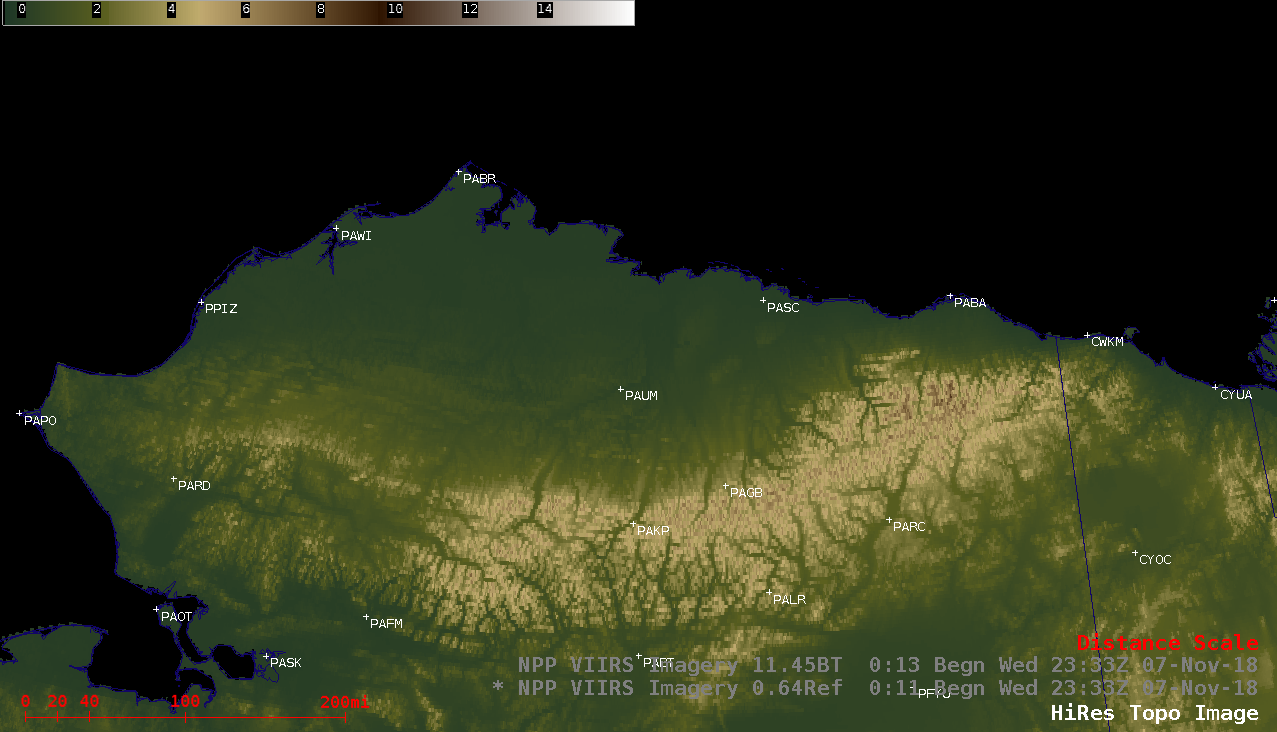
![Topography + Suomi NPP VIIRS Infrared Window (11.45 µm) images, with/without overlays of NAM12 250 hPa winds [click to play animation | MP4]](https://cimss.ssec.wisc.edu/satellite-blog/wp-content/uploads/sites/5/2018/11/181107_suomiNPP_viirs_infraredWindow_250winds_AK_banner_cloud_anim.gif)
![Suomi NPP VIIRS Shortwave Infrared (3.74 µm) and Infrared Window (11.45 µm) images [click to play animation | MP4]](https://cimss.ssec.wisc.edu/satellite-blog/wp-content/uploads/sites/5/2018/11/181107_suomiNPP_viirs_shortwaveInfrared_infraredWindow__AK_banner_cloud_anim.gif)
![GOES-15 Water Vapor (6.5 µm, top) and Infrared Window (10.7 µm, bottom) images [click to play animation | MP4]](https://cimss.ssec.wisc.edu/satellite-blog/wp-content/uploads/sites/5/2018/11/181107_goes15_waterVapor_infraredWindow_AK_banner_cloud_anim.gif)
