One interesting aspect of this 06 November 2018 mesoscale vortex (which was embedded within a stratus cloud deck) was the fact that a signature of the feature was evident in imagery from 15 of the 16 ABI spectral bands on GOES-16 (below) — only the 6.2 µm Upper-level Water Vapor images lacked even a subtle signal. The appearance of the vortex on 1.37 µm Near-Infrared “Cirrus” imagery was possible because the atmospheric column was very dry over that region (MODIS Total Precipitable Water values of 2-4 mm or 0.08-0.16 inch, and 0.31 inch on the 12 UTC Aberdeen SD sounding), so there was very little attenuation of upwelling 1.37 µm radiation by middle/upper-tropospheric water vapor.
![16-panel comparison of GOES-16 ABI spectral bands [click to play animation | MP4]](https://cimss.ssec.wisc.edu/satellite-blog/wp-content/uploads/sites/5/2018/11/nd_16panel-20181106_163718.png)
16-panel comparison of GOES-16 ABI spectral bands [click to play animation | MP4]
Closer views of GOES-16 “Red” Visible (
0.64 µm), Near-Infrared “Snow/Ice” (
1.61 µm) and Low-level Water Vapor (
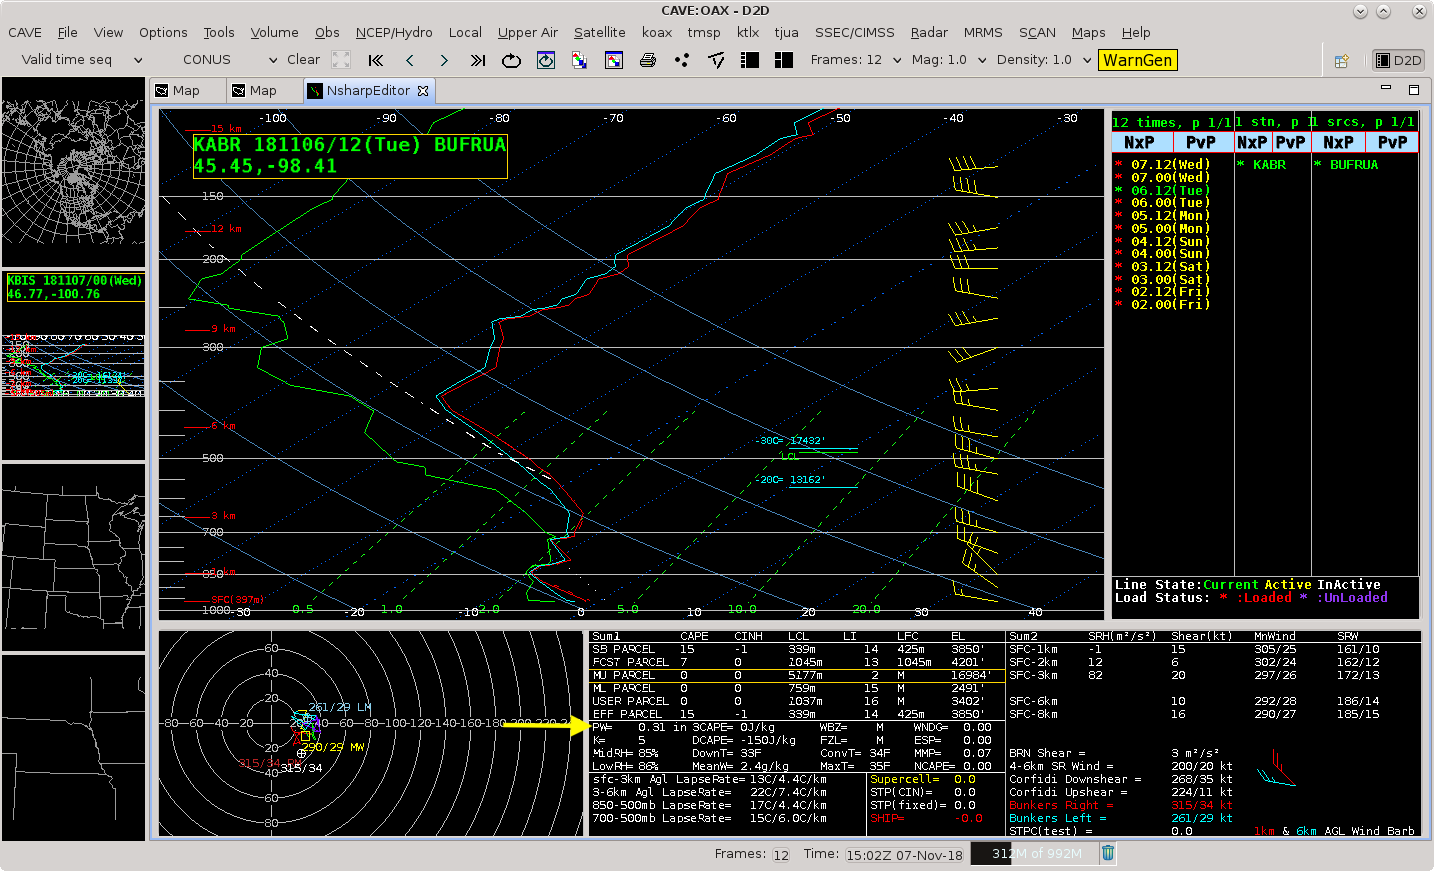
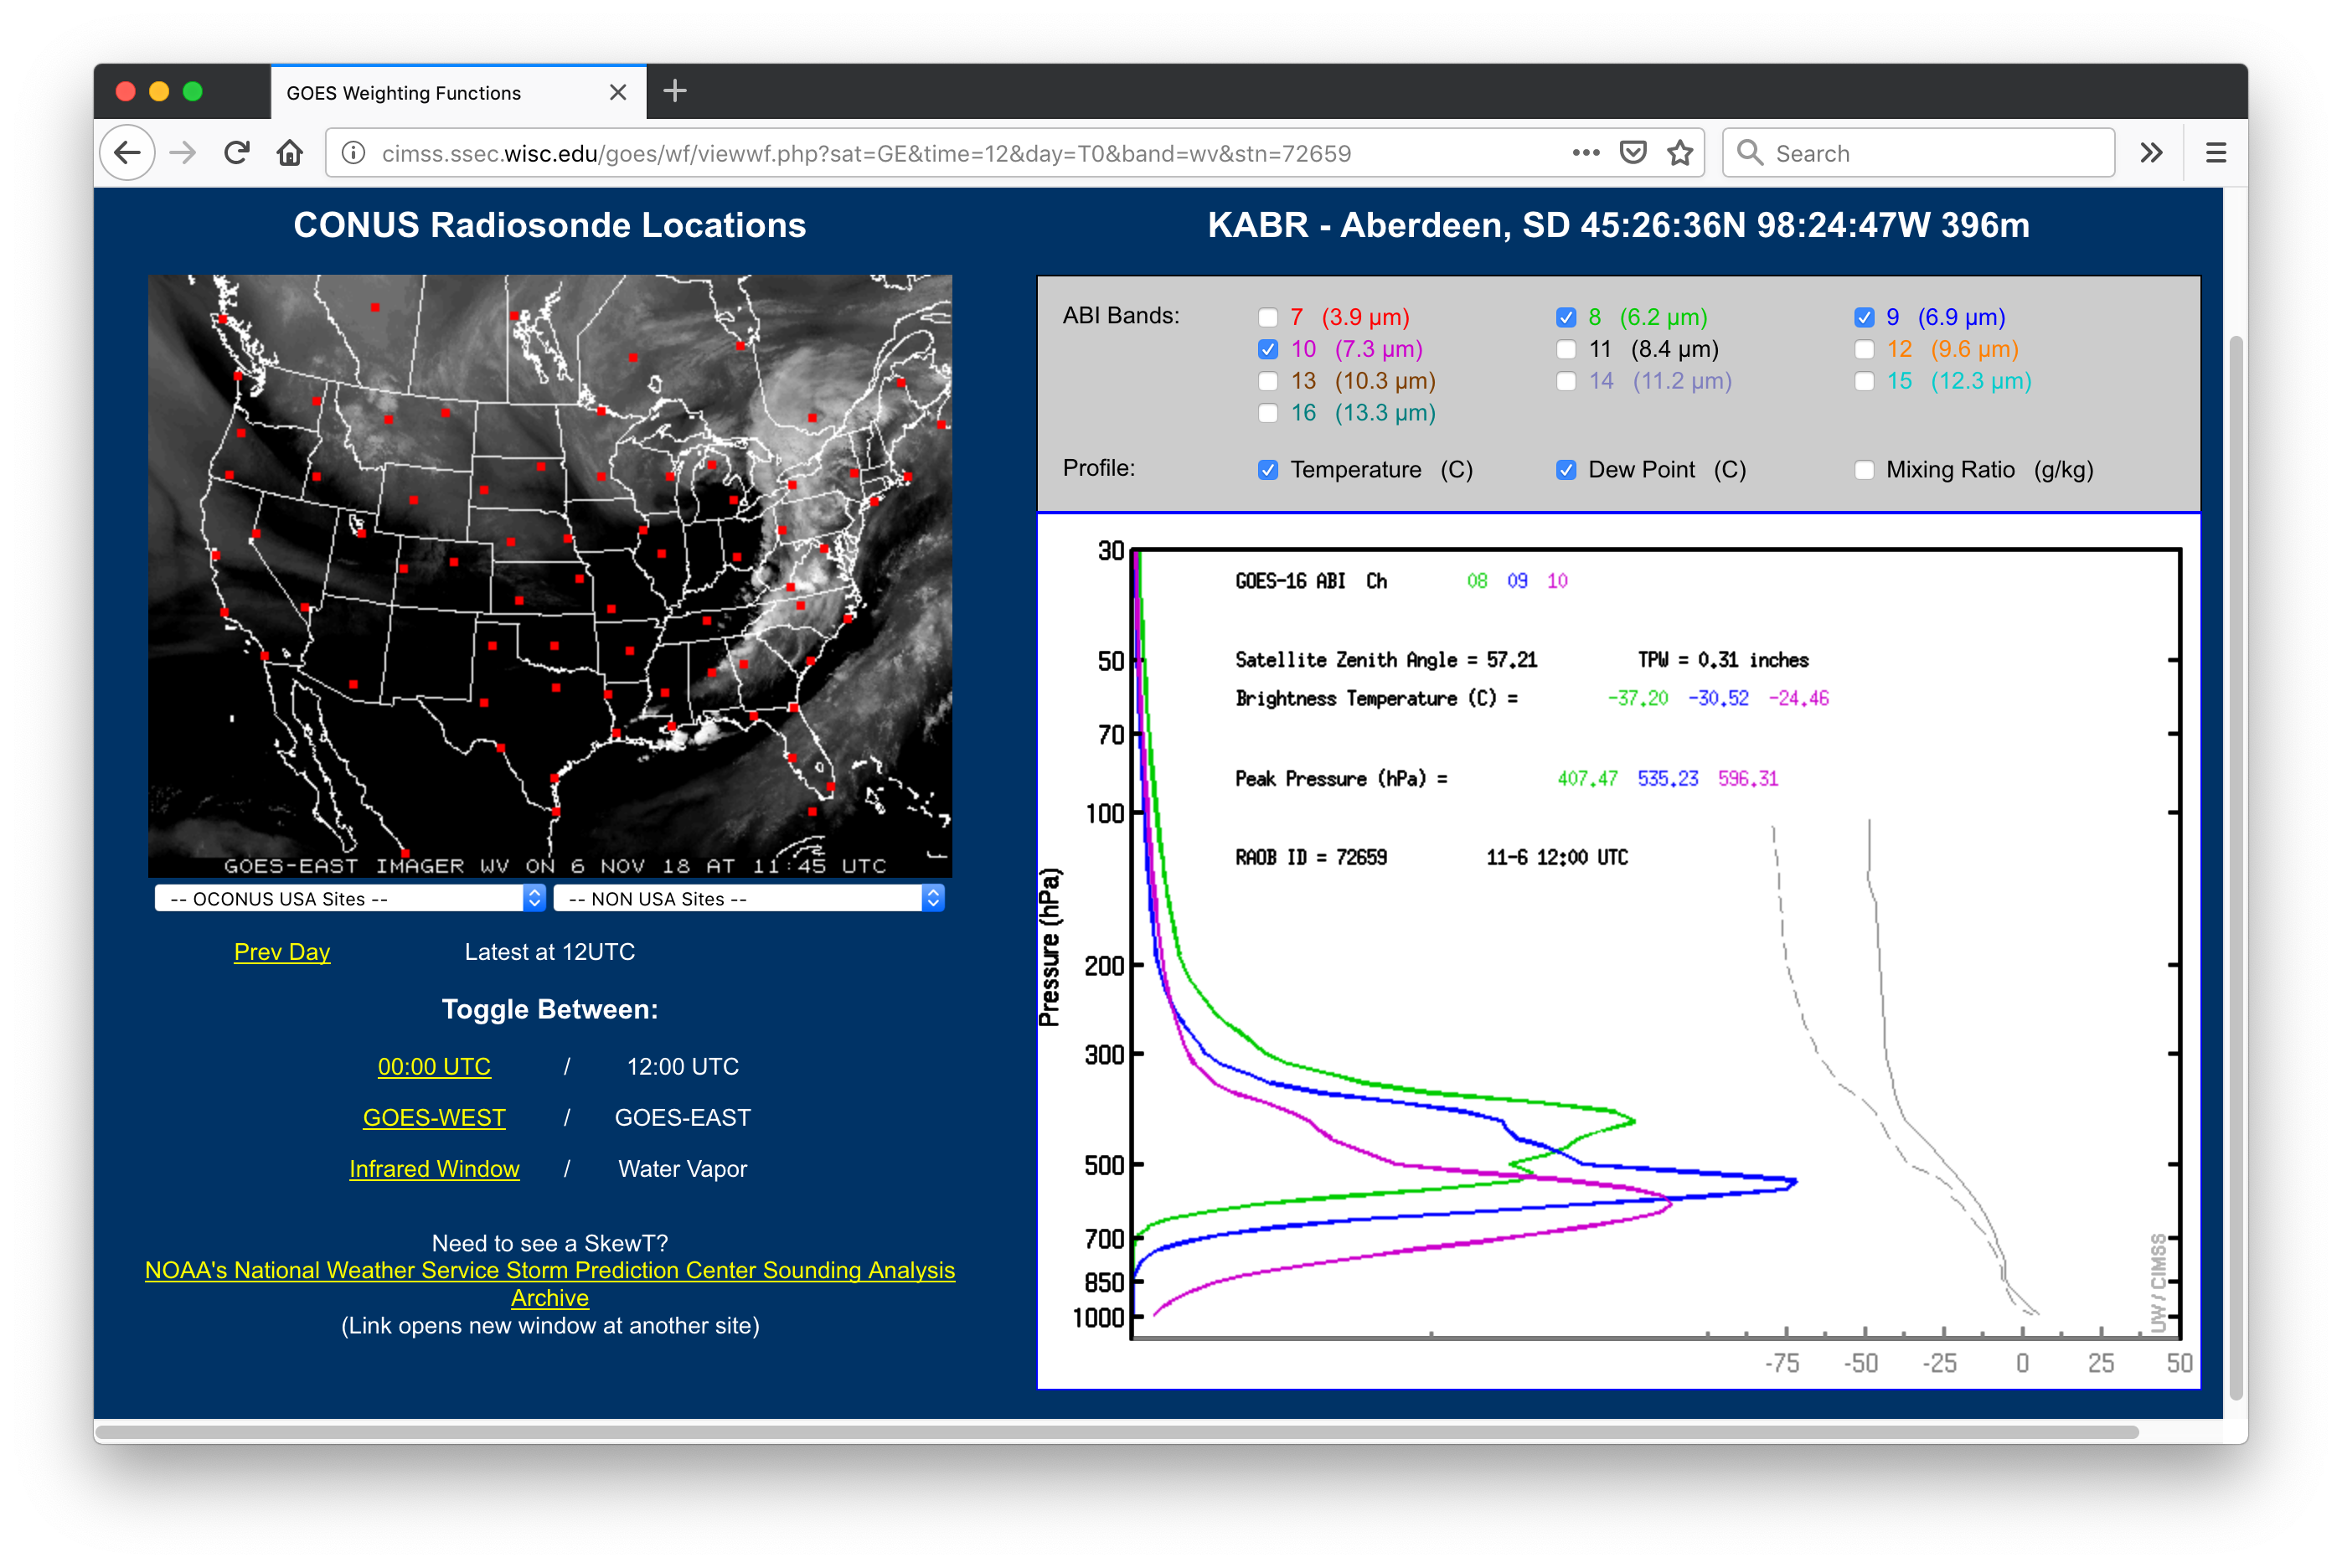
7.3 µm) images are shown below. The dry air aloft also shifted the altitude of the GOES-16 Water Vapor band
weighting functions to lower altitudes — calculated using 12 UTC rawinsonde data from
Aberdeen SD, the 7.3 µm Low-level Water Vapor weighting function peaked near 600 hPa, with significant contributions from as low as the 700 hPa level.
GOES-16 “Red” Visible (0.64 µm, left), Near-Infrared “Snow/Ice” (1.61 µm, center) and Low-level Water Vapor (7.3 µm, right) images [click to play animation | MP4]
A sequence of Terra/Aqua MODIS and NOAA-20/Suomi NPP VIIRS legacy “fog/stratus” Brightness Temperature Difference (BTD) images
(below) indicated that the vortex formed about 40 miles northwest of Devils Lake (KDVL) sometime between 0438 UTC and 0805 UTC (10:38 PM and 2:05 AM local time). An AWIPS-1 version of the animation is available
here.
![Fog/sratus infrared Brightness Temperature Difference images from Terra/Aqua MODIS and NOAA-20/Suomi NPP VIIRS [click to enlarge | MP4]](https://cimss.ssec.wisc.edu/satellite-blog/wp-content/uploads/sites/5/2018/11/181106_modis_viirs_fogBTD_ND_vortex_anim.gif)
Fog/sratus infrared Brightness Temperature Difference images from Terra/Aqua MODIS and NOAA-20/Suomi NPP VIIRS [click to enlarge | MP4]
The stratus clouds surrounding the vortex could be further characterized using a variety of GOES-16 channel difference and derived products as shown below.
![GOES-16 Split Cloud Top Phase (11.2 - 8.4 µm) product [click to play animation | MP4]](https://cimss.ssec.wisc.edu/satellite-blog/wp-content/uploads/sites/5/2018/11/nd_split_phase-20181106_163718.png)
GOES-16 Split Cloud Top Phase (11.2 – 8.4 µm) product [click to play animation | MP4]
The
Split Cloud Top Phase (
11.2 µm –
8.4 µm) product
(above) allowed this feature to be followed during darkness and daylight. It initially became apparent in GOES-16 imagery near Devils Lake shortly after 11 UTC or 5 AM local time, then traveled southeastward to the southeastern corner of the state before beginning to lose definition after 20 UTC or 2 PM local time. Positive values of this infrared BTD product
(shades of blue to cyan) highlight water droplet clouds, while negative BTD values
(shades of violet) indicate clouds composed of ice crystals.
![GOES-16 Cloud Particle Size Distribution product [click to play animation | MP4]](https://cimss.ssec.wisc.edu/satellite-blog/wp-content/uploads/sites/5/2018/11/nd_size_dist-20181106_180218.png)
GOES-16 Cloud Particle Size Distribution product [click to play animation | MP4]
The
Cloud Particle Size Distribution derived product
(above) uses Visible and Near-Infrared bands, so is only created during daylight hours — and only for solar zenith angles of 65º or less, which meant only for a few hours over much of North Dakota with the low sun angle of early November. The product showed a tongue of smaller cloud-top particles
(darker blue to violet enhancement) wrapping cyclonically into the center of the feature during the day.
![GOES-16 Cloud Top Phase product [click to play animation | MP4]](https://cimss.ssec.wisc.edu/satellite-blog/wp-content/uploads/sites/5/2018/11/nd_phase-20181106_163718.png)
GOES-16 Cloud Top Phase product [click to play animation | MP4]
The
Cloud Top Phase product
(above) indicated that the vortex and surrounding stratus cloud deck were composed of supercooled water droplets
(lighter green enhancement).
![GOES-16 Cloud Top Height product [click to play animation | MP4]](https://cimss.ssec.wisc.edu/satellite-blog/wp-content/uploads/sites/5/2018/11/nd_height-20181106_163718.png)
GOES-16 Cloud Top Height product [click to play animation | MP4]
The
Cloud Top Height product
(above) showed that the vortex and surrounding stratus clouds had tops generally in the 12,000-14,000 feet range
(darker shades of blue).
![Terra and Aqua MODIS Visible (0.65 µm), Cirrus (1.37 µm), Snow/Ice (1.61 µm) and Infrared Window (11.0 µm) at 1816 UTC and 1955 UTC [click to enlarge | MP4]](https://cimss.ssec.wisc.edu/satellite-blog/wp-content/uploads/sites/5/2018/11/181106_modis_visible_cirrus_snowIce_infraredWindow_ND_anim.gif)
Terra and Aqua MODIS Visible (0.65 µm), Cirrus (1.37 µm), Snow/Ice (1.61 µm) and Infrared Window (11.0 µm) at 1816 UTC and 1955 UTC [click to enlarge | MP4]
Comparisons of Terra and Aqua MODIS Visible (0.65 µm), Cirrus (1.37 µm), Snow/Ice (1.61 µm) and Infrared Window (11.0 µm) at 1816 UTC and 1955 UTC are shown above — and comparisons of VIIRS Visible (0.64 µm), Snow/Ice (1.61 µm) and Infrared Window (11.45 µm) images from Suomi NPP at 1841 UTC and 2020 UTC along with NOAA-20
(incorrectly labeled as Suomi NPP) at 1941 UTC are shown below. Infrared Window brightness temperatures from both MODIS and VIIRS were in the -20º to -25ºC range
(cyan to light blue enhancement) within and adjacent to the vortex.
![Suomi NPP VIIRS Visible (0.64 µm), Snow/Ice (1.61 µm) and Infrared Window (11.45 µm) images at 1841 UTC, 1941 UTC and 2020 UTC [click to enlarge | MP4]](https://cimss.ssec.wisc.edu/satellite-blog/wp-content/uploads/sites/5/2018/11/181106_viirs_visible_snowIce_infraredWindow_ND_anim.gif)
Suomi NPP VIIRS Visible (0.64 µm), Snow/Ice (1.61 µm) and Infrared Window (11.45 µm) images at 1841 UTC, 1941 UTC and 2020 UTC [click to enlarge | MP4]
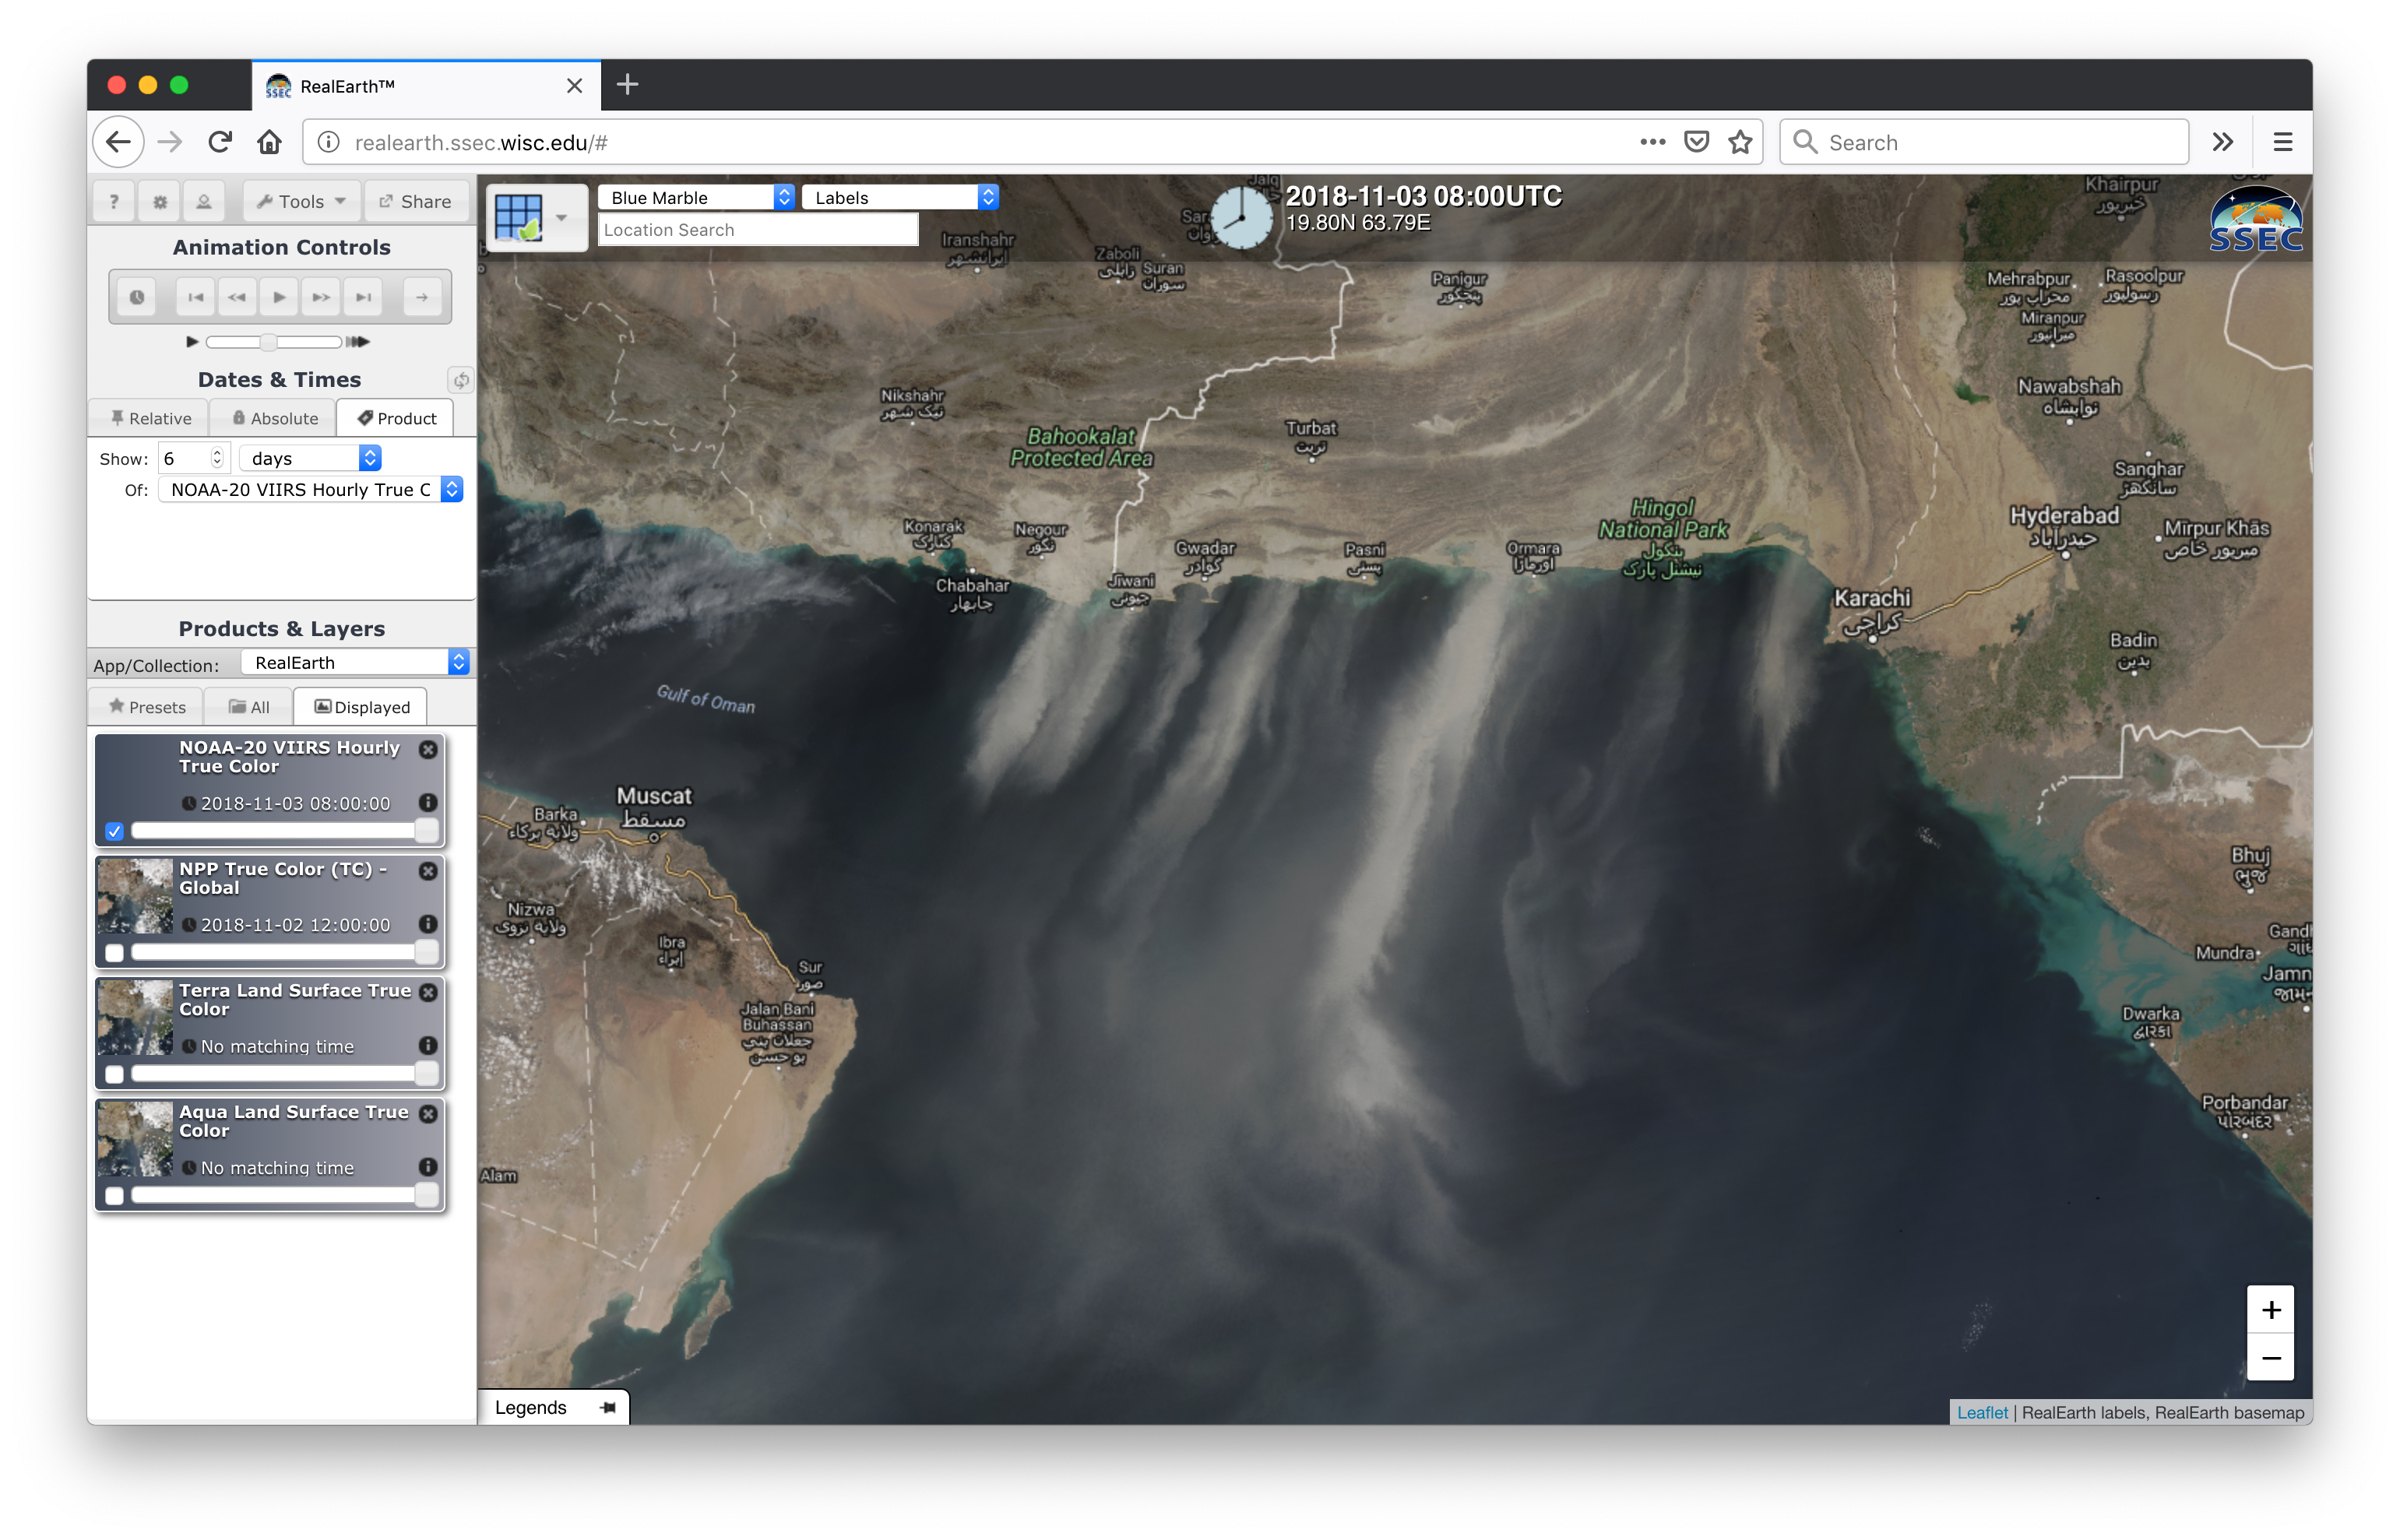
A closer view was provided by a sequence of True Color and False Color Red-Green-Blue (RGB) images from Terra/Aqua MODIS and Suomi NPP VIIRS as visualized using
RealEarth (below).
![True Color and False Color RGB images from Terra/Aqua MODIS and Suomi NPP VIIRS [click to play animation]](https://cimss.ssec.wisc.edu/satellite-blog/wp-content/uploads/sites/5/2018/11/181106_1848utc_snpp_viirs_tc.jpg)
True Color and False Color RGB images from Terra/Aqua MODIS and Suomi NPP VIIRS [click to play animation]
The mesoscale vortex — whose diameter was only about 20-30 miles — formed within cyclonic boundary layer flow about 100 miles south of an advancing cold front
(below).
![Terra MODIS Visible (0.65 µm) image with aurface analysis of pressure and fronts [click to enlarge]](https://cimss.ssec.wisc.edu/satellite-blog/wp-content/uploads/sites/5/2018/11/nd_modis_vis_front-20181106_181600.png)
Terra MODIS Visible (0.65 µm) image with aurface analysis of pressure and fronts [click to enlarge]
One potential forcing mechanism could have been a lobe of 700 hPa vorticity which was about 30 miles upstream of the vortex at 12 UTC and 18 UTC, according to the NAM12 model
(below).
![GOES-16 Split Cloud Top Phase (11.2 - 8.4 µm) product at 1202 and 1802 UTC, with overlays of NAM12 700 hPa vorticity [click to enlarge]](https://cimss.ssec.wisc.edu/satellite-blog/wp-content/uploads/sites/5/2018/11/181106_goes16_cloud_top_phase_700hPa_vorticity_ND_anim.gif)
GOES-16 Split Cloud Top Phase (11.2 – 8.4 µm) product at 1202 and 1802 UTC, with overlays of NAM12 model 700 hPa vorticity [click to enlarge]
[Note: AWIPS color enhancements that differ from the defaults were used for some of the GOES-16 images and products shown here, to better highlight the subtle vortex feature]
View only this post
Read Less

![16-panel comparison of GOES-16 ABI spectral bands [click to play animation | MP4]](https://cimss.ssec.wisc.edu/satellite-blog/wp-content/uploads/sites/5/2018/11/181106_goes16_16panel_ND_vortex_anim.gif)

![GOES-16 Split Cloud Top Phase (11.2 - 8.4 µm) product [click to play animation | MP4]](https://cimss.ssec.wisc.edu/satellite-blog/wp-content/uploads/sites/5/2018/11/181106_goes16_split_phase_ND_anim.gif)
![GOES-16 Cloud Particle Size Distribution product [click to play animation | MP4]](https://cimss.ssec.wisc.edu/satellite-blog/wp-content/uploads/sites/5/2018/11/181106_goes16_cloud_particle_size_distribution_ND_anim.gif)
![GOES-16 Cloud Top Phase product [click to play animation | MP4]](https://cimss.ssec.wisc.edu/satellite-blog/wp-content/uploads/sites/5/2018/11/181106_goes16_cloud_top_phase_ND_anim.gif)
![GOES-16 Cloud Top Height product [click to play animation | MP4]](https://cimss.ssec.wisc.edu/satellite-blog/wp-content/uploads/sites/5/2018/11/181106_goes16_cloud_top_height_ND_anim.gif)
![True Color and False Color RGB images from Terra/Aqua MODIS and Suomi NPP VIIRS [click to play animation]](https://cimss.ssec.wisc.edu/satellite-blog/wp-content/uploads/sites/5/2018/11/181106_modis_viirs_truecolor_falsecolor_ND_vortex_anim.gif)
![Sequence of daily True Color RGB images from Terra MODIS, Aqua MODIS and Suomi NPP VIIRS, covering the period 01-03 November [click to play animation]](https://cimss.ssec.wisc.edu/satellite-blog/wp-content/uploads/sites/5/2018/11/181101_181103_terra_aqua_modis_suomiNPP_viirs_Arabian_Sea_dust_anim.gif)
![Comparison of True Color RGB images from Terra MODIS, NOAA-20 VIIRS, Suomi NPP VIIRS and Aqua MODIS on 03 November [click to play animation]](https://cimss.ssec.wisc.edu/satellite-blog/wp-content/uploads/sites/5/2018/11/181103_modis_viirs_Arabian_Sea_dust_anim.gif)
![Meop ASCAT surface scatteromete winds [click to enlarge]](https://cimss.ssec.wisc.edu/satellite-blog/wp-content/uploads/sites/5/2018/11/181103_ascat_Arabian_Sea_anim.gif)
![Meteosat-11 Visible (0.8 µm) images [click to play animation | MP4]](https://cimss.ssec.wisc.edu/satellite-blog/wp-content/uploads/sites/5/2018/11/181102_meteosat11_visible_Arabian_Sea_dust_anim.gif)
![Meteosat-11 Visible (0.8 µm) images on 03 November [click to play animation | MP4]](https://cimss.ssec.wisc.edu/satellite-blog/wp-content/uploads/sites/5/2018/11/181103_meteosat11_visible_Arabian_Sea_dust_anim.gif)
![GOES-16 "Red" Visible (0.64 µm), Near-Infrared "Snow/Ice" (1.61 µm) and "Clean" Infrared Window (10.3 µm) images [click to enlarge]](https://cimss.ssec.wisc.edu/satellite-blog/wp-content/uploads/sites/5/2018/11/181103_1430utc_goes16_visible_nearInfrared_infraredWindow_SACO_AACP_anim.gif)
![GOES-16 "Red" Visible (0.64 µm), Near-Infrared "Snow/Ice" (1.61 µm) images [click to play animation | MP4]](https://cimss.ssec.wisc.edu/satellite-blog/wp-content/uploads/sites/5/2018/11/181103_goes16_visible_snowIce_Argentina_AACP_anim.gif)
![GOES-16 "Red" Visible (0.64 µm) and "Clean" Infrared Window (10.3 µm) images [click to play animation | MP4]](https://cimss.ssec.wisc.edu/satellite-blog/wp-content/uploads/sites/5/2018/11/181103_goes16_visible_infrared_Argentina_AACP_anim.gif)
![True Color RGB images from Terra MODIS (1457 UTC), Aqua MODIS (1736 UTC), Suomi NPP VIIRS (1742 UTC) and NOAA-20 VIIRS (1832 UTC) [click to enlarge]](https://cimss.ssec.wisc.edu/satellite-blog/wp-content/uploads/sites/5/2018/11/181103_modis_viirs_truecolor_SACO_anim.gif)
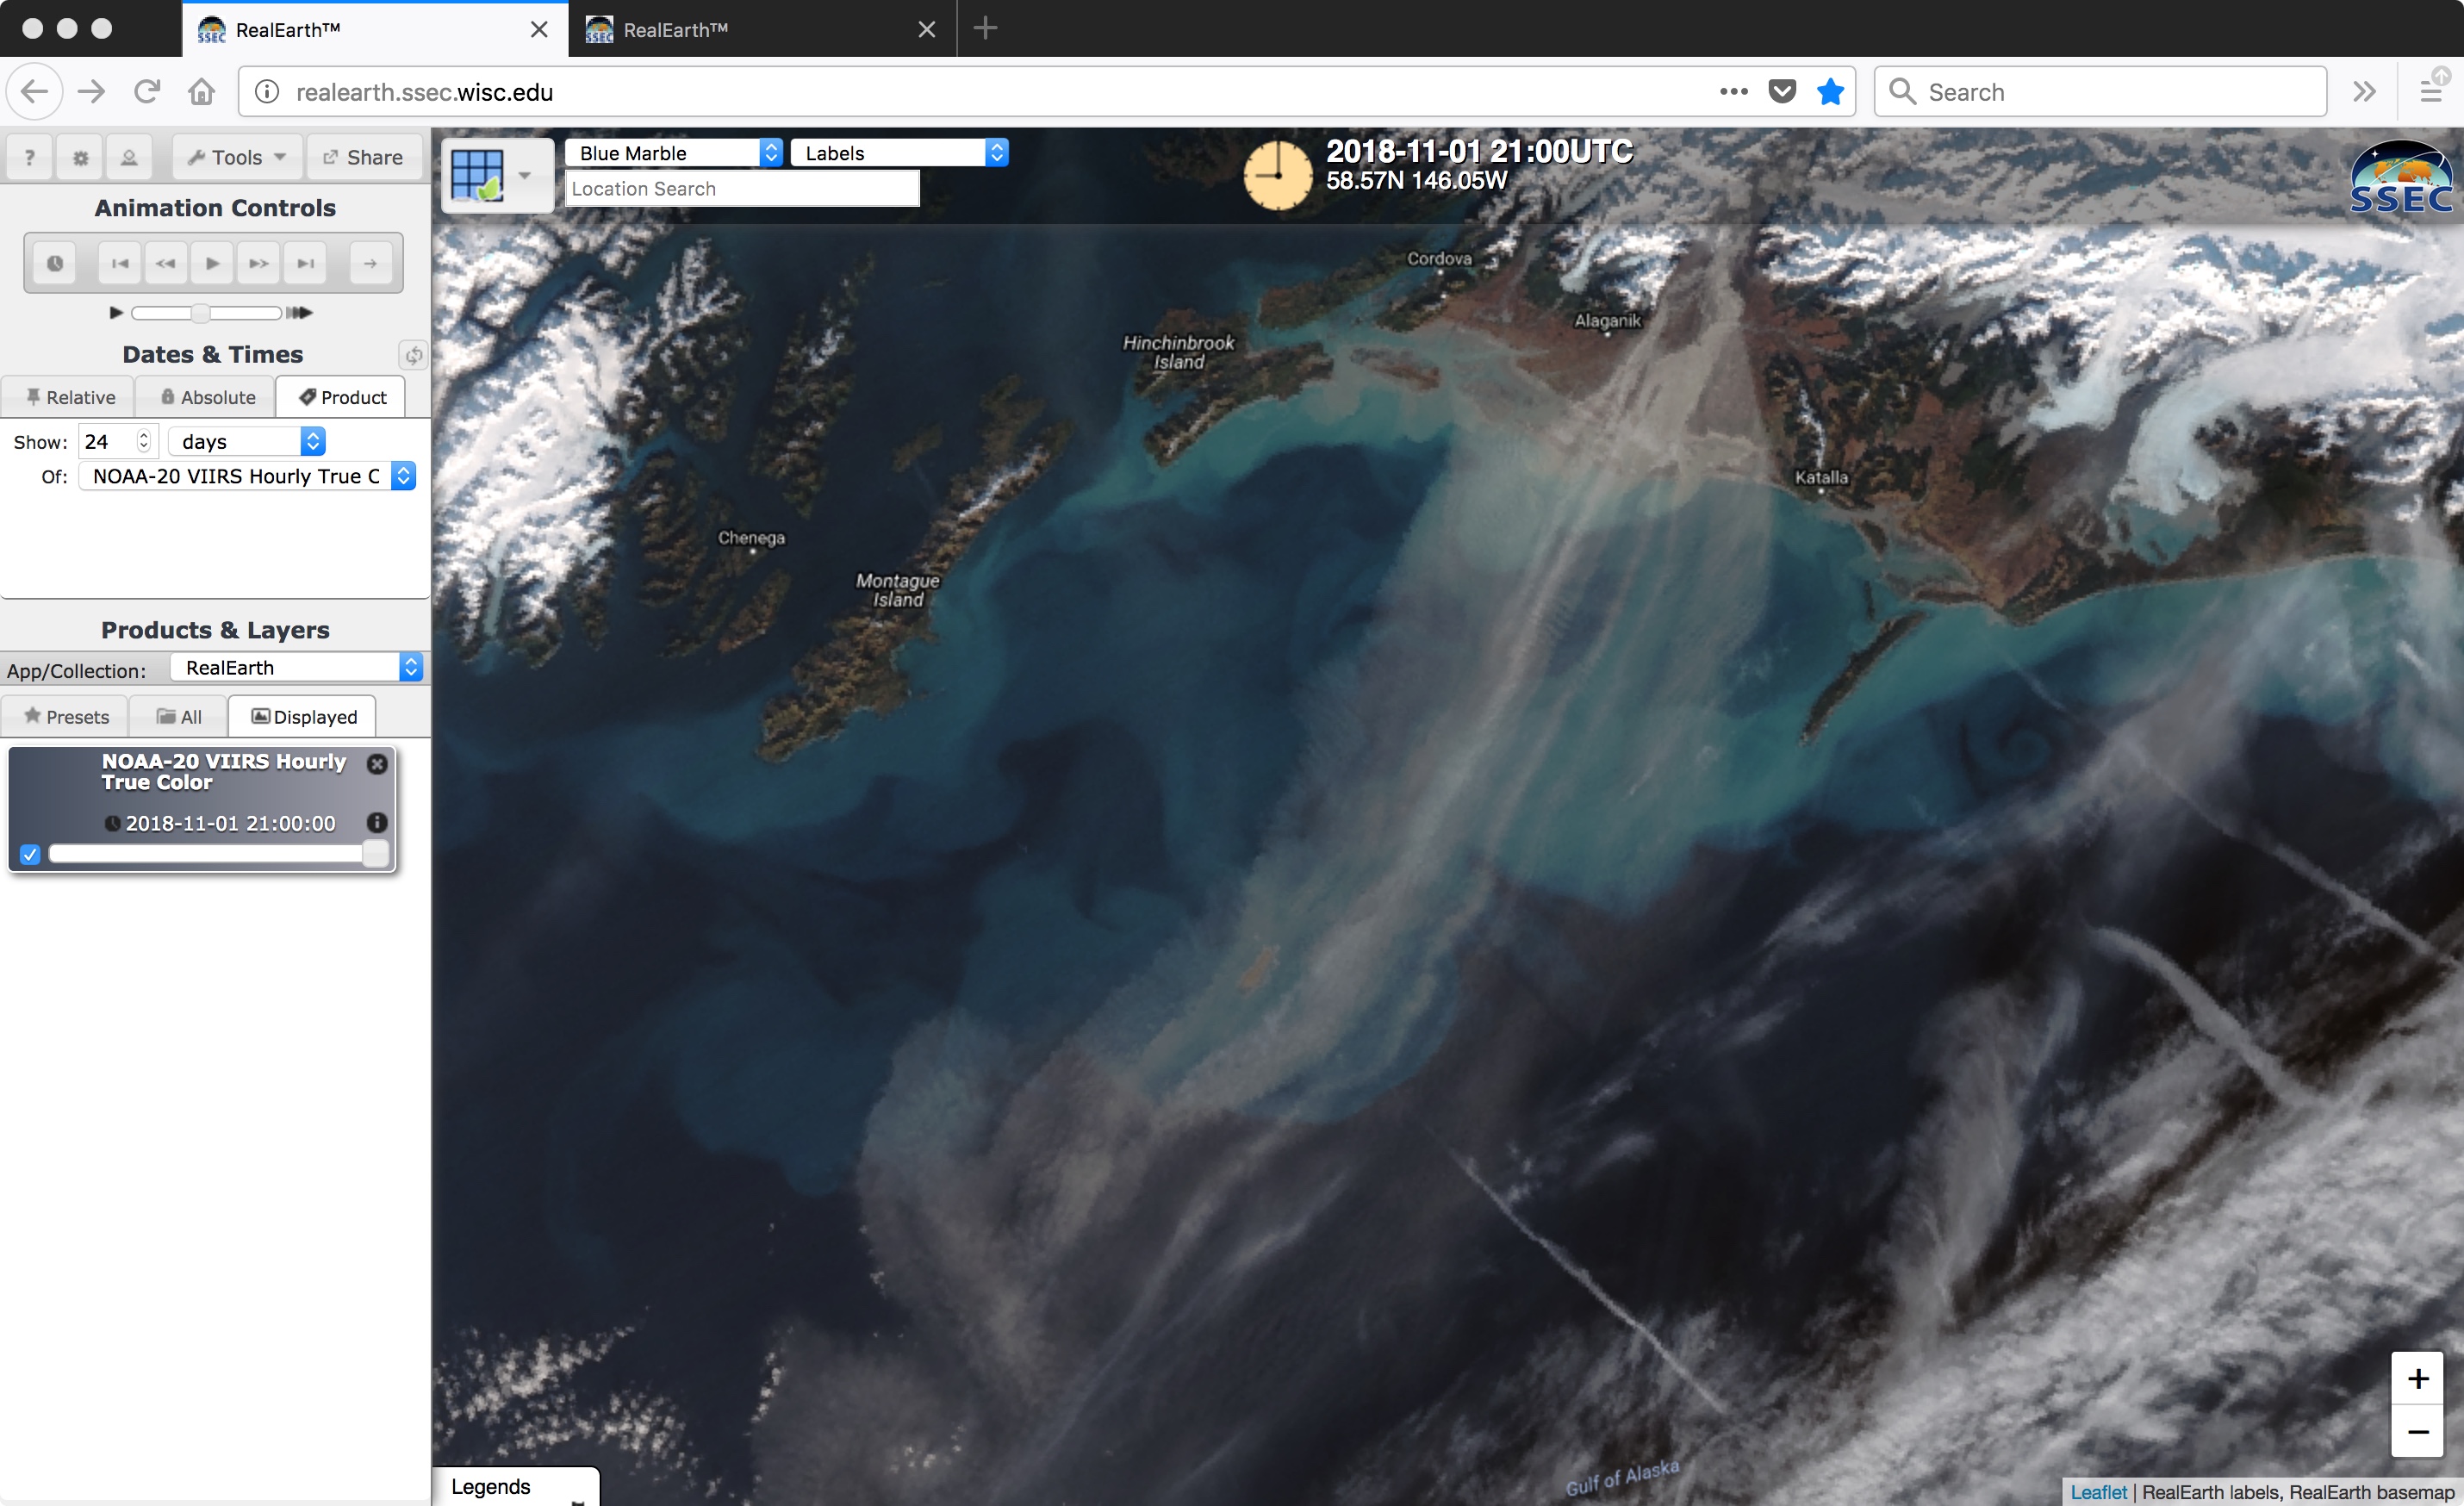
![NOAA-20 VIIRS True Color RGB images [click to enlarge]](https://cimss.ssec.wisc.edu/satellite-blog/wp-content/uploads/sites/5/2018/10/181031_181101_noaa20_viirs_truecolor_AK_dust_anim.gif)
![Suomi NPP VIIRS Visible (0.64 µm), Shortwave Infrared (3.74 µm) and Infrared Window (11.45 µm) images [click to enlarge]](https://cimss.ssec.wisc.edu/satellite-blog/wp-content/uploads/sites/5/2018/10/181101_2022utc_suomi_npp_viirs_visible_shortwaveInfrared_infraredWindow_AK_dust_anim.gif)
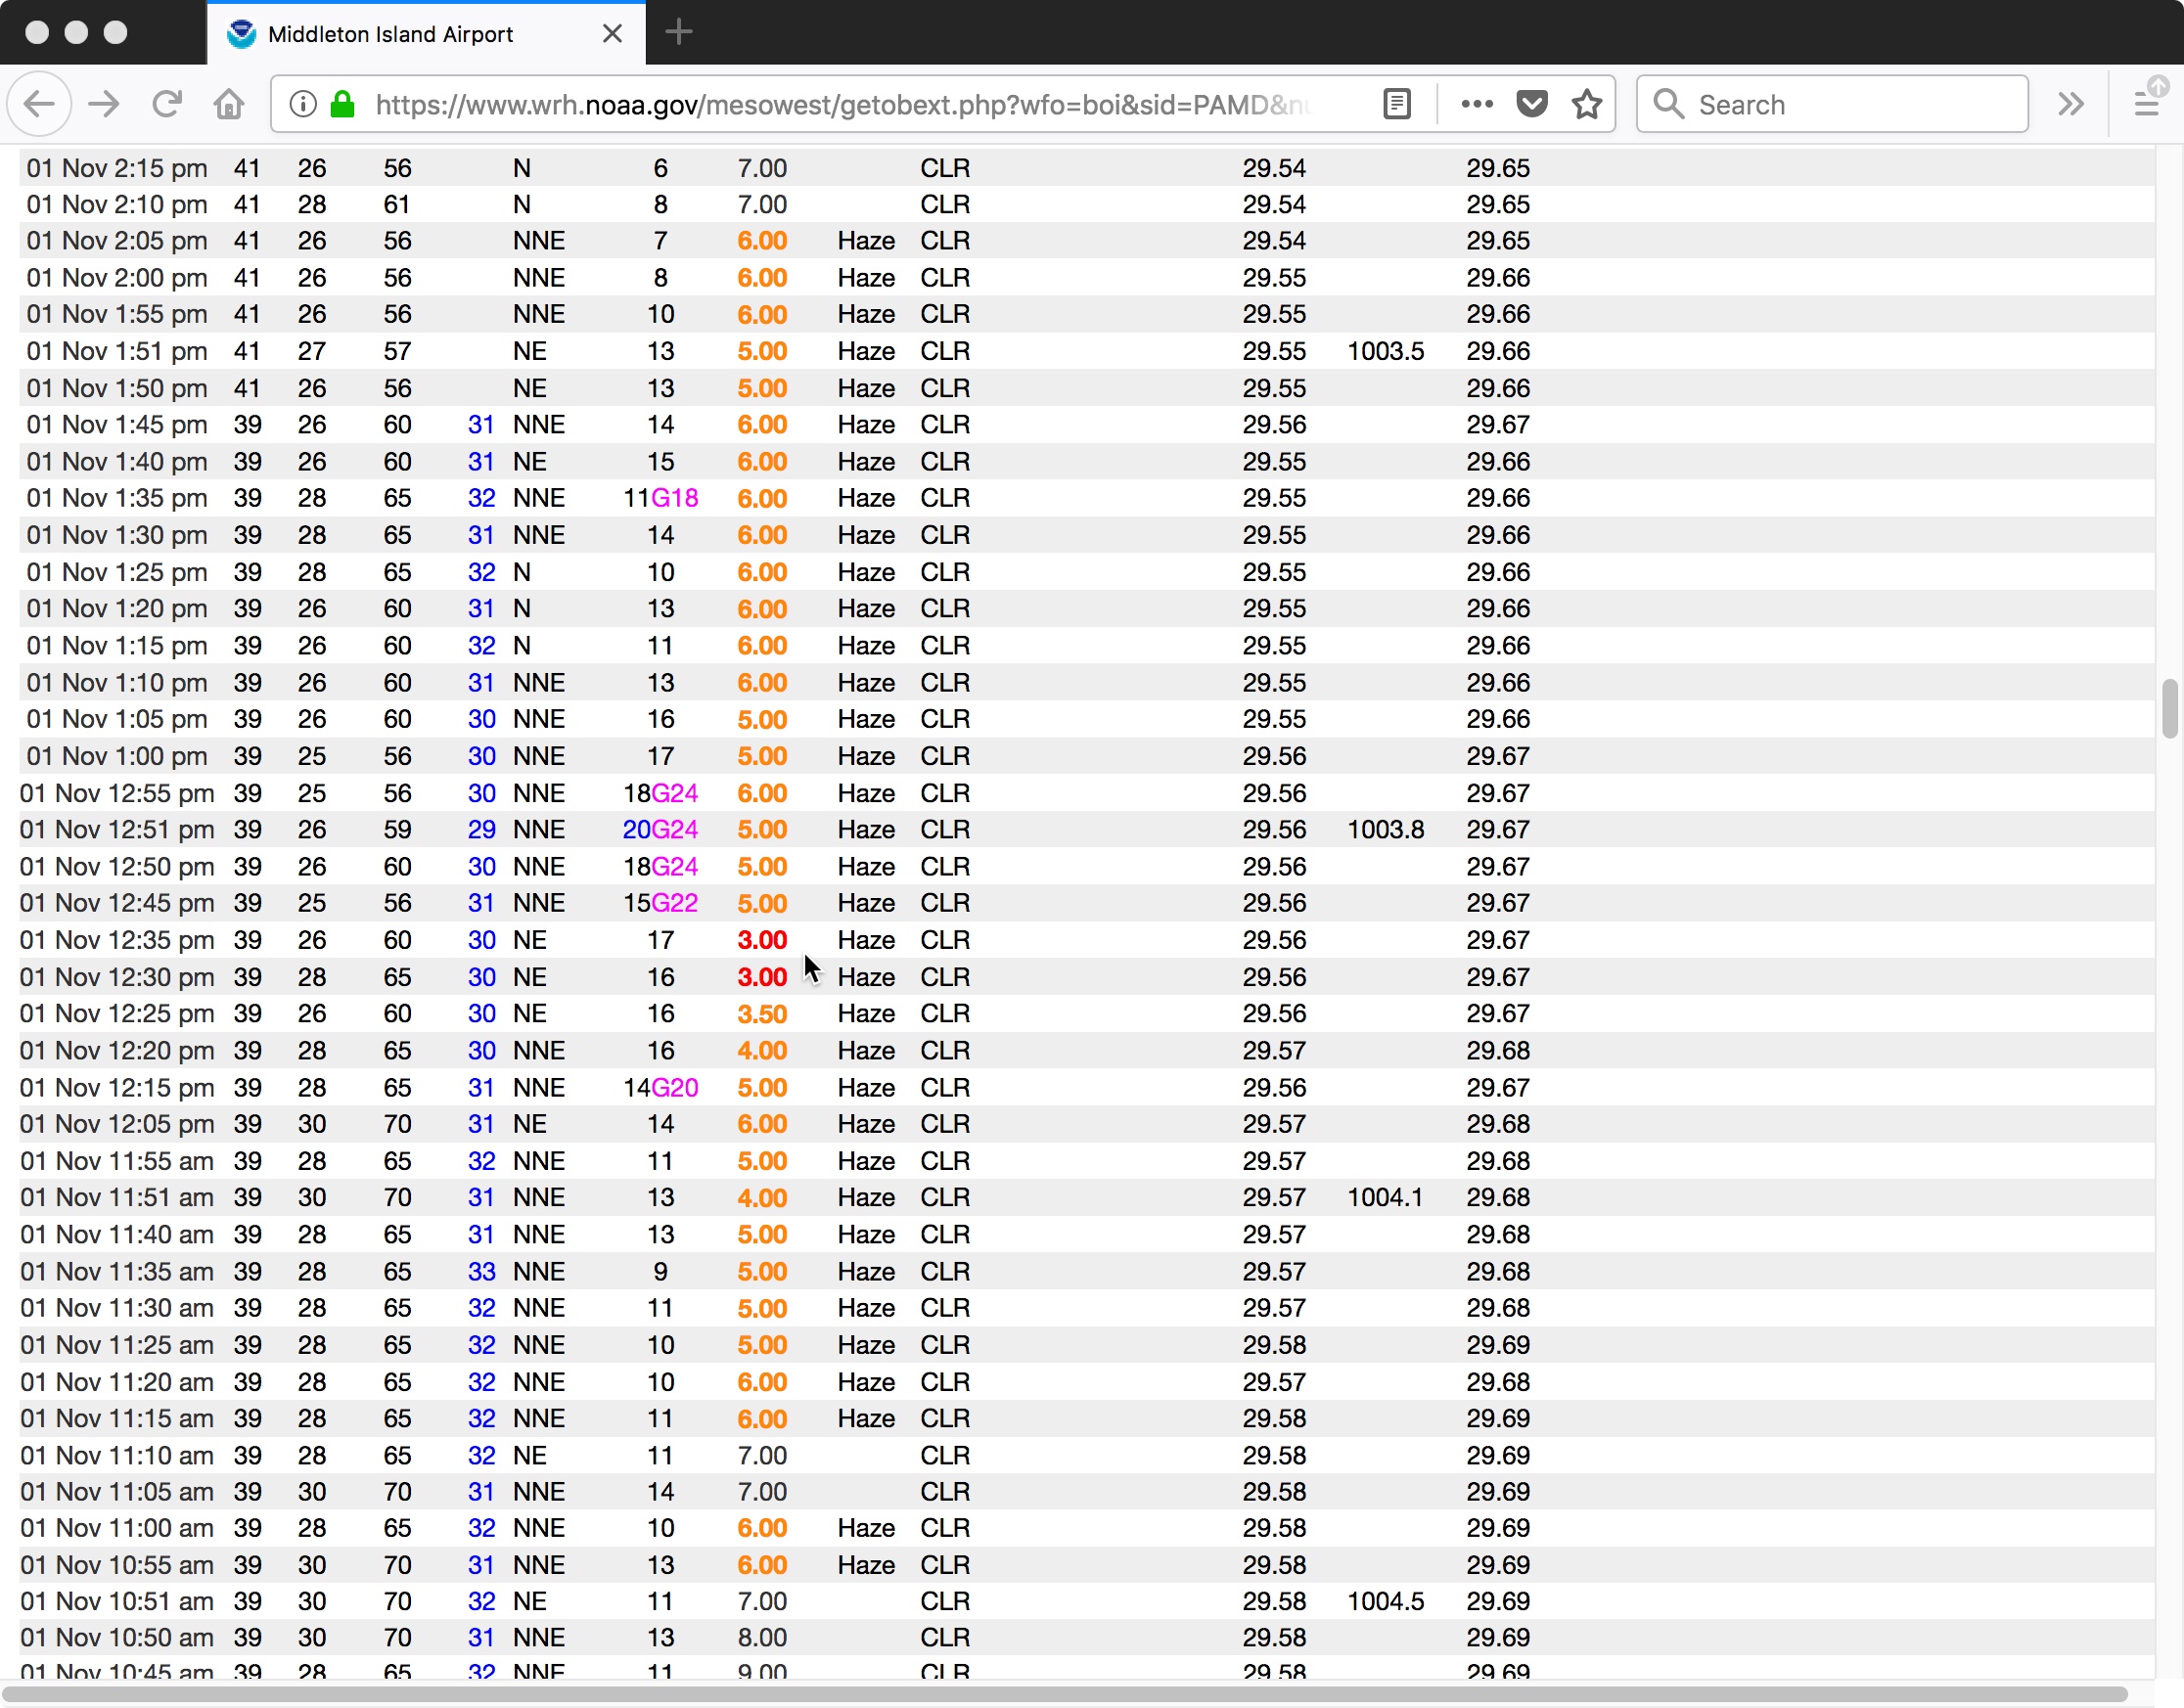
![Time series plot of surface observations at Middleton Island [click to enlarge]](https://cimss.ssec.wisc.edu/satellite-blog/wp-content/uploads/sites/5/2018/10/181101_PAMD_SFCMG.GIF)
![Metop-A and Metop-B ASCAT surface scatterometer winds [click to enlarge]](https://cimss.ssec.wisc.edu/satellite-blog/wp-content/uploads/sites/5/2018/11/181101_meteop_ascat_AK_dust_anim.gif)
![Suomi NPP VIIRS Visible (0.64 µm) and Infrared Brightness Temperature Difference (11-12 µm) images [click to enlarge]](https://cimss.ssec.wisc.edu/satellite-blog/wp-content/uploads/sites/5/2018/10/181101_2204utc_suomi_npp_viirs_visible_infraredBTD_AK_dust_anim.gif)
![VIIRS Aerosol Optical Thickness product [click to enlarge]](https://cimss.ssec.wisc.edu/satellite-blog/wp-content/uploads/sites/5/2018/10/181031_181101_viirs_aerosolOpticalThickness_AK_anim.gif)
![GOES-15 Visible (0.63 µm) images [click to play animation]](https://cimss.ssec.wisc.edu/satellite-blog/wp-content/uploads/sites/5/2018/10/181101_goes15_visible_AK_anim.gif)
