![GOES-17 Low-level Water Vapor (7.3 µm) images, plus topography [click to play animation | MP4]](https://cimss.ssec.wisc.edu/satellite-blog/wp-content/uploads/sites/5/2019/01/190118_goes17_waterVapor_Brooks_Range_AK_anim.gif)
GOES-17 Low-level Water Vapor (7.3 µm) images, plus topography [click to play animation | MP4]
* GOES-17 images shown here are preliminary and non-operational *
A comparison of GOES-17 Low-level Water Vapor (7.3 µm) images with topography (above) revealed that radiation being emitted by the higher elevations of the Brooks Range in northern Alaska was able to be sensed by the 7.3 µm detectors — in spite of the very large satellite viewing angle (or zenith angle) of around 75 degrees.
The GOES-17 ABI Water Vapor band weighting functions calculated using 12 UTC rawinsonde data from Fairbanks, Alaska (below) showed that the presence of cold, dry air within the middle to upper troposphere had shifted the peak pressure of the 7.3 µm weighting function downward to 753.63 hPa (corresponding to an altitude of 7053 feet) — which was at or below the elevation of much of the higher terrain of the Brooks Range. There was very little absorption of upwelling surface radiation by the small amount of water vapor that was present within the middle/upper troposphere, allowing the cold thermal signature of the higher terrain to be observed on the Water Vapor imagery.
![GOES-17 Water Vapor weighting functions calculated using 12 UTC rawinsonde data from Fairbanks [click to enlarge]](https://cimss.ssec.wisc.edu/satellite-blog/wp-content/uploads/sites/5/2019/01/190118_12utc_pafa_g17_wv_wf.png)
GOES-17 Water Vapor weighting functions calculated using rawinsonde data from Fairbanks, Alaska [click to enlarge]
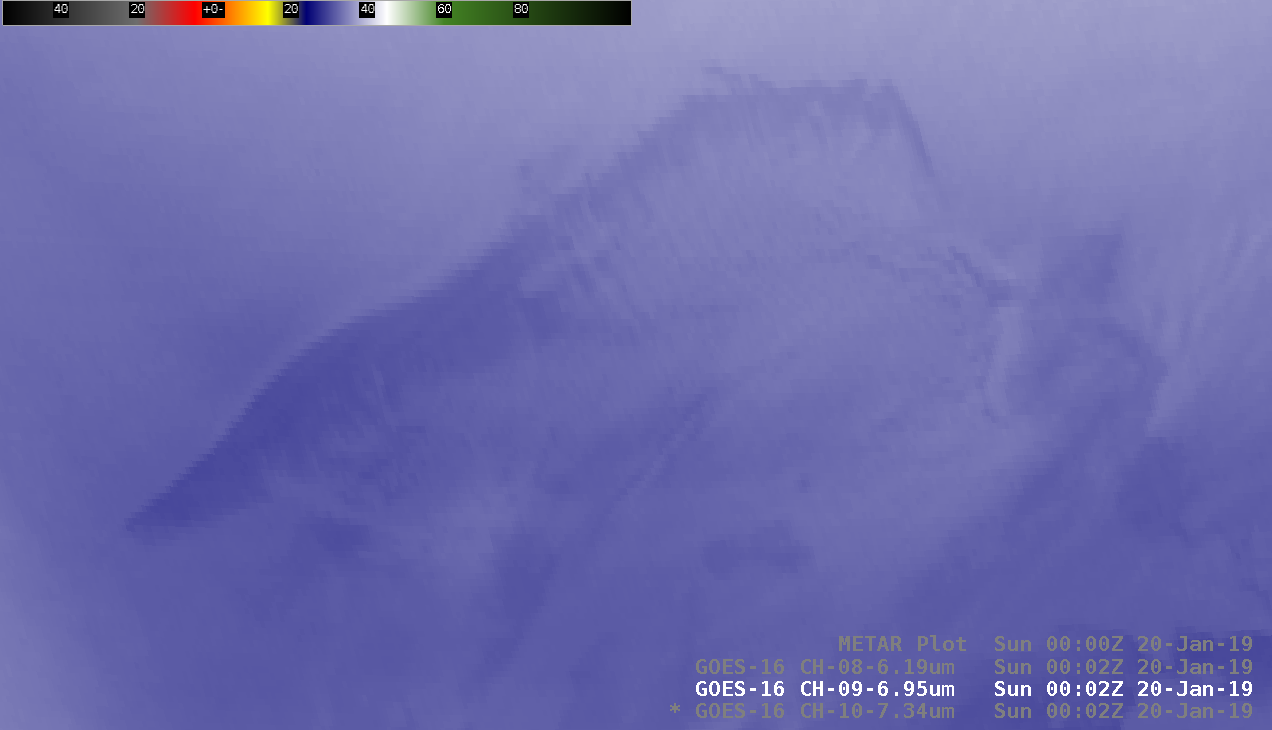
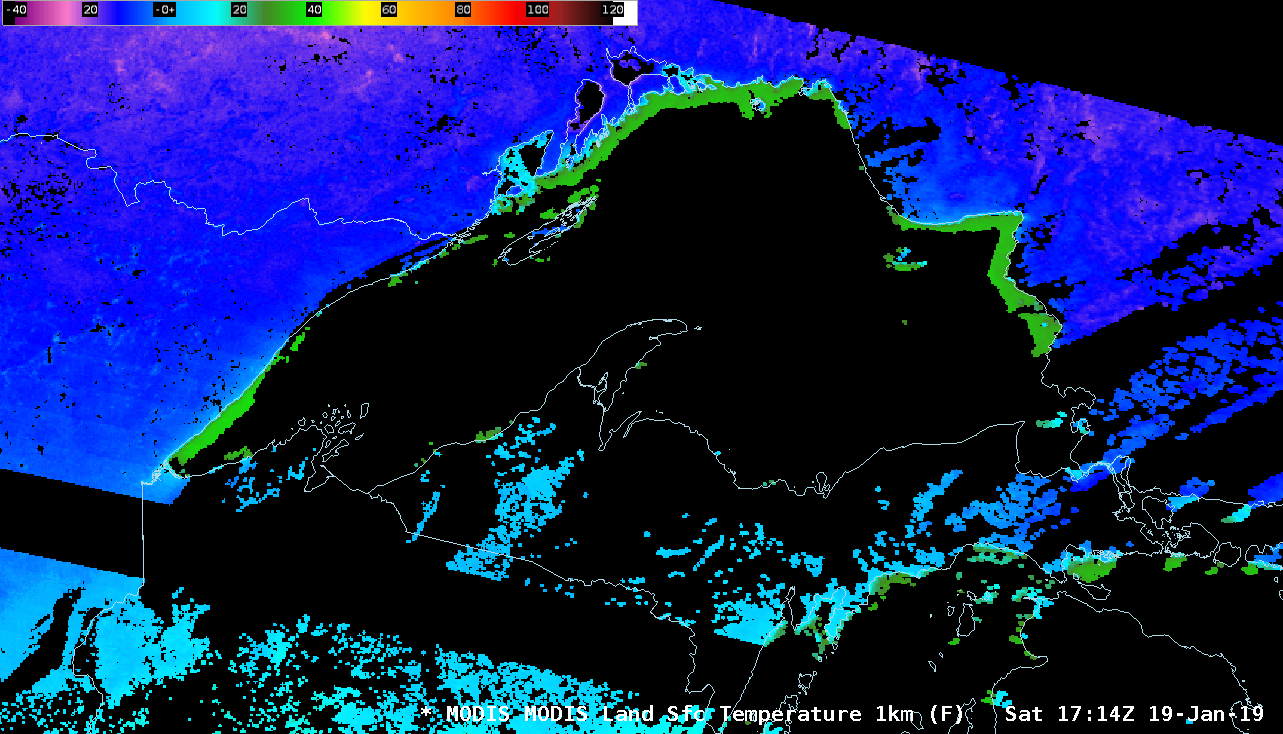
![GOES-16 Low-level (7.3 µm), and Mid-level (6.9 µm) and Upper-level (6.2 µm) Water Vapor images [click to play animation | MP4]](https://cimss.ssec.wisc.edu/satellite-blog/wp-content/uploads/sites/5/2019/01/190119_goes16_waterVapor_Lake_Superior_anim.gif)
GOES-16 Low-level (7.3 µm), and Mid-level (6.9 µm) and Upper-level (6.2 µm) Water Vapor images [click to play animation | MP4]
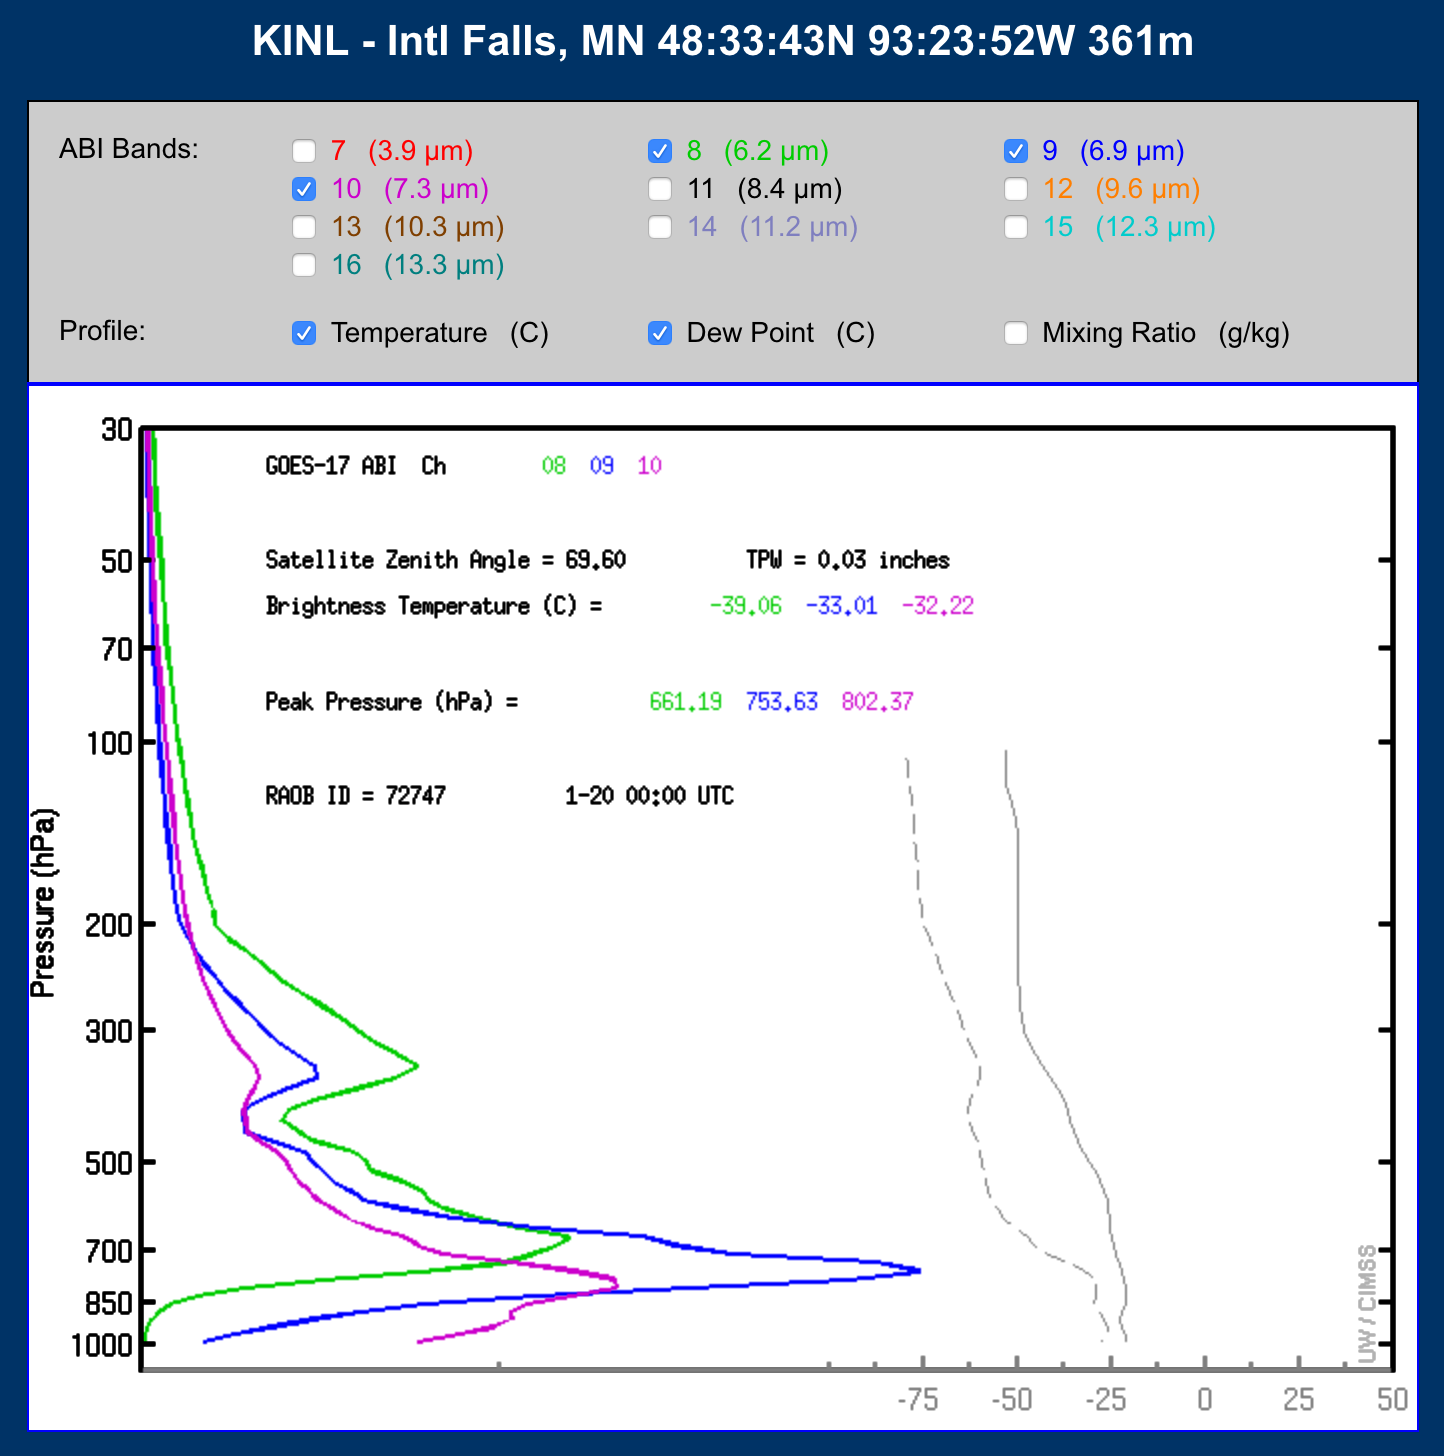
GOES-16 Water Vapor weighting functions, calculated using rawinsonde data from International Falls, Minnesota [click to enlarge]
===== 21 January Update =====
![GOES-16 Low-level (7.3 µm) and Mid-level (6.9 µm) Water Vapor images, with rawinsonde sites plotted in cyan [click to play animation | MP4]](https://cimss.ssec.wisc.edu/satellite-blog/wp-content/uploads/sites/5/2019/01/190121_goes16_waterVapor_EastCoast_dry_air_anim.gif)
GOES-16 Low-level (7.3 µm) and Mid-level (6.9 µm) Water Vapor images, with rawinsonde sites plotted in cyan [click to play animation | MP4]
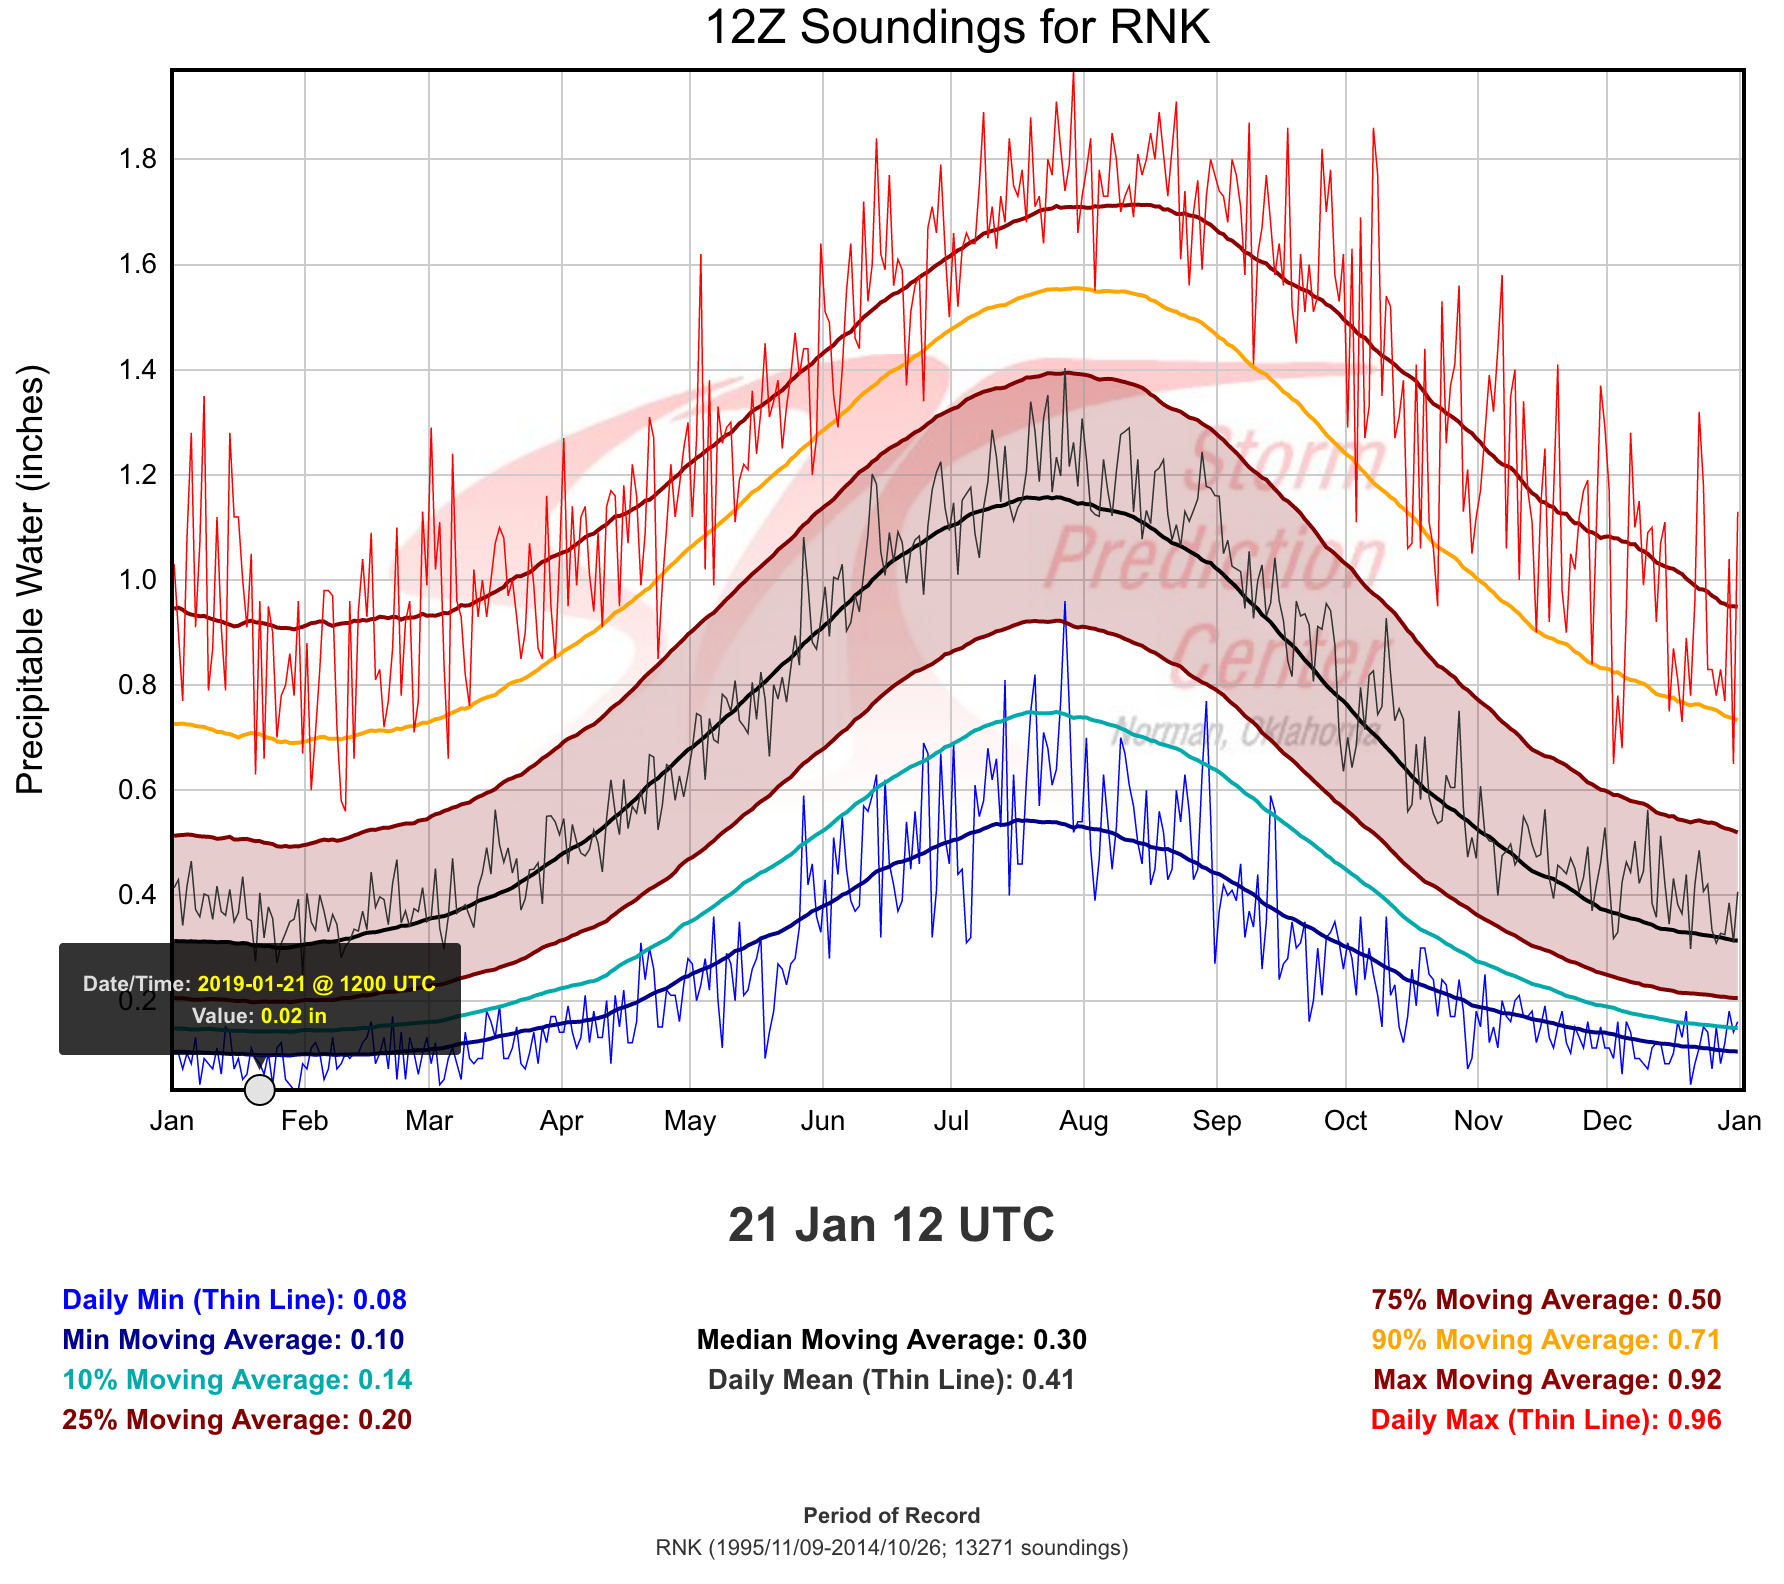
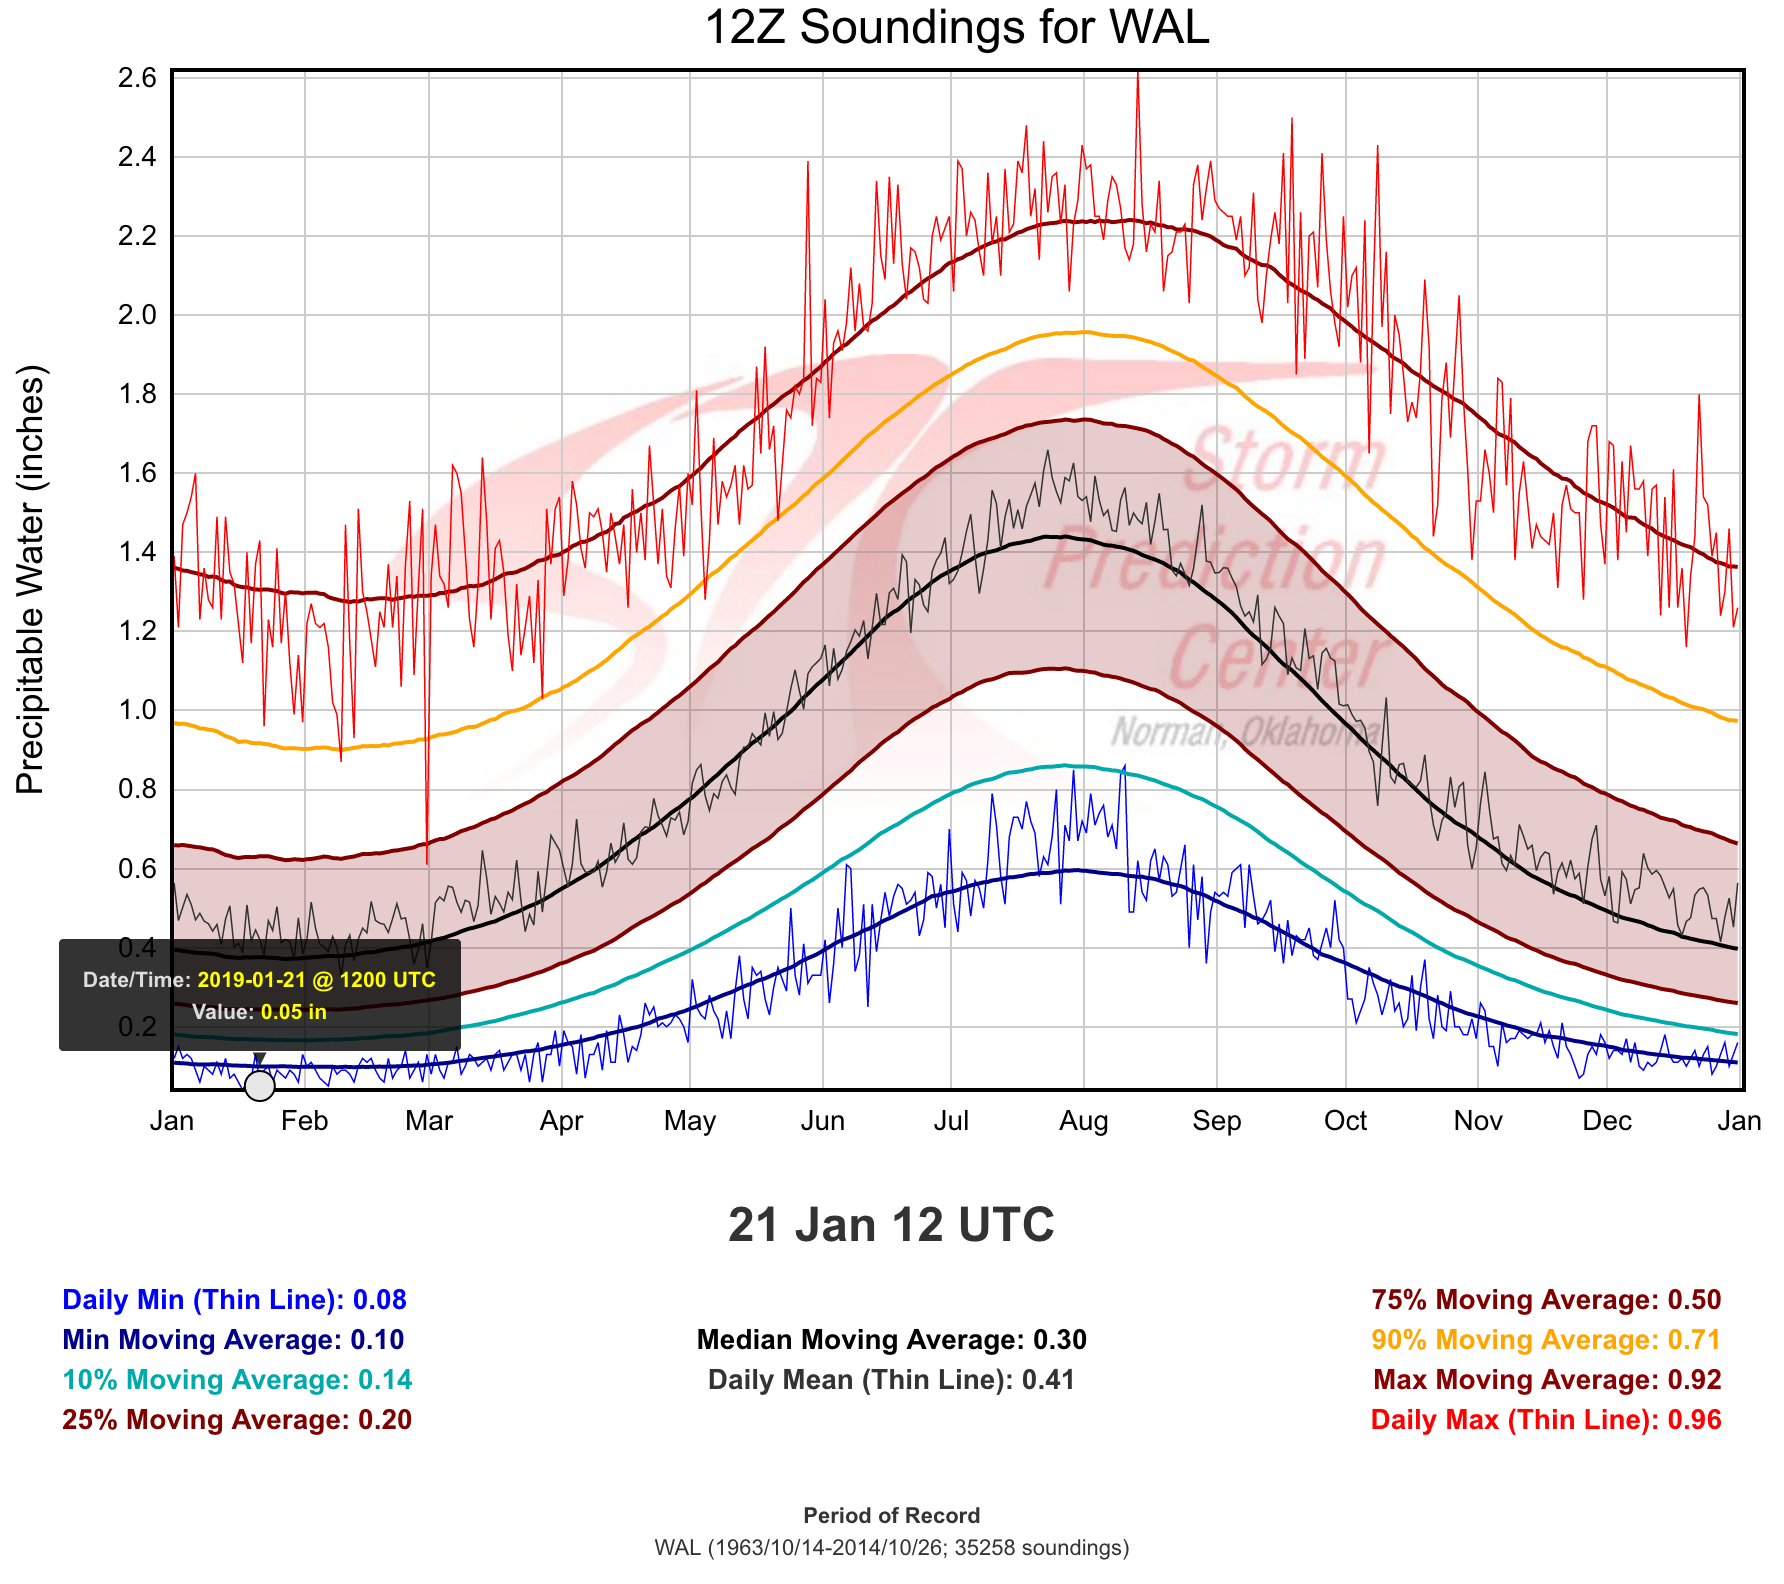
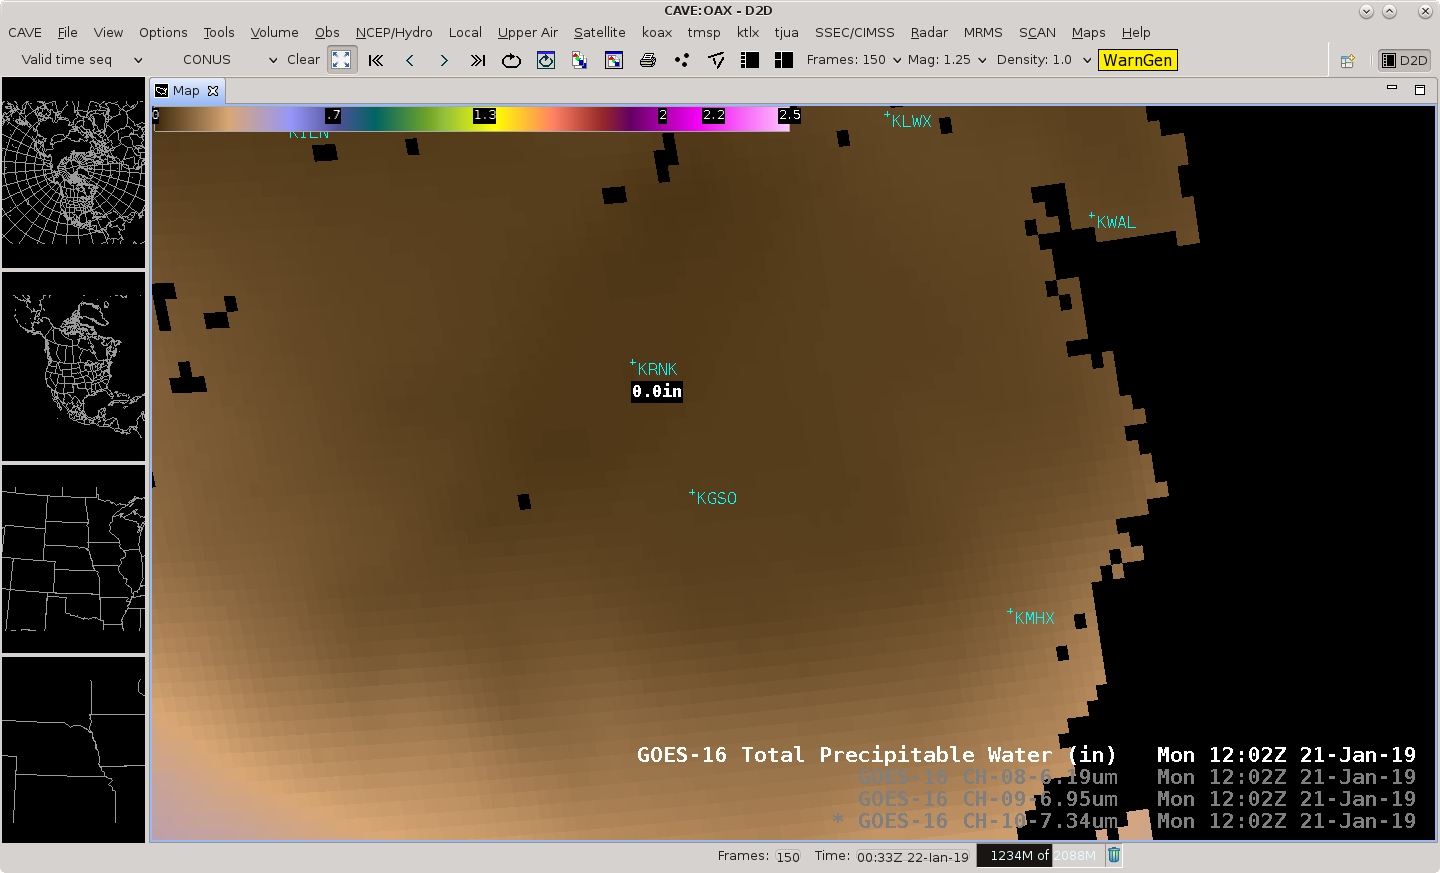
This cold/dry air mass set new daily records for lowest rawinsonde-measured Total Precipitable Water at Greensboro in central North Carolina (0.04 inch), Roanoke/Blacksburg in western Virginia (0.02 inch) and Wallops Island on the Eastern Shore of Virginia (0.05 inch). GOES-16 Total Precipitable Water product showed values in the 0.01 to 0.09 inch range in the vicinity of Roanoke and Greensboro. In plots of the GOES-16 water vapor weighting functions for those 3 rawinsonde sites (below), note the very strong contributions of radiation directly from or just above the surface for the 7.3 µm and 6.9 µm spectral bands.
![GOES-16 water vapor weighting functions, calculated using 12 UTC rawinsonde data from Greensboro, North Carolina [click to enlarge]](https://cimss.ssec.wisc.edu/satellite-blog/wp-content/uploads/sites/5/2019/01/190121_12utc_kgso_wv_wf.png)
GOES-16 water vapor weighting functions, calculated using 12 UTC rawinsonde data from Greensboro, North Carolina [click to enlarge]
![GOES-16 water vapor weighting functions, calculated using 12 UTC rawinsonde data from Roanoke/Blacksburg, Virginia [click to enlarge]](https://cimss.ssec.wisc.edu/satellite-blog/wp-content/uploads/sites/5/2019/01/190121_12utc_krnk_wv_wf.png)
GOES-16 water vapor weighting functions, calculated using 12 UTC rawinsonde data from Roanoke/Blacksburg, Virginia [click to enlarge]
![GOES-16 water vapor weighting functions, calculated using 12 UTC rawinsonde data from Wallops Island, Virginia [click to enlarge]](https://cimss.ssec.wisc.edu/satellite-blog/wp-content/uploads/sites/5/2019/01/190121_12utc_kwal_wv_wf.png)
GOES-16 water vapor weighting functions, calculated using 12 UTC rawinsonde data from Wallops Island, Virginia [click to enlarge]
View only this post Read Less
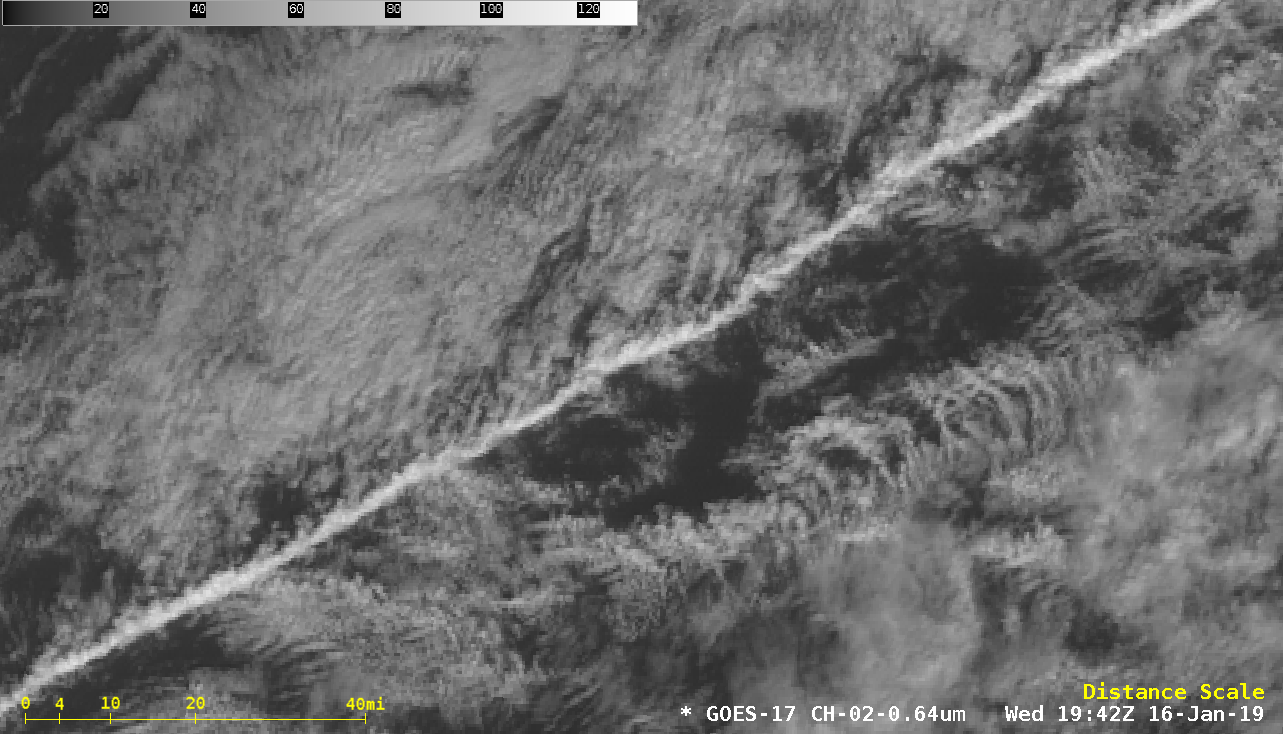
![GOES-17 "Red" Visible (0.64 µm) images [click to play animation]](https://cimss.ssec.wisc.edu/satellite-blog/wp-content/uploads/sites/5/2019/01/190116_goes17_visible_East_Pacific_rope_cloud_anim.gif)
![GOES-17 "Red" Visible (0.64 µm) images [click to play animation]](https://cimss.ssec.wisc.edu/satellite-blog/wp-content/uploads/sites/5/2019/01/190116_goes17_visible_East_Pacific_rope_cloud_zoom_anim.gif)
![GOES-17 "Red" Visible (0.64 µm) images [click to enlarge]](https://cimss.ssec.wisc.edu/satellite-blog/wp-content/uploads/sites/5/2019/01/rope_zoom2_vis-20190116_194219.png)
![1802 UTC GOES-17 "Red" Visible (0.64 µm) image, with an overlay of the 18 UTC surface analysis [click to enlarge]](https://cimss.ssec.wisc.edu/satellite-blog/wp-content/uploads/sites/5/2019/01/190116_1802utc_goes17_visible_18utc_surface_analysis_anim.gif)
![NOAA-15 AVHRR Visible (0.63 µm) and Infrared Window (10.8 µm) images at 1617 UTC [click to enlarge]](https://cimss.ssec.wisc.edu/satellite-blog/wp-content/uploads/sites/5/2019/01/190116_1617utc_noaa15_visible_infrared_Rope_Cloud_anim.gif)
![NOAA-18 AVHRR Visible (0.63 µm) and Infrared Window (10.8 µm) images [click to enlarge]](https://cimss.ssec.wisc.edu/satellite-blog/wp-content/uploads/sites/5/2019/01/190116_1710utc_noaa18_visible_infrared_Rope_Cloud_anim.gif)
![GOES-17 True Color RGB images [click to play animation | MP4]](https://cimss.ssec.wisc.edu/satellite-blog/wp-content/uploads/sites/5/2019/01/190117_goes17_truecolor_HI_anim.gif)
![Suomi NPP VIIRS Day/Night Band (0.7 µm) image, with and without buoy observations [click to enlarge]](https://cimss.ssec.wisc.edu/satellite-blog/wp-content/uploads/sites/5/2019/01/190118_0748utc_suomiNPP_viirs_DayNightBand_Gulf_of_Mexico_rope_cloud_anim.gif)
![NOAA-20 and Suomi NPP VIIRS Day/Night Band (0.7 µm) images [click to enlarge]](https://cimss.ssec.wisc.edu/satellite-blog/wp-content/uploads/sites/5/2019/01/190118_noaa20_suomiNPP_viirs_dayNightBand_Gulf_of_Mexico_anim.gif)
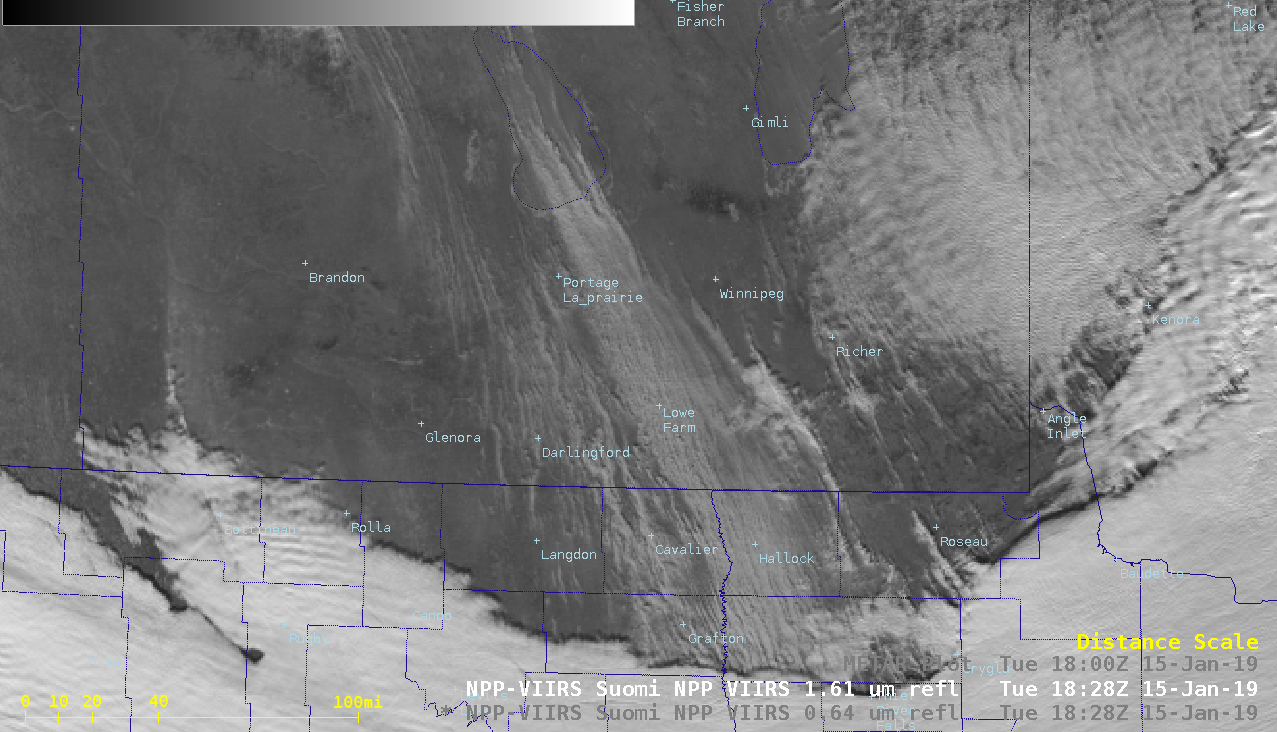
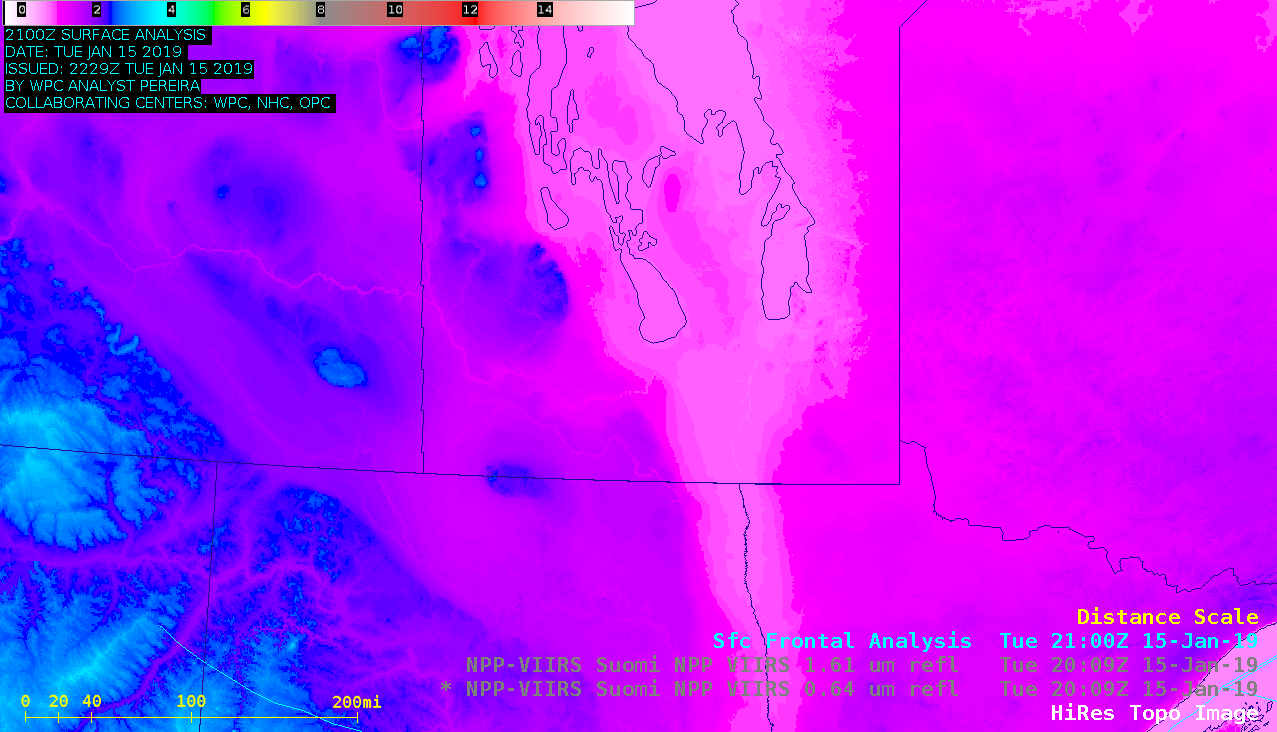
![MODIS Visible (0.65 µm) and Snow/Ice (1.61 µm) images from Terra and Aqua plus VIIRS Visible (0.64 µm) and Snow/Ice (1.61 µm) from NOAA-20 and Suomi NPP [click to enlarge]](https://cimss.ssec.wisc.edu/satellite-blog/wp-content/uploads/sites/5/2019/01/190115_modis_viirs_visible_snowIce_MB_ND_MN_blowing_snow_anim.gif)
![NOAA-20 and Suomi NPP VIIRS Snow/Ice (1.61 µm) images, with plots of surface observations [click to enlarge]](https://cimss.ssec.wisc.edu/satellite-blog/wp-content/uploads/sites/5/2019/01/190115_modis_viirs_visible_snowIce_MB_ND_MN_blowing_snow_zoom_observations_anim.gif)
![Aqua MODIS True Color image [click to enlarge]](http://eosweb.ssec.wisc.edu/browse_images/aqua/2019/015/2019-01-15_1923-1934_HWIN_010403_QKM.jpg)
![Terra MODIS True Color and False Color RGB images [click to enlarge]](https://cimss.ssec.wisc.edu/satellite-blog/wp-content/uploads/sites/5/2019/01/190115_terra_modis_truecolor_falsecolor_anim.gif)
![Aqua MODIS True Color and False Color RGB images [click to enlarge]](https://cimss.ssec.wisc.edu/satellite-blog/wp-content/uploads/sites/5/2019/01/190115_aqua_modis_truecolor_falsecolor_anim.gif)
