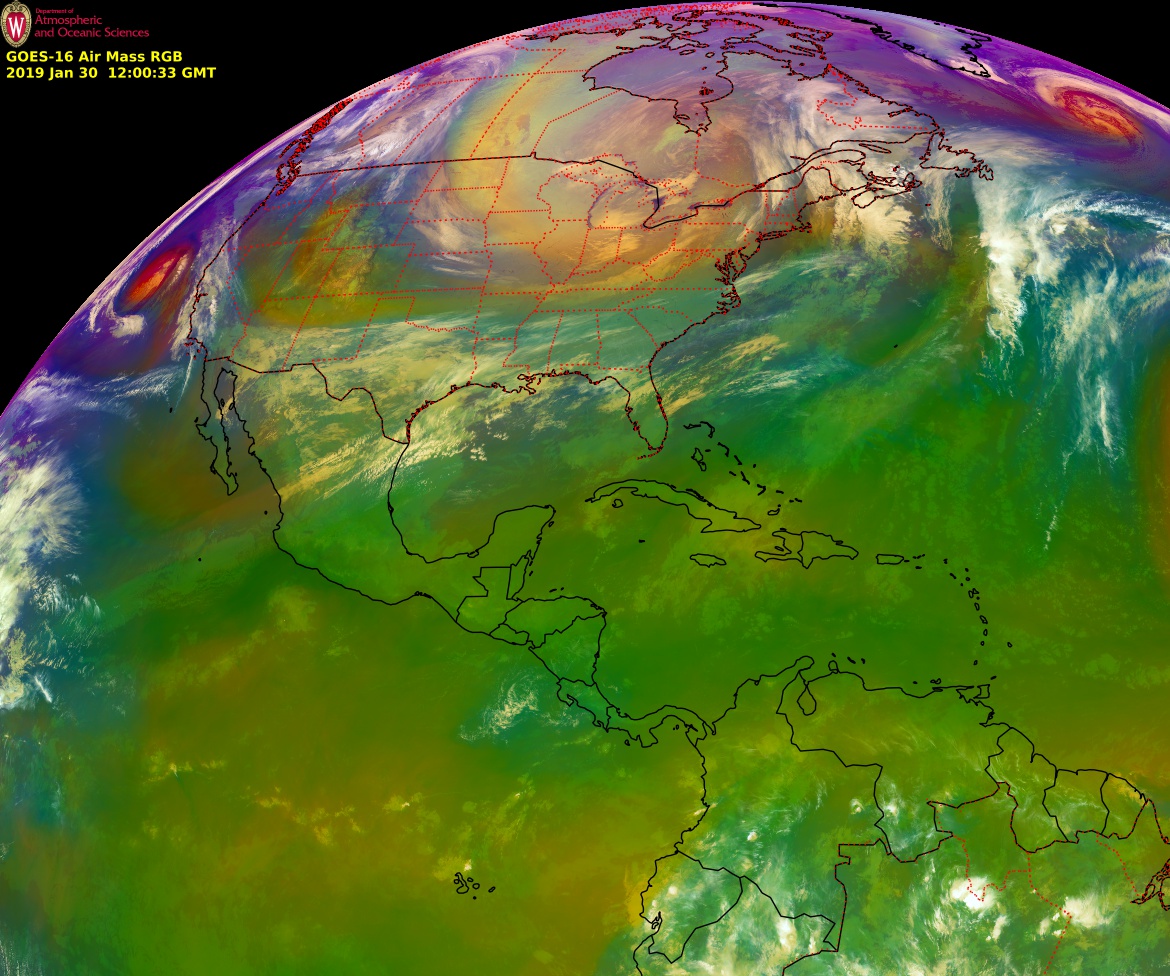
![GOES-16 Air Mass RGB images, 28-30 January [click to play MP4 animation]](https://cimss.ssec.wisc.edu/satellite-blog/wp-content/uploads/sites/5/2019/01/20190130120033_namer.jpg)
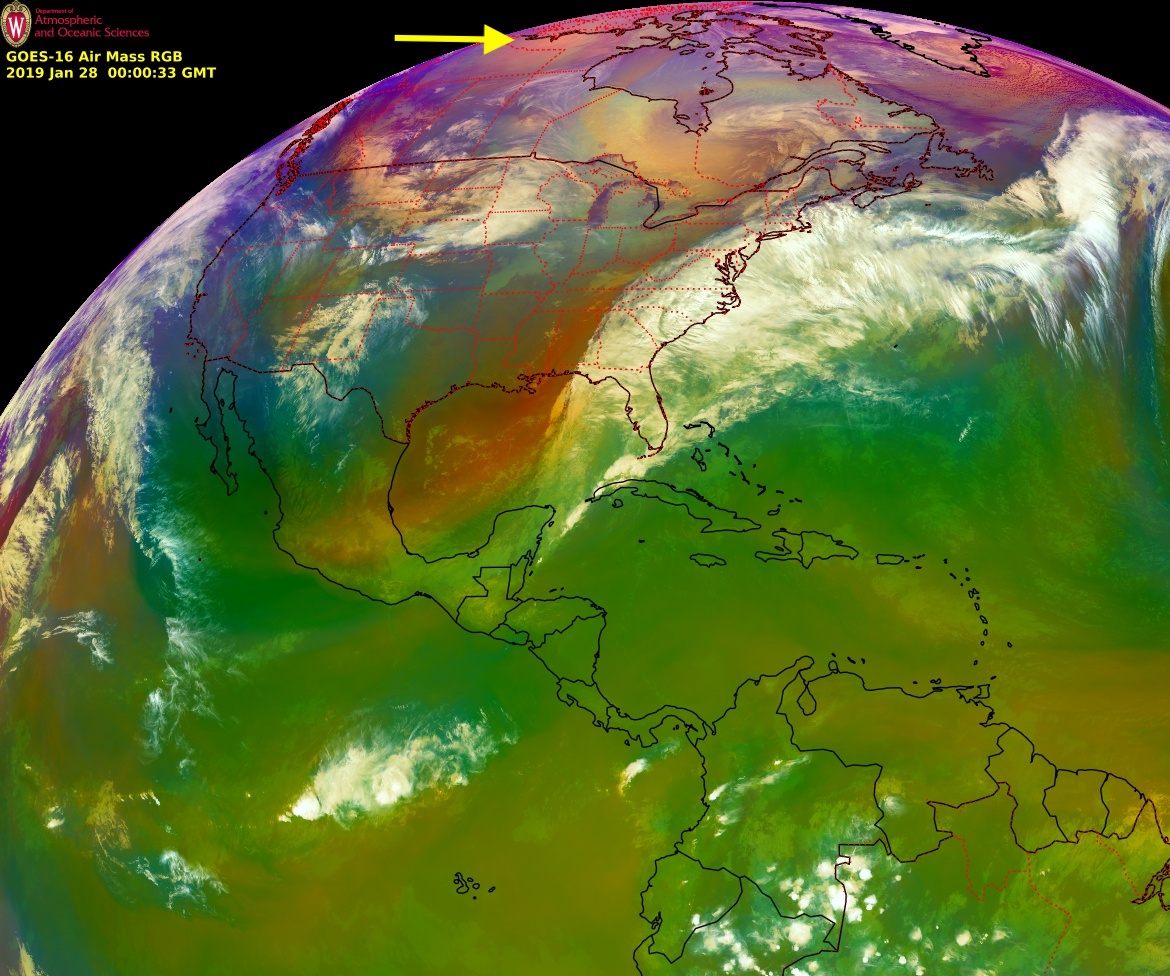
GOES-16 Air Mass RGB images, 28-30 January [click to play MP4 animation]
“It Came from Nunavut”
It sounds like the title of a good movie to describe this cold weather. Have you been wondering where this system came from? The upper-level low pressure system dived down from northwest Nunavut, in far northern Canada, to Minnesota. pic.twitter.com/GZSMCcO1eR— NWS Duluth (@NWSduluth) January 30, 2019
GOES-16 “Clean” Infrared Window (10.3 µm) images (below) also showed the southward expansion of arctic air into the north-central US — surface infrared brightness temperatures of -30 to -40ºC (darker blue to green enhancement) covered a large area. Such cold infrared brightness temperatures are normally associated with clouds in the middle to upper troposphere. Surface air temperatures of -20 to -40ºF were widespread, along with wind chill values of -40 to -70ºF, leading to numerous school and business closures. Two of the coldest official temperatures in the US on the morning of 30 January were -48ºF at Norris Camp, Minnesota and -44ºF at Bottineau, North Dakota (the high temperature in Bottineau on the previous day, 29 January, was only -26ºF); however, there were a few North Dakota Department of Transportation roadside sensors that reported low temperatures of -49ºF.
GOES-16 “Clean” Infrared Window (10.3 µm) images, 28-30 January [click to play MP4 animation]
More than 130 hourly observation stations across the Upper Midwest recorded a wind chill of -50°F or colder overnight into this morning. Here are some select station minimums from across the region. pic.twitter.com/A7FXAKdP8y
— MRCC (@MidwestClimate) January 30, 2019
GOES-16 True Color RGB images (below) revealed a variety of multiple-band and single-band lake effect snow features as the arctic air moved across the Great Lakes. In addition, elongated and long-lived cloud bands created snow squall conditions across parts of Ohio and Pennsylvania.
![GOES-16 True Color images [click to play MP4 animation]](https://cimss.ssec.wisc.edu/satellite-blog/wp-content/uploads/sites/5/2019/01/201901301802_gtlakes.jpg)
GOES-16 True Color images [click to play MP4 animation]
![True Color RGB and Infrared Window (11.45 µm) images from NOAA-20 (at 1802 UTC) and Suomi NPP (at 1852 UTC) [click to enlarge]](https://cimss.ssec.wisc.edu/satellite-blog/wp-content/uploads/sites/5/2019/01/190130_18utc_noaa20_suomiNPP_viirs_OH_PA_snow_squalls_anim.gif)
VIIRS True Color RGB and Infrared Window (11.45 µm) images from NOAA-20 (at 1802 UTC) and Suomi NPP (at 1852 UTC) [click to enlarge]
=======================================================

GOES-16 Clear-sky Total Precipitable Water, 1202 UTC on 30 January 2019 (Click to enlarge)
In addition to being extremely cold, the airmass over the Upper Midwest was extremely dry. The image above shows the Baseline GOES-R Total Precipitable Water product. The default AWIPS color enhancement has been modified to better capture the extreme dryness. Regions in light blue over western Minnesota and the eastern Dakotas curving through Iowa into northern Illinois show TPW values around 0.01″ ; green shadings over Wisconsin and eastern Minnesota correspond to values closer to 0.03″. In such dry airmasses, it is possible to see surface features in the infrared 7.3 low-level ABI Water Vapor Channel, Band 10, and the morning of 30 January was no exception, below. Surface features like rivers are notable in Illinois, for example. Even the heat island of the Minneapolis/St. Paul is apparent (albeit barely). Surface features over northern Minnesota and Wisconsin aren’t quite so apparent, perhaps because of the increased amounts of moisture there. There is likely less surface temperature contrast there, also, as rivers/lakes are more likely frozen. It is the temperature contrast — as best exemplified by the Great Lakes shorelines — that allows features to appear in the Water Vapor imagery.
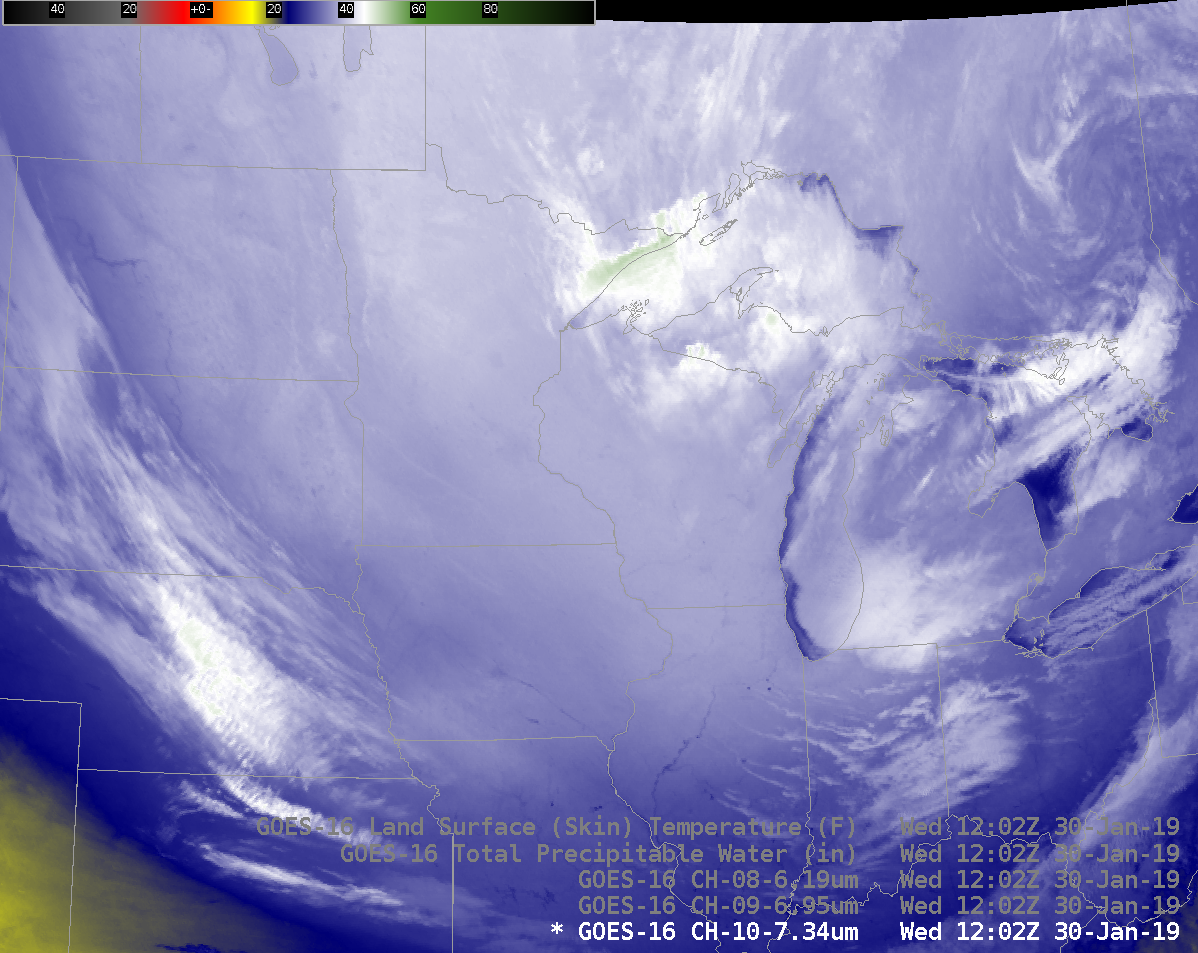
GOES-16 Low-Level Water Vapor Infrared (7.3 µm) Imagery, 1202 UTC on 30 January 2019 (Click to enlarge)
Weighting Functions (in real time, from this site) allow for an estimate of where information in different water vapor channels will be detected by the satellite. In the 0000 UTC 30 January 2019 example, below, from Chanhassen, MN (when total precipitable water there was 0.01″), a large signal is apparent from the low-level water vapor channel (7.3 µm); in fact, most of the information detected by the satellite was coming from the surface! Even the mid-level water vapor (6.9 µm) had a component from the surface. Weighting Functions for Davenport Iowa (The axis of the driest air shifted from near Chanhassen at 0000 UTC to near Davenport at 1200 UTC) at 0000 UTC and 1200 UTC are shown here; Note in the toggle that the level from which information is received by the satellite drops from 0000 to 1200 UTC as dry air moves in.
Clear-sky Weighting Function from Chanhassen MN, 0000 UTC on 30 January 2019 (Click to enlarge)
The GOES-16 Baseline Land Surface Temperature product, below, from 1200 UTC, shows many values at/below -45 F (purple shading) over Minnesota. Dark blue values are around -25 F. Note the relatively warm region over western Iowa, in cyan. That part of Iowa lacks snowcover and exceptional cold rarely happens over bare ground.
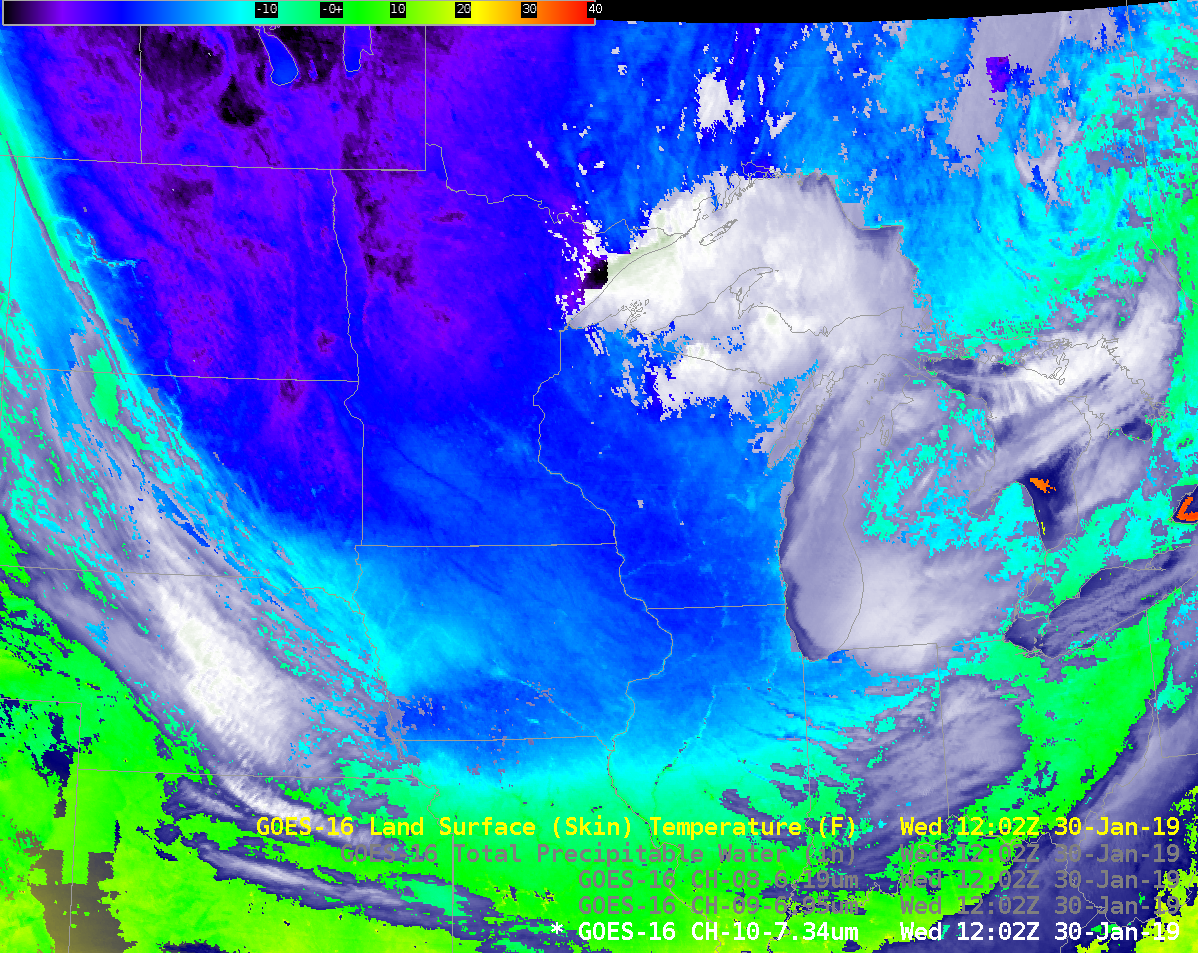
GOES-16 Baseline Land Surface Temperature, 1202 UTC on 30 January 2019 (Click to enlarge)
===== 31 January Update =====
GOES-16 “Clean” Infrared Window (10.3 µm) images, with and without plots of hourly surface observations [click to play animation | MP4]
Farther to the south, GOES-16 Infrared images covering the Minnesota/Wisconsin/Iowa/Illinois region (below) also showed widespread cold surface brightness temperatures (shades of green). All-time record low temperatures were set at Cedar Rapids in Iowa (-30ºF) and at Moline (-33ºF) and Rockford (-31ºF) in Illinois. The cooperative observer at Mt. Carroll in northwestern Illinois reported a low of -38ºF — this was certified as a new all-time record minimum temperature for the state of Illinois.
![GOES-16 "Clean" Infrared Window (10.3 µm) images, with plots of hourly surface observations [click to play animation | MP4]](https://cimss.ssec.wisc.edu/satellite-blog/wp-content/uploads/sites/5/2019/01/190131_goes16_infrared_WI_IA_IL_anim.gif)
GOES-16 “Clean” Infrared Window (10.3 µm) images, with plots of hourly surface observations [click to play animation | MP4]
GOES-16 “Red” Visible (0.64 µm) images, with plots of hourly surface reports [click to play animation | MP4]
![GOES-16 "Red" Visible (0.64 µm) images, with plots of hourly surface reports [click to play animation | MP4]](https://cimss.ssec.wisc.edu/satellite-blog/wp-content/uploads/sites/5/2019/01/190131_goes16_visible_Lake_Erie_ice_anim.gif)
GOES-16 “Red” Visible (0.64 µm) images, with plots of hourly surface reports [click to play animation | MP4]
![Terra MODIS True Color RGB images [click to enlarge]](https://cimss.ssec.wisc.edu/satellite-blog/wp-content/uploads/sites/5/2019/01/190129_190131_terra_modis_truecolor_Chicago_anim.gif)
Terra MODIS True Color RGB images [click to enlarge]
View only this post Read Less
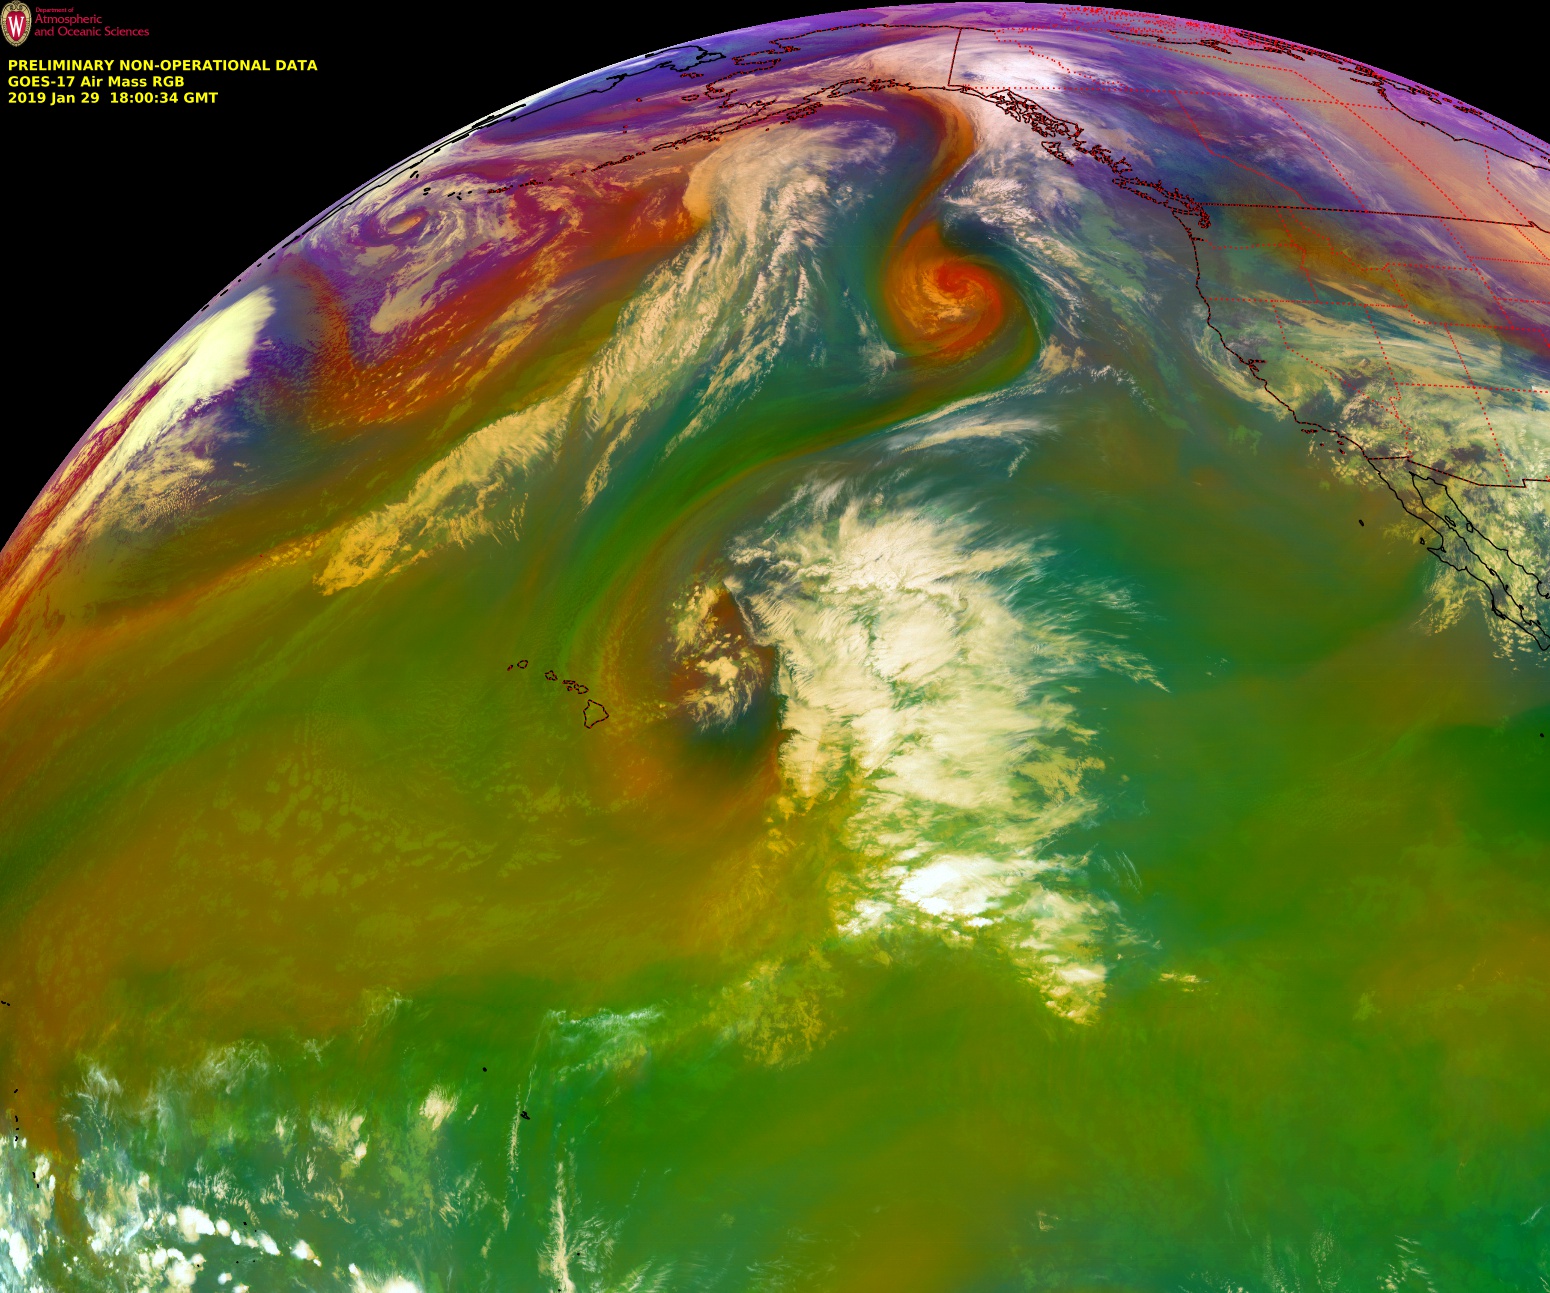
![GOES-17 Air Mass RGB images [click to play animation | MP4]](https://cimss.ssec.wisc.edu/satellite-blog/wp-content/uploads/sites/5/2019/01/190129_goes17_airmassRGB_anim.gif)
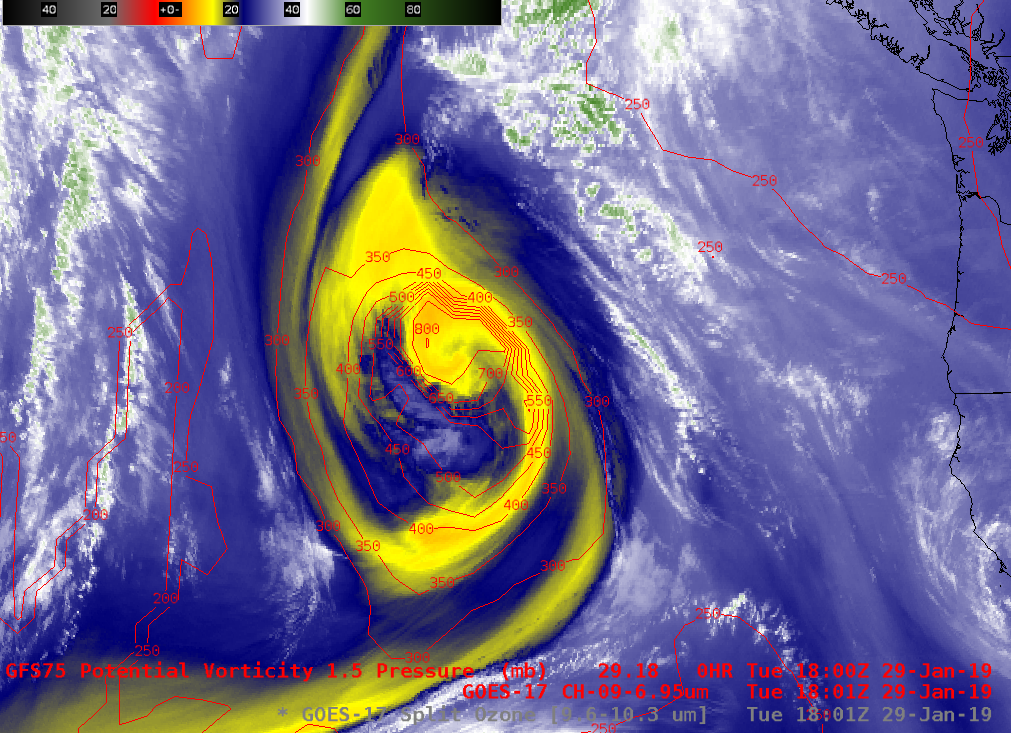
![GOES-17 Mid-level Water Vapor (6.9 µm) images, with and without contours of GFS75 model PV1.5 pressure [click to play animation | MP4]](https://cimss.ssec.wisc.edu/satellite-blog/wp-content/uploads/sites/5/2019/01/190129_goes17_waterVapor_pv1.5pressure_EPAC_anim.gif)
![GOES-16 "Clean" Infrared Window (10.3 µm) images [click to play MP4 animation]](https://cimss.ssec.wisc.edu/satellite-blog/wp-content/uploads/sites/5/2019/01/G16_IR_ARGENTINA_25JAN2019_2019025_225954_GOES-16_0001PANEL.GIF)
![GOES-16 "Red" Visible (0.64 µm, left) and "Clean" Infrared Window (10.3 µm, right) images [click to play MP4 animation]](https://cimss.ssec.wisc.edu/satellite-blog/wp-content/uploads/sites/5/2019/01/G16_VIS_IR_ARGENTINA_25JAN2019_2019025_225954_GOES-16_0002PANELS.GIF)
![NOAA-20 VIIRS True Color Red-Green-Blue (RGB) and Infrared Window (11.45 µm) images [click to enlarge]](https://cimss.ssec.wisc.edu/satellite-blog/wp-content/uploads/sites/5/2019/01/190125_1734utc_noaa20_viirs_truecolor_infrared_Argentina_anim.gif)
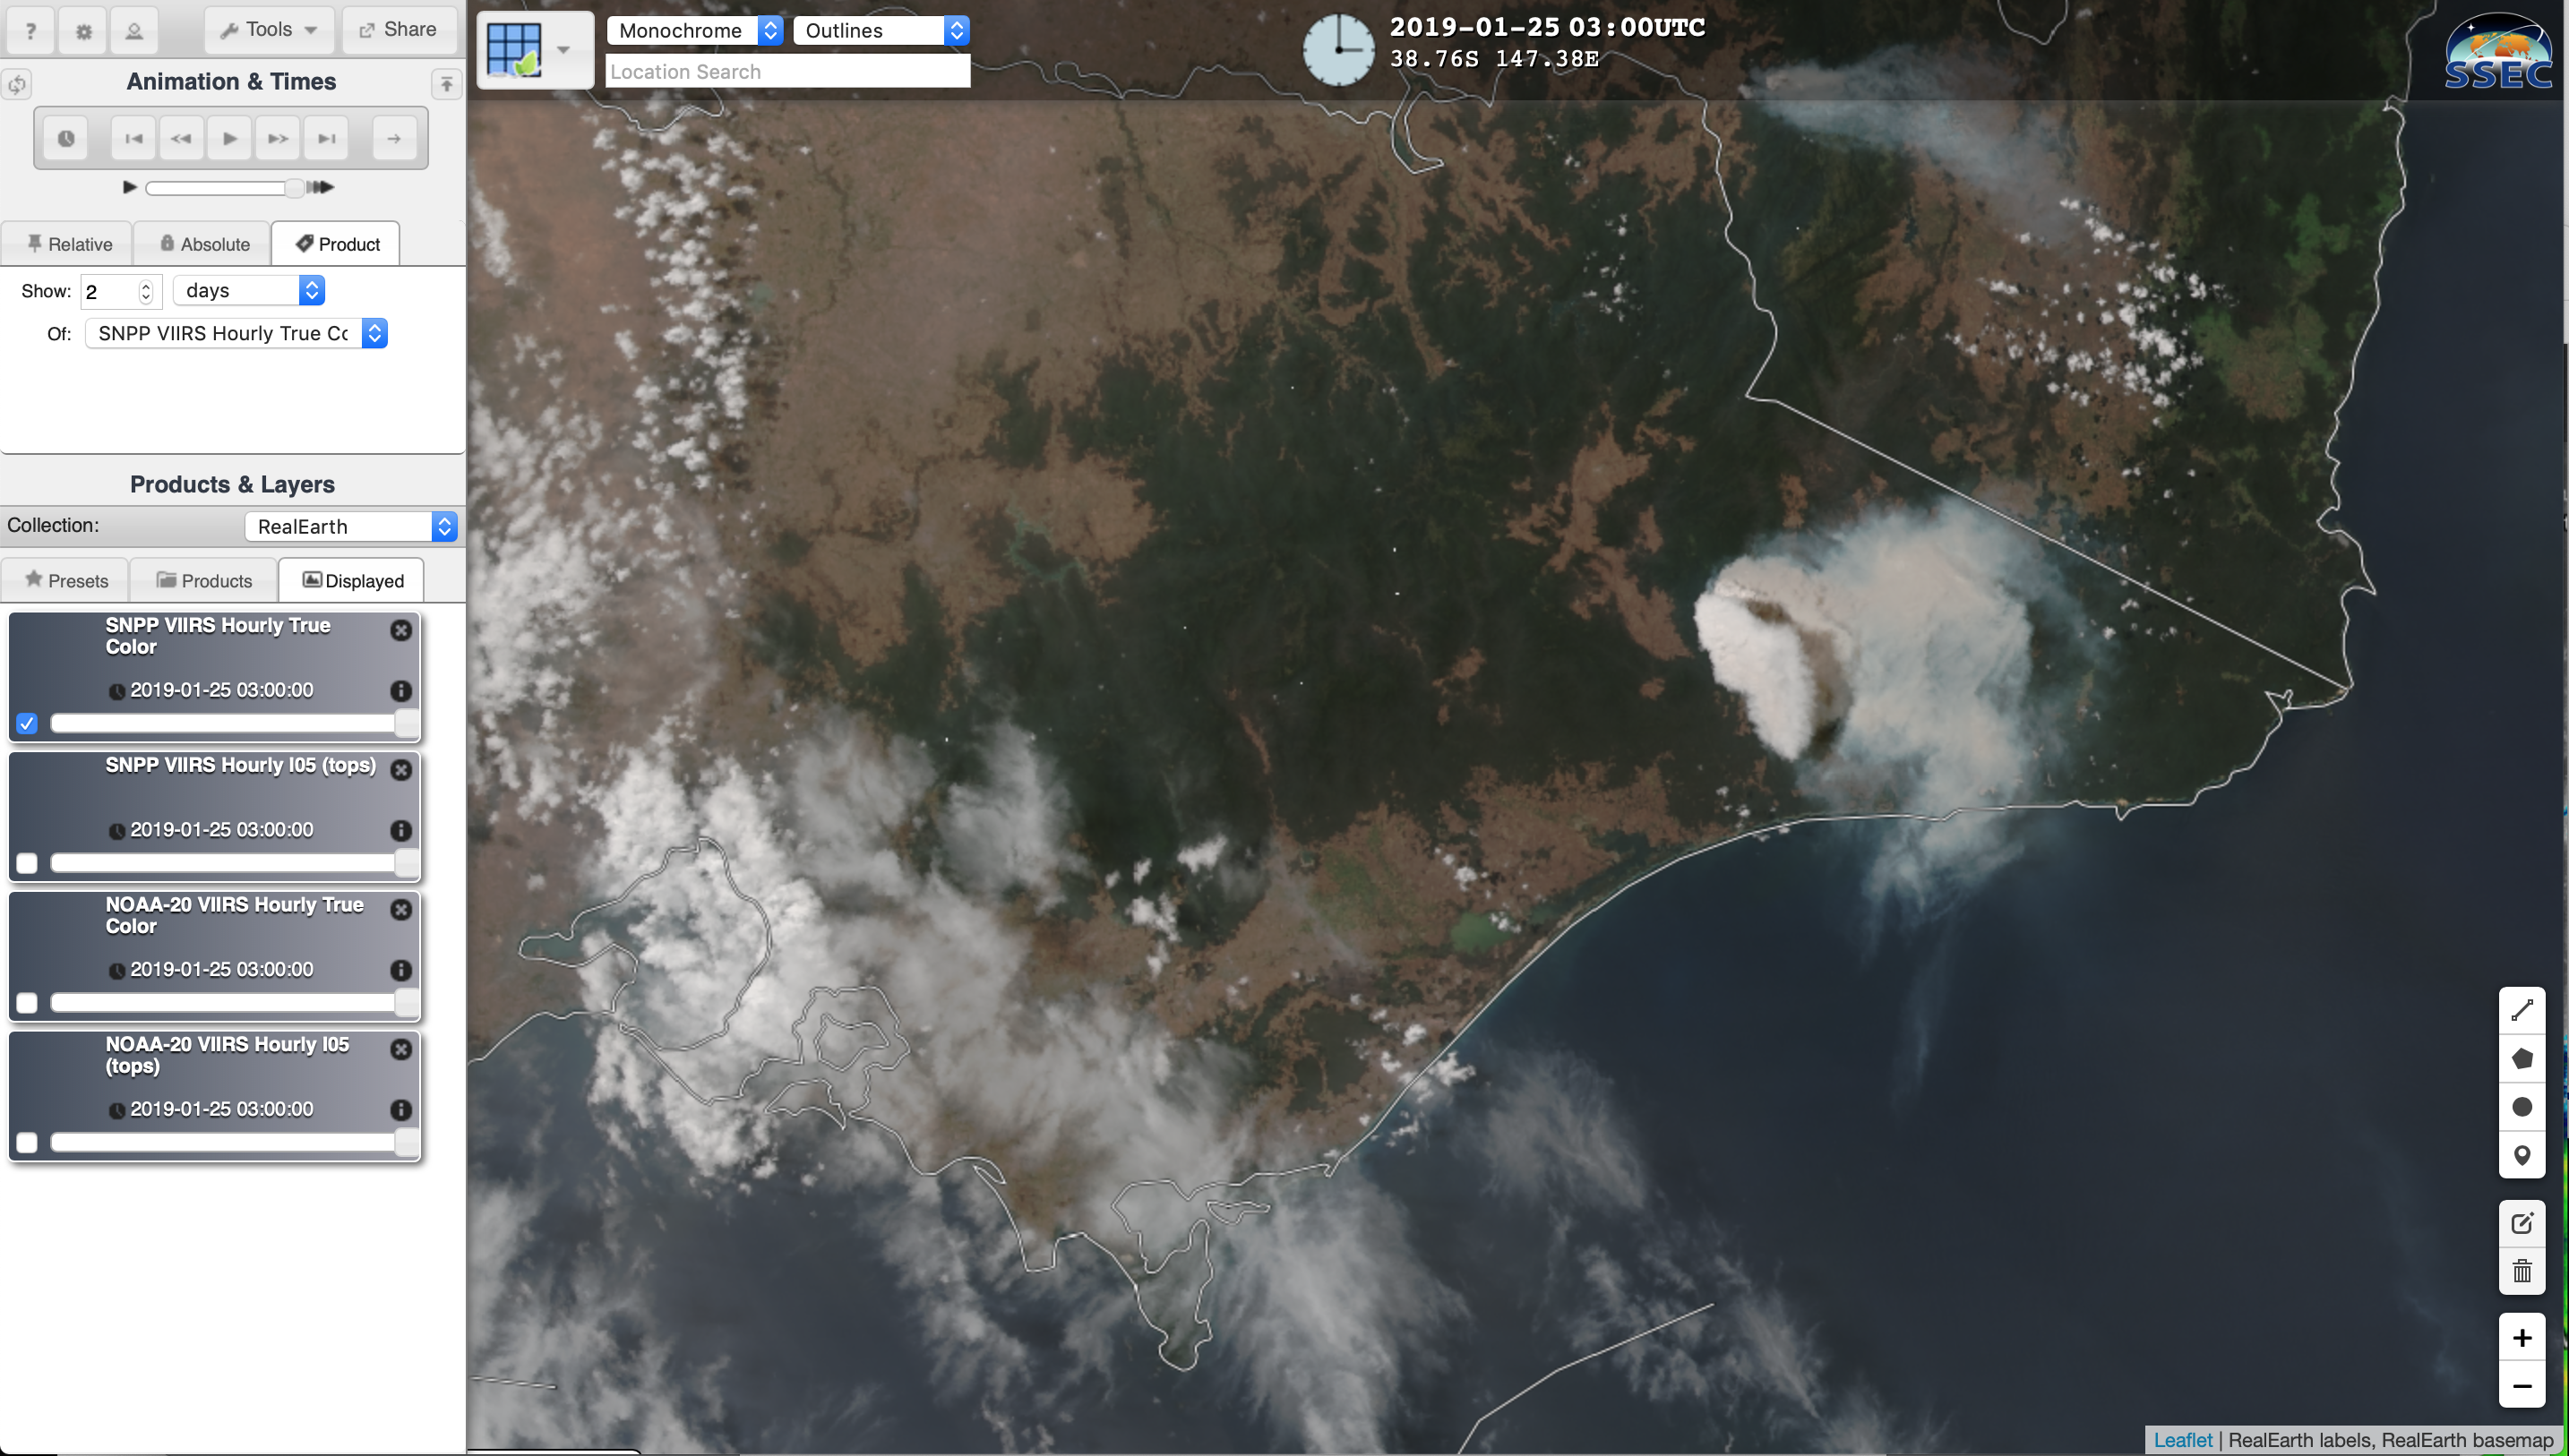
![Himawari-8 "Red" Visible (0.64 µm, left) and Shortwave Infrared (3.7 µm, right) images [click to play to animation | MP4]](https://cimss.ssec.wisc.edu/satellite-blog/wp-content/uploads/sites/5/2019/01/190125_himawari8_visible_shortwaveInfrared_Australia_pyrocb_anim.gif)
![VIIRS True Color RGB and Infrared Window (11.45 µm) images from Suomi NPP (0311 UTC) and NOAA-20 (0501 UTC) images [click to enlarge]](https://cimss.ssec.wisc.edu/satellite-blog/wp-content/uploads/sites/5/2019/01/190125_suomiNPP_noaa20_viirs_truecolor_infrared_Australia_pyroCb_anim.gif)
