A meteorite landed near Viñales, Pinar del Río in western Cuba (about 58 miles or 93 km northeast of San Julian MUSJ) on 01 February 2019. GOES-16 (GOES-East) Split Cloud Top Phase (11.2 – 8.4 µm), Split Window (10.3 – 12.3 µm), Near-Infrared “Cirrus” (1.37 µm) and “Red” Visible (0.64 µm) images (above) revealed signatures of the airborne debris cloud... Read More

GOES-16 Split Cloud Top Phase (11.2 – 8.4 µm), Split Window (10.3 – 12.3 µm), Near-Infrared “Cirrus” (1.37 µm) and “Red” Visible (0.64 µm) images [click to enlarge]
A
meteorite landed near Viñales, Pinar del Río in western Cuba (about 58 miles or 93 km northeast of San Julian MUSJ) on
01 February 2019. GOES-16
(GOES-East) Split Cloud Top Phase (
11.2 – 8.4 µm), Split Window (
10.3 – 12.3 µm), Near-Infrared “Cirrus” (
1.37 µm) and “Red” Visible (
0.64 µm) images
(above) revealed signatures of the airborne debris cloud as it drifted northeastward then eastward for about an hour after the impact (which occurred around
1817 UTC) — during that hour (from 1817 to 1917 UTC) the debris cloud traveled about 40 miles. A brief signature of another (lower-altitude) debris cloud moving southwestward was also seen immediately following impact, which was most apparent in the Split Window and Cirrus images.
The signatures in the Split Cloud Top Phase and Split Window imagery were due to the presence of mineral dust particles within the debris cloud — the emissivity properties of dust affects the sensed brightness temperatures differently for various infrared spectral bands. The Cirrus spectral band is useful for detecting the scattering of light by airborne particles such as ice crystals, volcanic ash, smoke or dust. The debris cloud was also casting a subtle shadow onto the surface, as seen in the Visible imagery.
Rawinsonde data from Key West, Florida (below) indicated that the northeastward to eastward drift of the debris cloud at a velocity of about 40 mph (35 knots) would have been occurring at altitudes of 4.9-5.5 km (pressures of 565-522 hPa).
![Plots of rawinsonde data from Key West, Florida [click to enlarge]](https://cimss.ssec.wisc.edu/satellite-blog/wp-content/uploads/sites/5/2019/01/190201_KKEY_RAOBS.GIF)
Plots of rawinsonde data from Key West, Florida [click to enlarge]
The GOES-16
Geostationary Lightning Mapper also exhibited a signature around the time of the meteorite impact, as discussed
here. Looking at GOES-16 Upper-level (
6.2 µm), Mid-level (
6.9 µm), Low-level (
7.3 µm) and “Clean” Infrared Window (
10.3 µm) images with plots of GLM Groups
(below), a faint debris cloud signature could best be followed in the 7.3 µm imagery (
AWIPS animation) after the
1817 UTC impact — but for a shorter time period than what was seen with the other GOES-16 examples shown above. While the Water Vapor band
weighting functions for Key West had peaks at fairly low altitudes for 7.3 µm and 6.9 µm, the signature for any low/mid-tropospheric features would have been masked by absorption and re-radiation from moist layers within the upper troposphere.

GOES-16 Upper-level (6.2 µm, top left), Mid-level (6.9 µm, top right), Low-level (7.3 µm, bottom left) and “Clean” Infrared Window (10.3 µm, bottom right) images, with GLM Groups accumulated during the 5-minute period ending at the image time plotted in red [click to play animation | MP4]
* GOES-17 imagery shown here is preliminary and non-operational *
The bright signature of the bolide exploding as it entered the Earth’s atmosphere was also detected by the GLM instrument on GOES-17, although the viewing angle was much larger (with a zenith angle of 67 degrees, vs 30 degrees from GOES-16). The GLM Groups detected by both GOES-17 and GOES-16 were plotted with and without the native parallax correction (below).
!["Red" Visible (0.64 µm) and Low-level Water Vapor (7.3 µm) images from GOES-17 (left) and GOES-16 (right), with GLM Groups accumulated during the 15-minute period ending at 1830 UTC plotted in red [click to enlarge]](https://cimss.ssec.wisc.edu/satellite-blog/wp-content/uploads/sites/5/2019/01/190201_1830utc_goes17_goes16_visible_waterVapor_glm_Cuba_meteorite_anim.gif)
“Red” Visible (0.64 µm) and Low-level Water Vapor (7.3 µm) images from GOES-17 (left) and GOES-16 (right), with GLM Groups accumulated during the 15-minute period ending at 1830 UTC plotted in red [click to enlarge]
View only this post
Read Less
![GOES-16 Air Mass RGB images [click to play MP4 animation]](https://cimss.ssec.wisc.edu/satellite-blog/wp-content/uploads/sites/5/2019/02/20190204120214_conus.jpg)
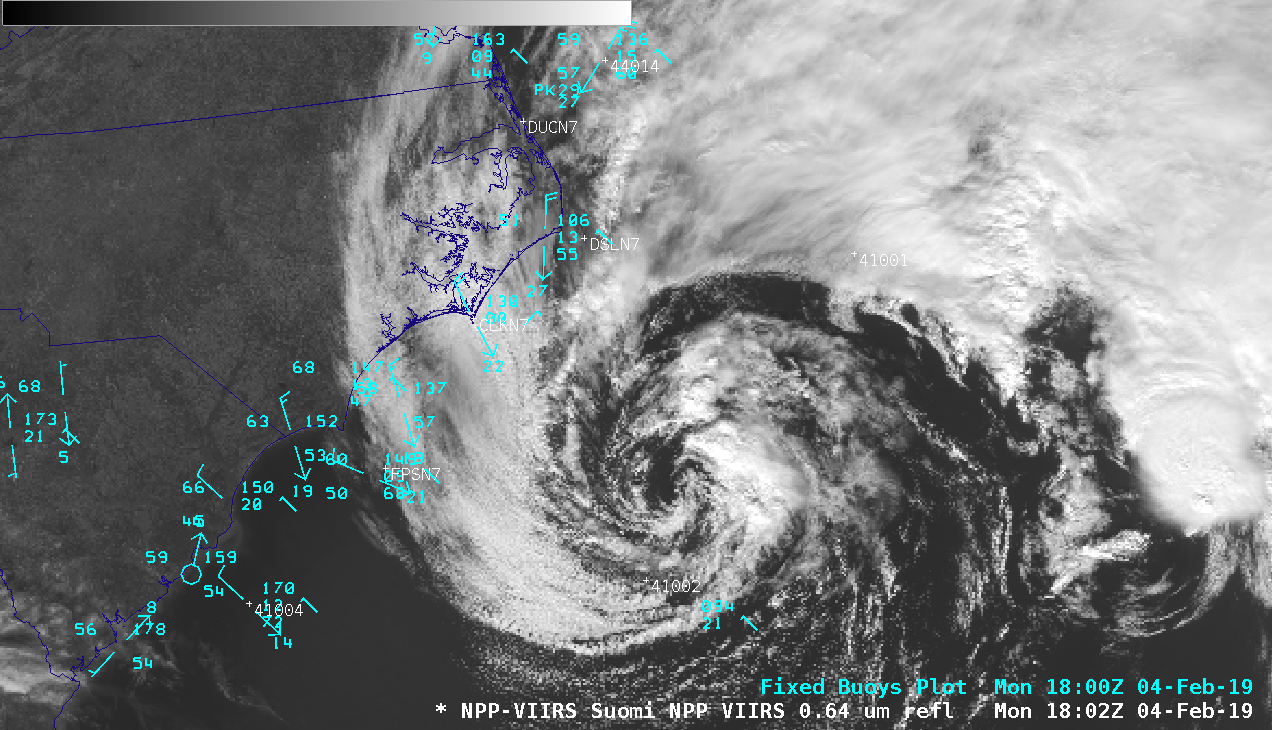
![Infrared Window images from Terra MODIS (11.0 µm) and NOAA-20/Suomi NPP VIIRS (11.45 µm), with plot of fixed buoy reports [click to enlarge]](https://cimss.ssec.wisc.edu/satellite-blog/wp-content/uploads/sites/5/2019/02/190204_modis_viirs_infrared_Atlantic_anim.gif)
![Visible images from Terra MODIS (0.65 µm) and NOAA-20/Suomi NPP VIIRS (0.64 µm), with plots of fixed buoy reports [click to enlarge]](https://cimss.ssec.wisc.edu/satellite-blog/wp-content/uploads/sites/5/2019/02/190204_modis_viirs_visible_Atlantic_anim.gif)
![NOAA-20 VIIRS Day/Night Band (0.7 µm) and Infrared Window (11.45 µm) images at 0620 UTC [click to enlarge]](https://cimss.ssec.wisc.edu/satellite-blog/wp-content/uploads/sites/5/2019/02/190205_0620utc_noaa20_viirs_dayNightBand_infraredWindow_Atlantic_anim.gif)

![MIMIC Total Precipitable Water product [click to play animation | MP4]](https://cimss.ssec.wisc.edu/satellite-blog/wp-content/uploads/sites/5/2019/02/190203_190205_mimic_tpw_anim.gif)

![Plots of Spectral Response Functions for ABI Bands 5, 6 and 7 [click to enlarge]](https://cimss.ssec.wisc.edu/satellite-blog/wp-content/uploads/sites/5/2018/08/ABI_Band_5_6_7_Spectral_Response_Functions_Fires.png)
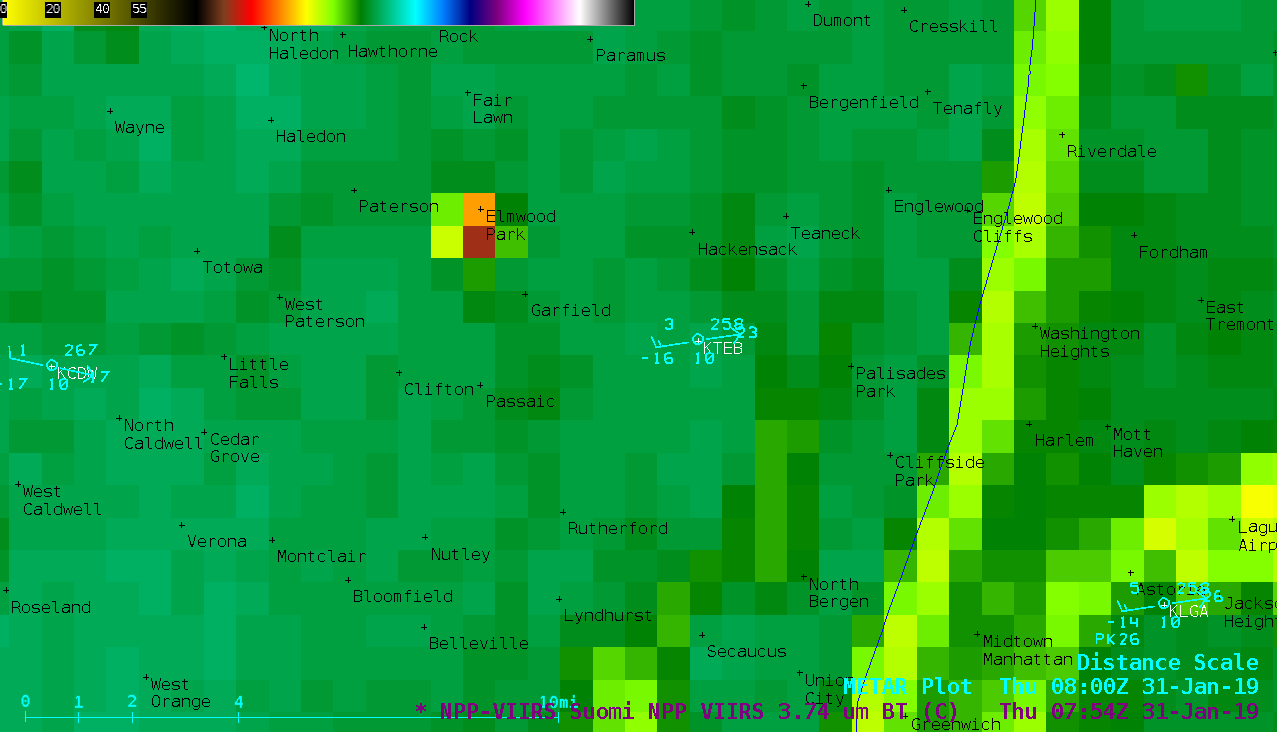
![VIIRS Shortwave Infrared (3.74 µm) images from NOAA-20 (at 0614 and 0754 UTC) and Suomi NPP (at 0704 UTC) [click to enlarge]](https://cimss.ssec.wisc.edu/satellite-blog/wp-content/uploads/sites/5/2019/01/190131_noaa20_suomiNPP_viirs_shortwaveInfrared_New_Jersey_fire_anim.gif)
