The 250-hPa jet streak currently over the CONUS contains wind speeds approaching 200 kt (230 mph) and is assoc. w/ standardized anomalies >3? spanning from Texas to Michigan. I suspect this jet streak is also helping cross-country flights arrive early on the East Coast! ? ? pic.twitter.com/z7474e6bXk — Alicia... Read More
![GOES-16 Upper-level Water Vapor (6.2 µm) images, with plots of Derived Motion Winds [click to play animation | MP4]](https://cimss.ssec.wisc.edu/satellite-blog/wp-content/uploads/sites/5/2019/02/conus_wv8_winds-20190218_000213.png)
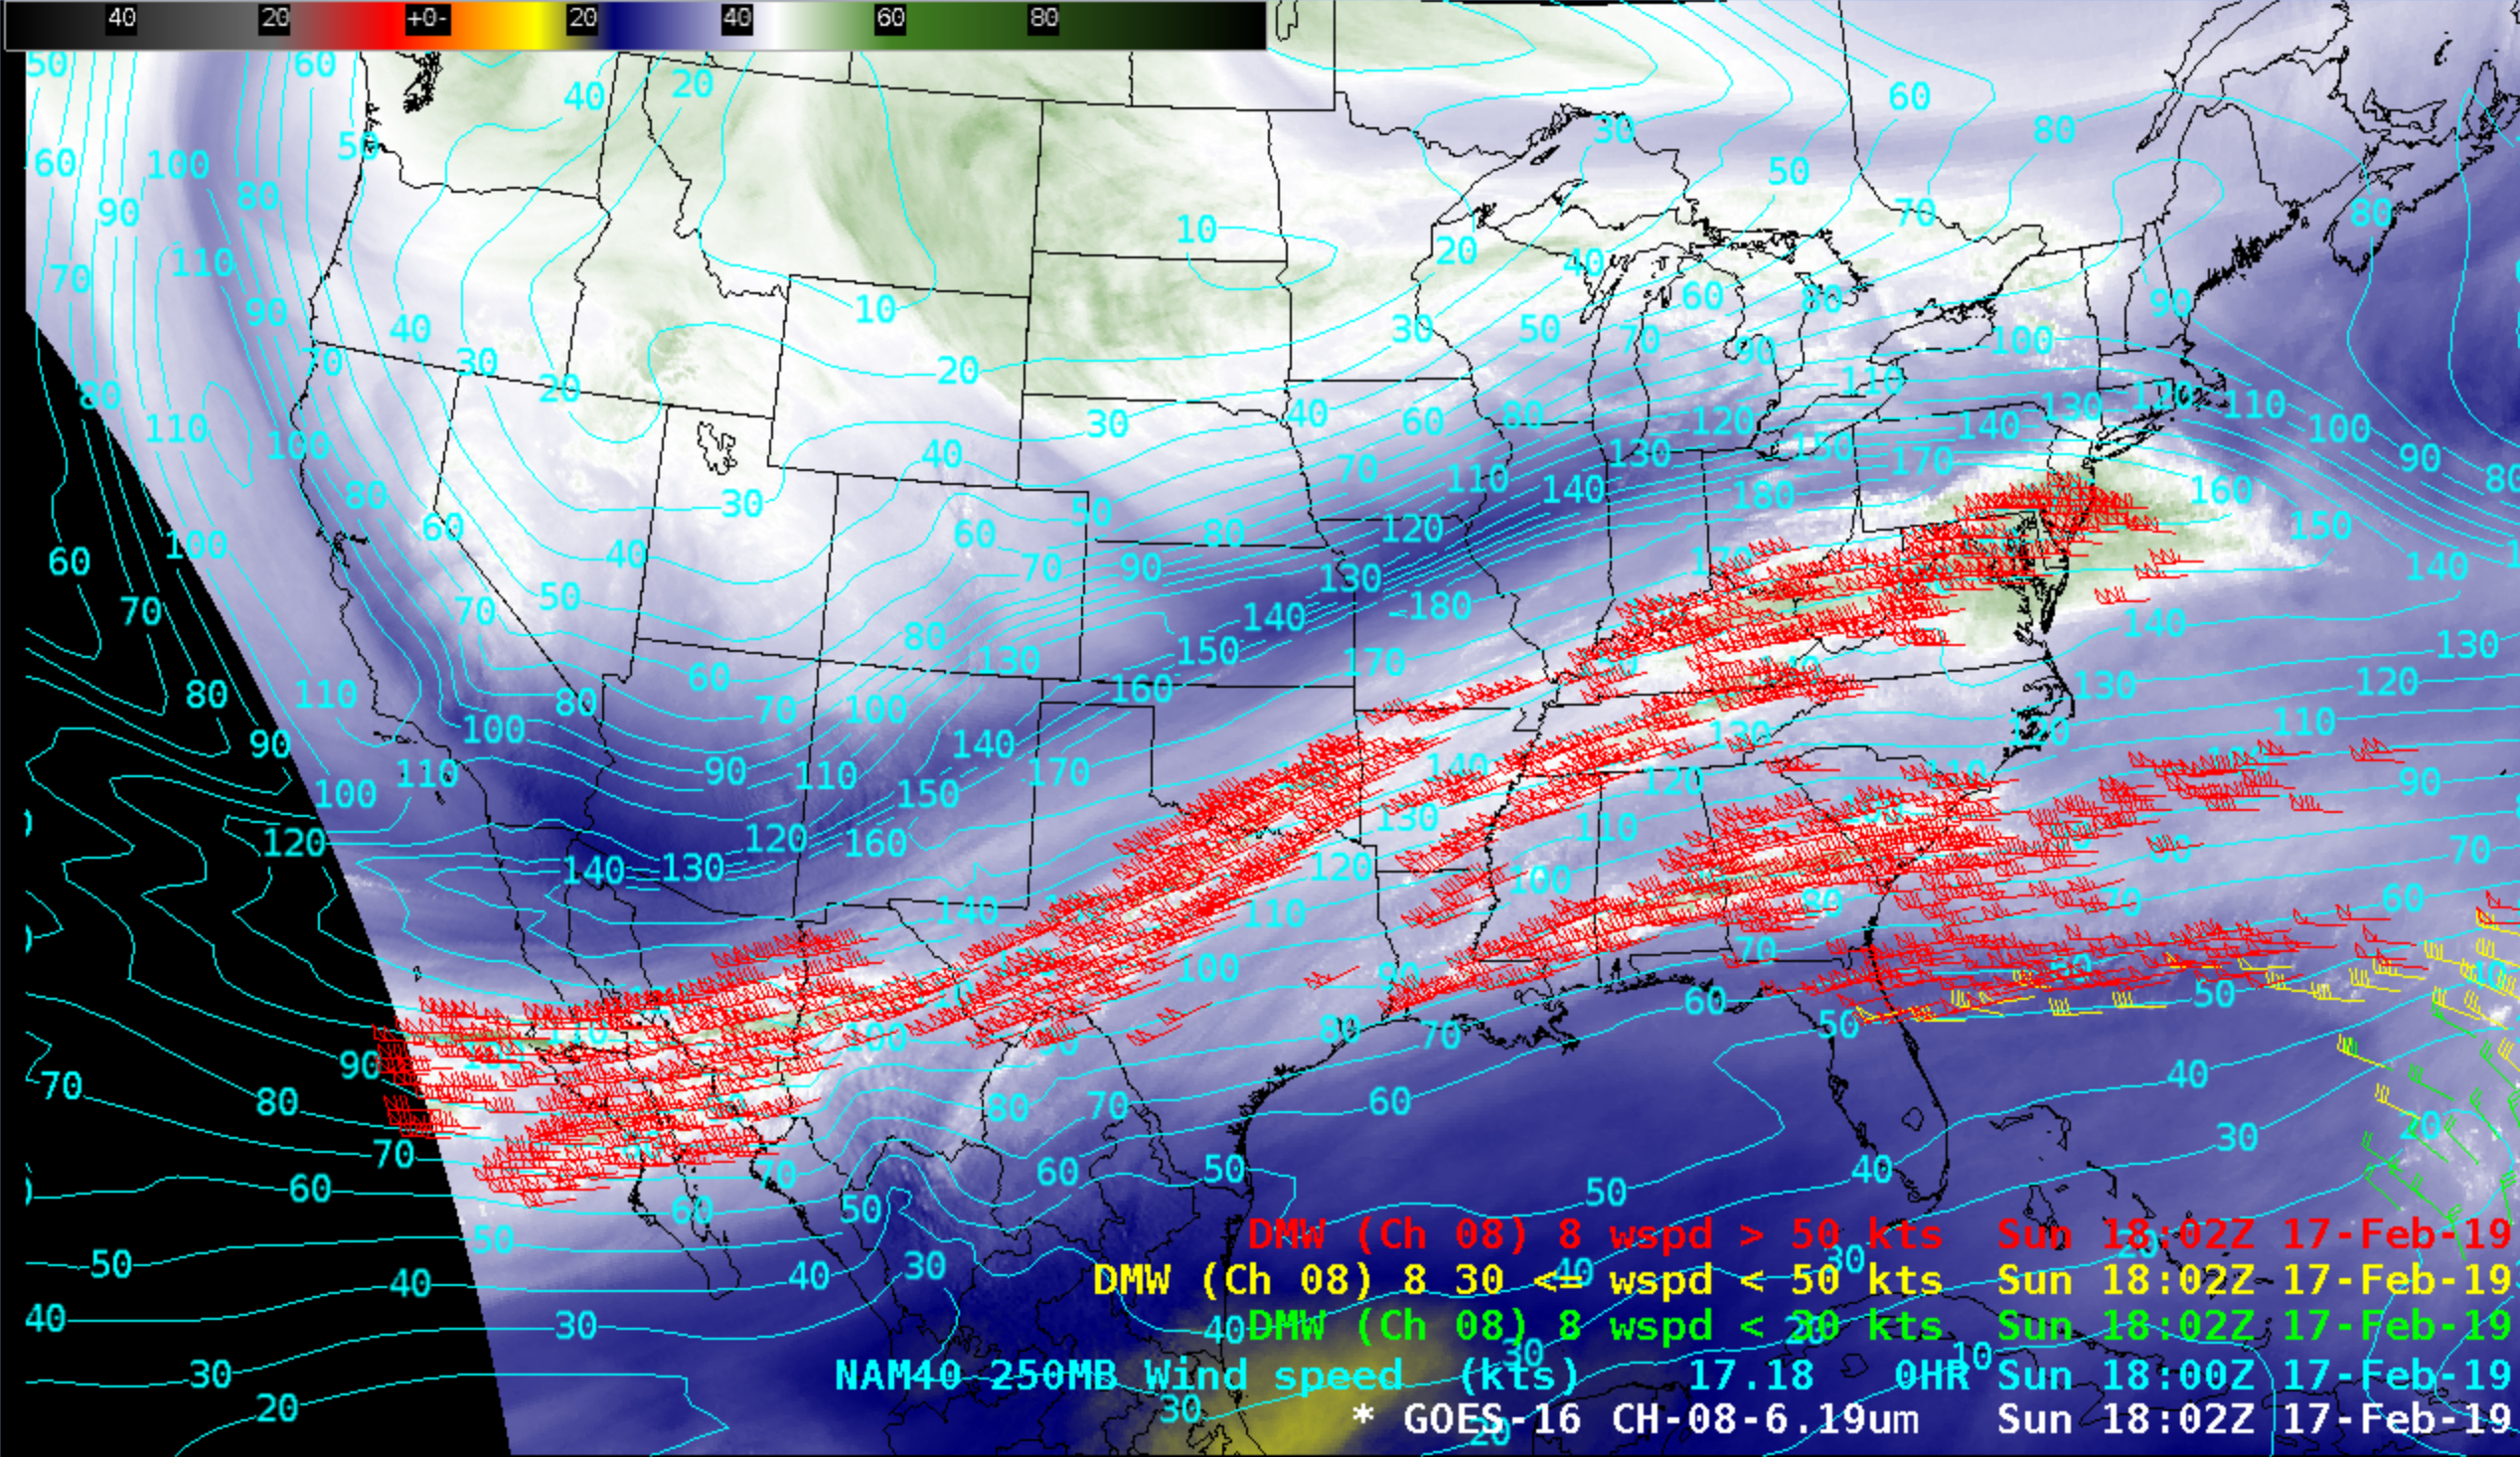
GOES-16 Upper-level Water Vapor (6.2 µm) images, with plots of Derived Motion Winds [click to play animation | MP4]
An unusually strong jet streak was located over the Lower 48 states on
17 February 2019. GOES-16
(GOES-East) Upper-level Water Vapor (
6.2 µm) images with plots of 6.2 µm
Derived Motion Winds (above) showed numerous tracked targets along and south of the
jet axis — within the jet streak exit region over the Mid-Atlantic states, some velocity values were as high as 181 knots
(below).
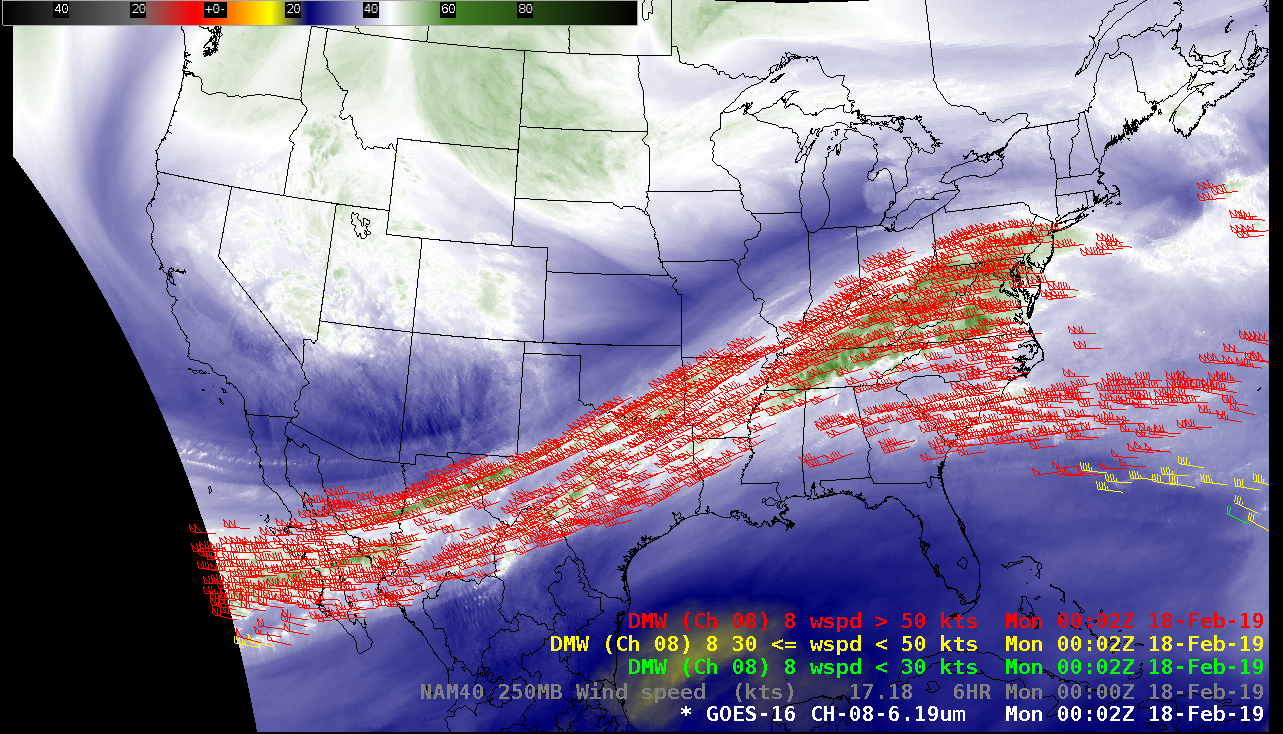
![GOES-16 Upper-level Water Vapor (6.2 µm) image, with plots of Derived Motion Winds at 0002 UTC [click to enlarge]](https://cimss.ssec.wisc.edu/satellite-blog/wp-content/uploads/sites/5/2019/02/190218_0002utc_wvwinds_181kts.png)
GOES-16 Upper-level Water Vapor (6.2 µm) image, with plots of Derived Motion Winds at 0002 UTC [click to enlarge]
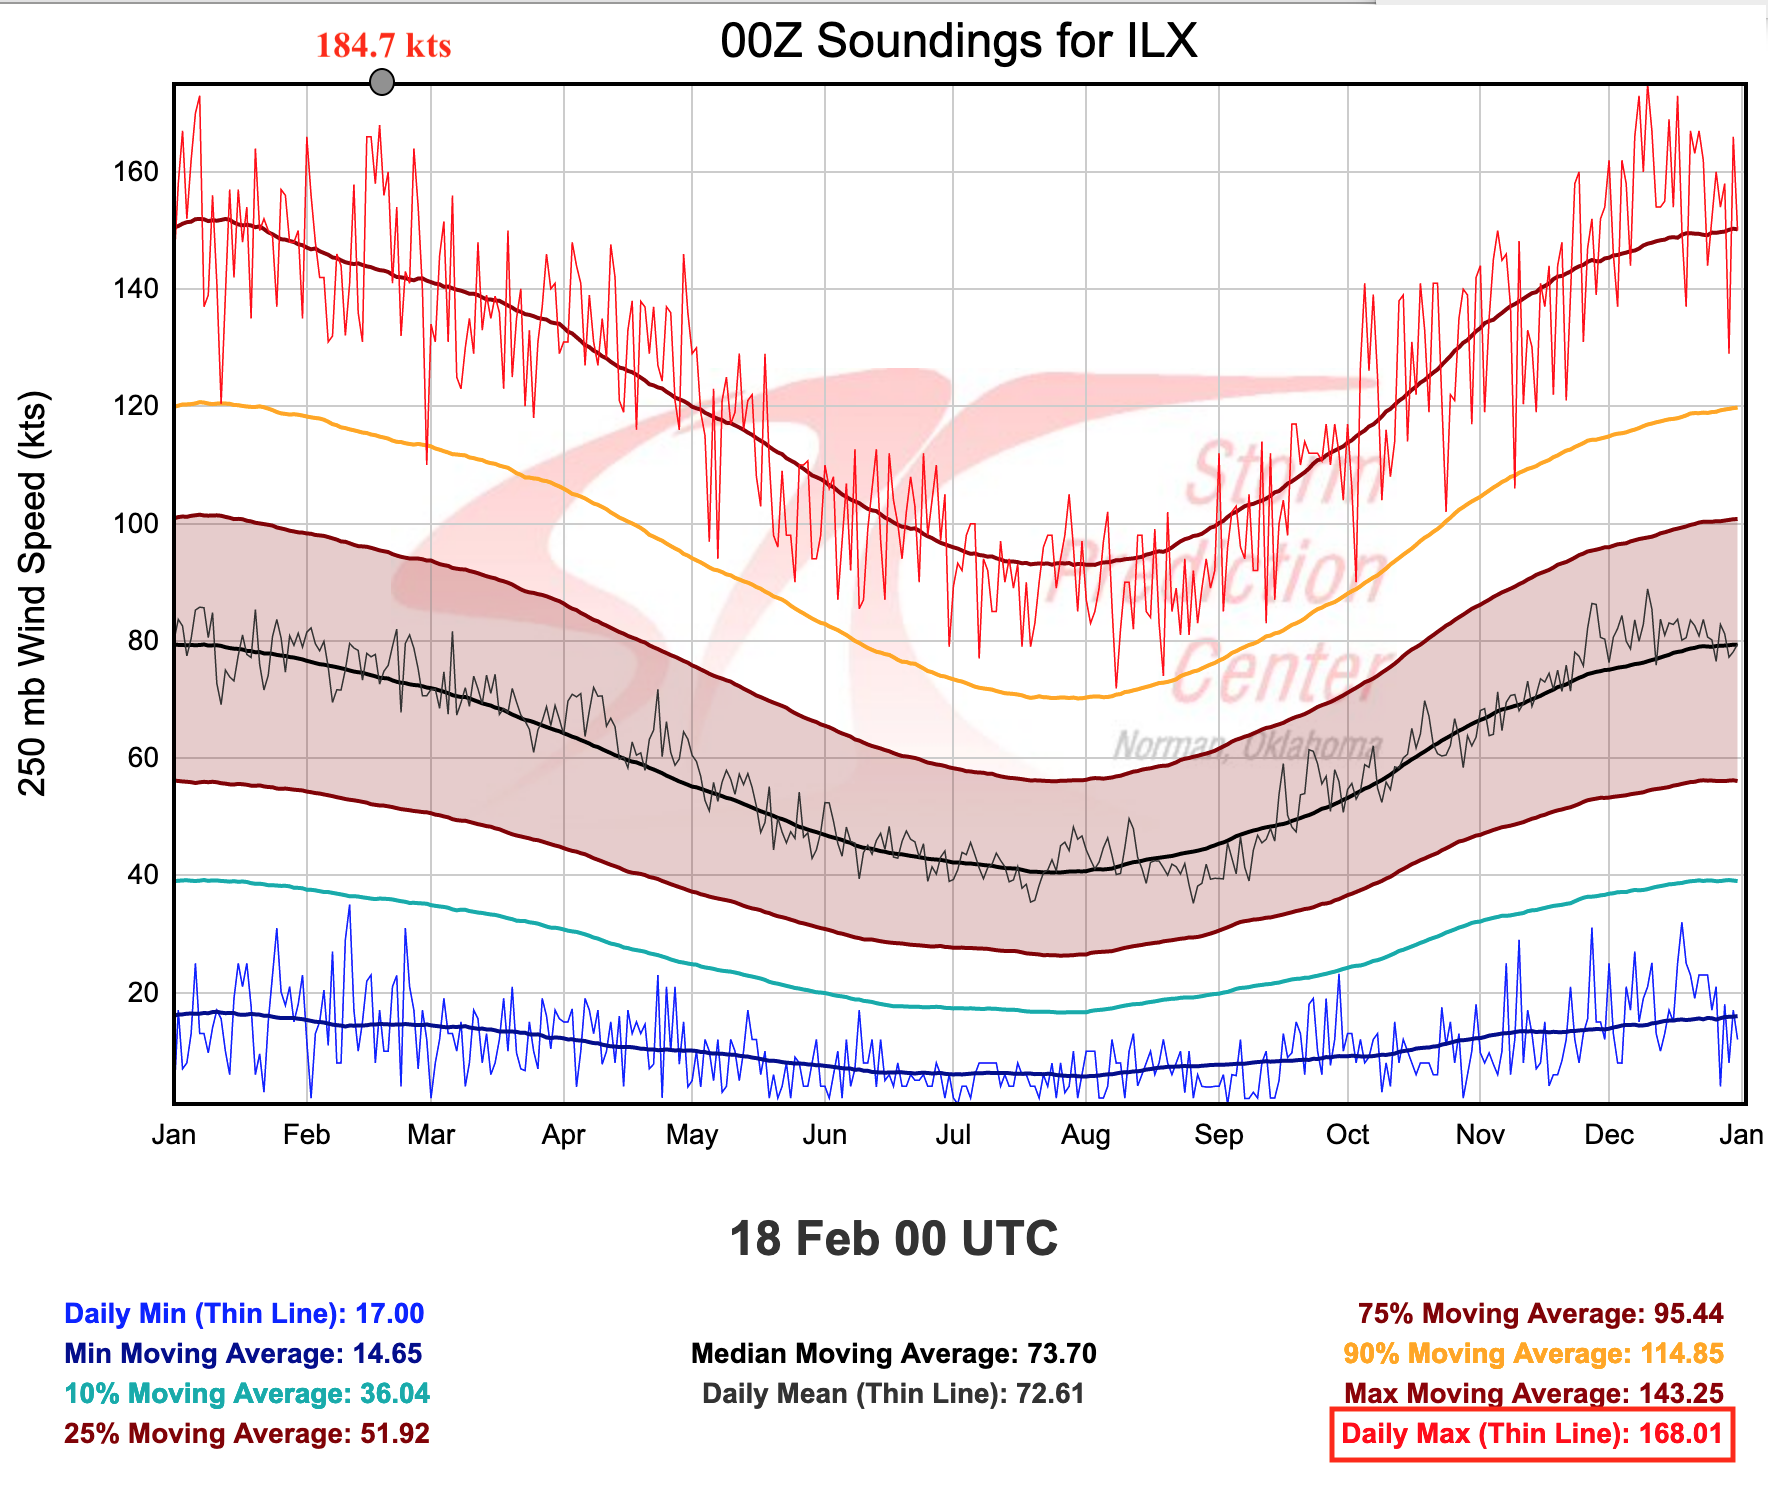
A plot of rawinsonde data from Lincoln, Illinois at 00 UTC
(below) showed wind speeds as high as 190 knots at a pressure of 231 hPa. The 250 hPa wind speed of
184.7 knots set both a daily and an all-time
record speed for that pressure level (the old all-time record was 175 knots for a sounding on 10 Dec at 00 UTC).
![Plot of 00 UTC rawinsonde data from Lincoln, Illinois [click to enlarge]](https://cimss.ssec.wisc.edu/satellite-blog/wp-content/uploads/sites/5/2019/02/190218_00utc_kilx_raob.png)
Plot of 00 UTC rawinsonde data from Lincoln, Illinois [click to enlarge]
GOES-16
Air Mass RGB images from the
AOS site
(below) provided a classic portrayal of the green hues of warm/moist tropical air south of and the orange/red hues of cold/dry polar air north of this strong jet stream.
![GOES-16 Air Mass RGB images [click to play animation | MP4]](https://cimss.ssec.wisc.edu/satellite-blog/wp-content/uploads/sites/5/2019/02/20190218000213_conus.jpg)
GOES-16 Air Mass RGB images [click to play animation | MP4]
===== 18 February Update =====
![GOES-17 "Red" Visible (0.64 µm) and Near-Infrared "Snow/Ice (1.61 µm) images [click to play animation | MP4]](https://cimss.ssec.wisc.edu/satellite-blog/wp-content/uploads/sites/5/2019/02/las_vis-20190218_182218.png)
GOES-17 “Red” Visible (0.64 µm) and Near-Infrared “Snow/Ice (1.61 µm) images [click to play animation | MP4]
The large southward dip of the polar jet stream — evident in the GOES-16 Air Mass RGB images from the previous day — brought cold air into the Desert Southwest, resulting in
snowfall at lower-elevation locations such as Las Vegas, Nevada. GOES-17 “Red” Visible (
0.64 µm) and Near-Infrared “Snow/Ice (
1.61 µm) images
(above) revealed snow on the ground in the Las Vegas area — much of which quickly melted with increased surface heating after sunrise. Snow cover is a good absorber of radiation at the 1.61 µm wavelength, so it appeared as darker shades of gray on the Snow/Ice images; the distribution of the heavier snowfall amounts (which naturally melted more slowly) was influenced by the
topography of the area. This snowfall forced the closure of Interstate 15 from Las Vegas to the Nevada/California border for several hours due to icy pavement and multiple traffic accidents.
The snow cover was apparent in Visible imagery from 4 GOES (below) — GOES-17 (GOES-West), GOES-15 (the backup GOES-West), GOES-16 (GOES-East) and GOES-13 (the backup GOES-East, which had been brought out of storage for annual maintenance activities).
![Visible images from GOES-17, GOES-15, GOES-15 and GOES-13 [click to play animation | MP4]](https://cimss.ssec.wisc.edu/satellite-blog/wp-content/uploads/sites/5/2019/02/G17_G15_G16_G13_VIS_LAS_18FEB2019_2019049_190218_GOES-13_0004PANELS.GIF)
Visible images from GOES-17, GOES-15, GOES-15 and GOES-13 [click to play animation | MP4]
View only this post
Read Less

![GOES-16 Mid-level Water Vapor (6.9 µm) images [click to play animation]](https://cimss.ssec.wisc.edu/satellite-blog/wp-content/uploads/sites/5/2019/02/190219_goes16_waterVapor_Full_Disk_anim.gif)
![GOES-16 "Red" Visible (0.64 µm) and Mid-level Water Vapor (6.9 µm) images [click to play animation]](https://cimss.ssec.wisc.edu/satellite-blog/wp-content/uploads/sites/5/2019/02/190219_goes16_visible_waterVapor_Atlantic_low_anim.gif)
![GOES-16 Air Mass RGB images [click to play animation | MP4]](https://cimss.ssec.wisc.edu/satellite-blog/wp-content/uploads/sites/5/2019/02/190219_goes16_airmassRGB_anim.gif)
![GOES-17 "Red" Visible (0.64 µm) images [click to play animation]](https://cimss.ssec.wisc.edu/satellite-blog/wp-content/uploads/sites/5/2019/02/190219_goes17_visible_Full_Disk_anim.gif)
![GOES-17 Mid-level Water Vapor (6.9 µm) images [click to play animation]](https://cimss.ssec.wisc.edu/satellite-blog/wp-content/uploads/sites/5/2019/02/190219_goes17_waterVapor_Full_Disk_anim.gif)
![GOES-17 Low-level (7.3 µm) and Mid-level (6.9 µm) Water Vapor images [click to play animation]](https://cimss.ssec.wisc.edu/satellite-blog/wp-content/uploads/sites/5/2019/02/190219_goes17_waterVapor_Aleutians_anim.gif)
![GOES-17 Air Mass RGB images [click to play animation | MP4]](https://cimss.ssec.wisc.edu/satellite-blog/wp-content/uploads/sites/5/2019/02/190219_goes17_airmassRGB_Alaska_anim.gif)


![GOES-16 Upper-level Water Vapor (6.2 µm) images, with plots of Derived Motion Winds [click to play animation | MP4]](https://cimss.ssec.wisc.edu/satellite-blog/wp-content/uploads/sites/5/2019/02/190217_goes16_waterVapor_derivedMotionWinds_anim.gif)
![GOES-16 Air Mass RGB images [click to play animation | MP4]](https://cimss.ssec.wisc.edu/satellite-blog/wp-content/uploads/sites/5/2019/02/190217_goes16_airmassRGB_anim.gif)
![GOES-17 "Red" Visible (0.64 µm) and Near-Infrared "Snow/Ice (1.61 µm) images [click to play animation | MP4]](https://cimss.ssec.wisc.edu/satellite-blog/wp-content/uploads/sites/5/2019/02/190218_goes17_visible_snowIce_Las_Vegas_NV_anim.gif)
![Visible images from GOES-17, GOES-15, GOES-15 and GOES-13 [click to play animation | MP4]](https://cimss.ssec.wisc.edu/satellite-blog/wp-content/uploads/sites/5/2019/02/190218_goes17_goes15_goes16_goes13_Las_Vegas_NV_anim.gif)
