GOES-16 “Red” Visible (0.64 µm) images (above) revealed a cloud-free notch over northeastern Indiana during the early morning hours on 16 February 2019. The corresponding GOES-16 Cloud Top Phase product (below) indicated that the cloud layer across that region was composed of supercooled water cloud droplets. The point source of this cloud notch... Read More
![GOES-16 "Red" Visible (0.64 µm) images [click to play animation | MP4]](https://cimss.ssec.wisc.edu/satellite-blog/wp-content/uploads/sites/5/2019/02/in_vis-20190216_140213.png)
GOES-16 “Red” Visible (0.64 µm) images [click to play animation | MP4]
GOES-16 “Red” Visible (
0.64 µm) images
(above) revealed a cloud-free notch over northeastern Indiana during the early morning hours on 16 February 2019. The corresponding GOES-16
Cloud Top Phase product
(below) indicated that the cloud layer across that region was composed of supercooled water cloud droplets. The point source of this cloud notch feature was the
Steel Dynamics industrial site southeast of Columbia City — emissions from this location contained particles that acted as efficient ice condensation nuclei, causing the supercooled droplets to glaciate and fall from the cloud as snow. The cloud notch initially passed over Huntington (located about 15 miles to the south), and the
Northern Indiana NWS office received a report of
ice crystals or fine snow and hazy sunshine when the clearing moved over that location. The automated ASOS sensor at the Huntington airport did not report any snow, but the visibility briefly dropped to
7 miles with a lowering of cloud height just after 14 UTC.
![GOES-16 Cloud Top Phase product [click to play animation | MP4]](https://cimss.ssec.wisc.edu/satellite-blog/wp-content/uploads/sites/5/2019/02/in_cloud_phase-20190216_140213.png)
GOES-16 Cloud Top Phase product [click to play animation | MP4]
Farther to the east, GOES-16 Visible images
(below) showed prominent industrial plumes coming from the Detroit, Michigan and Cleveland, Ohio areas — with smaller plumes originating from points southeast of Lorain and southwest of Canton in Ohio. Light snow was intermittently reported at 2 sites south of Detroit as the industrial plume passed overhead. As with the previous case over Indiana, these industrial plumes were occurring within a
supercooled water droplet cloud layer.
![GOES-16 "Red" Visible (0.64 µm) images [click to play animation | MP4]](https://cimss.ssec.wisc.edu/satellite-blog/wp-content/uploads/sites/5/2019/02/det_cle_vis-20190216_140213.png)
GOES-16 “Red” Visible (0.64 µm) images [click to play animation | MP4]
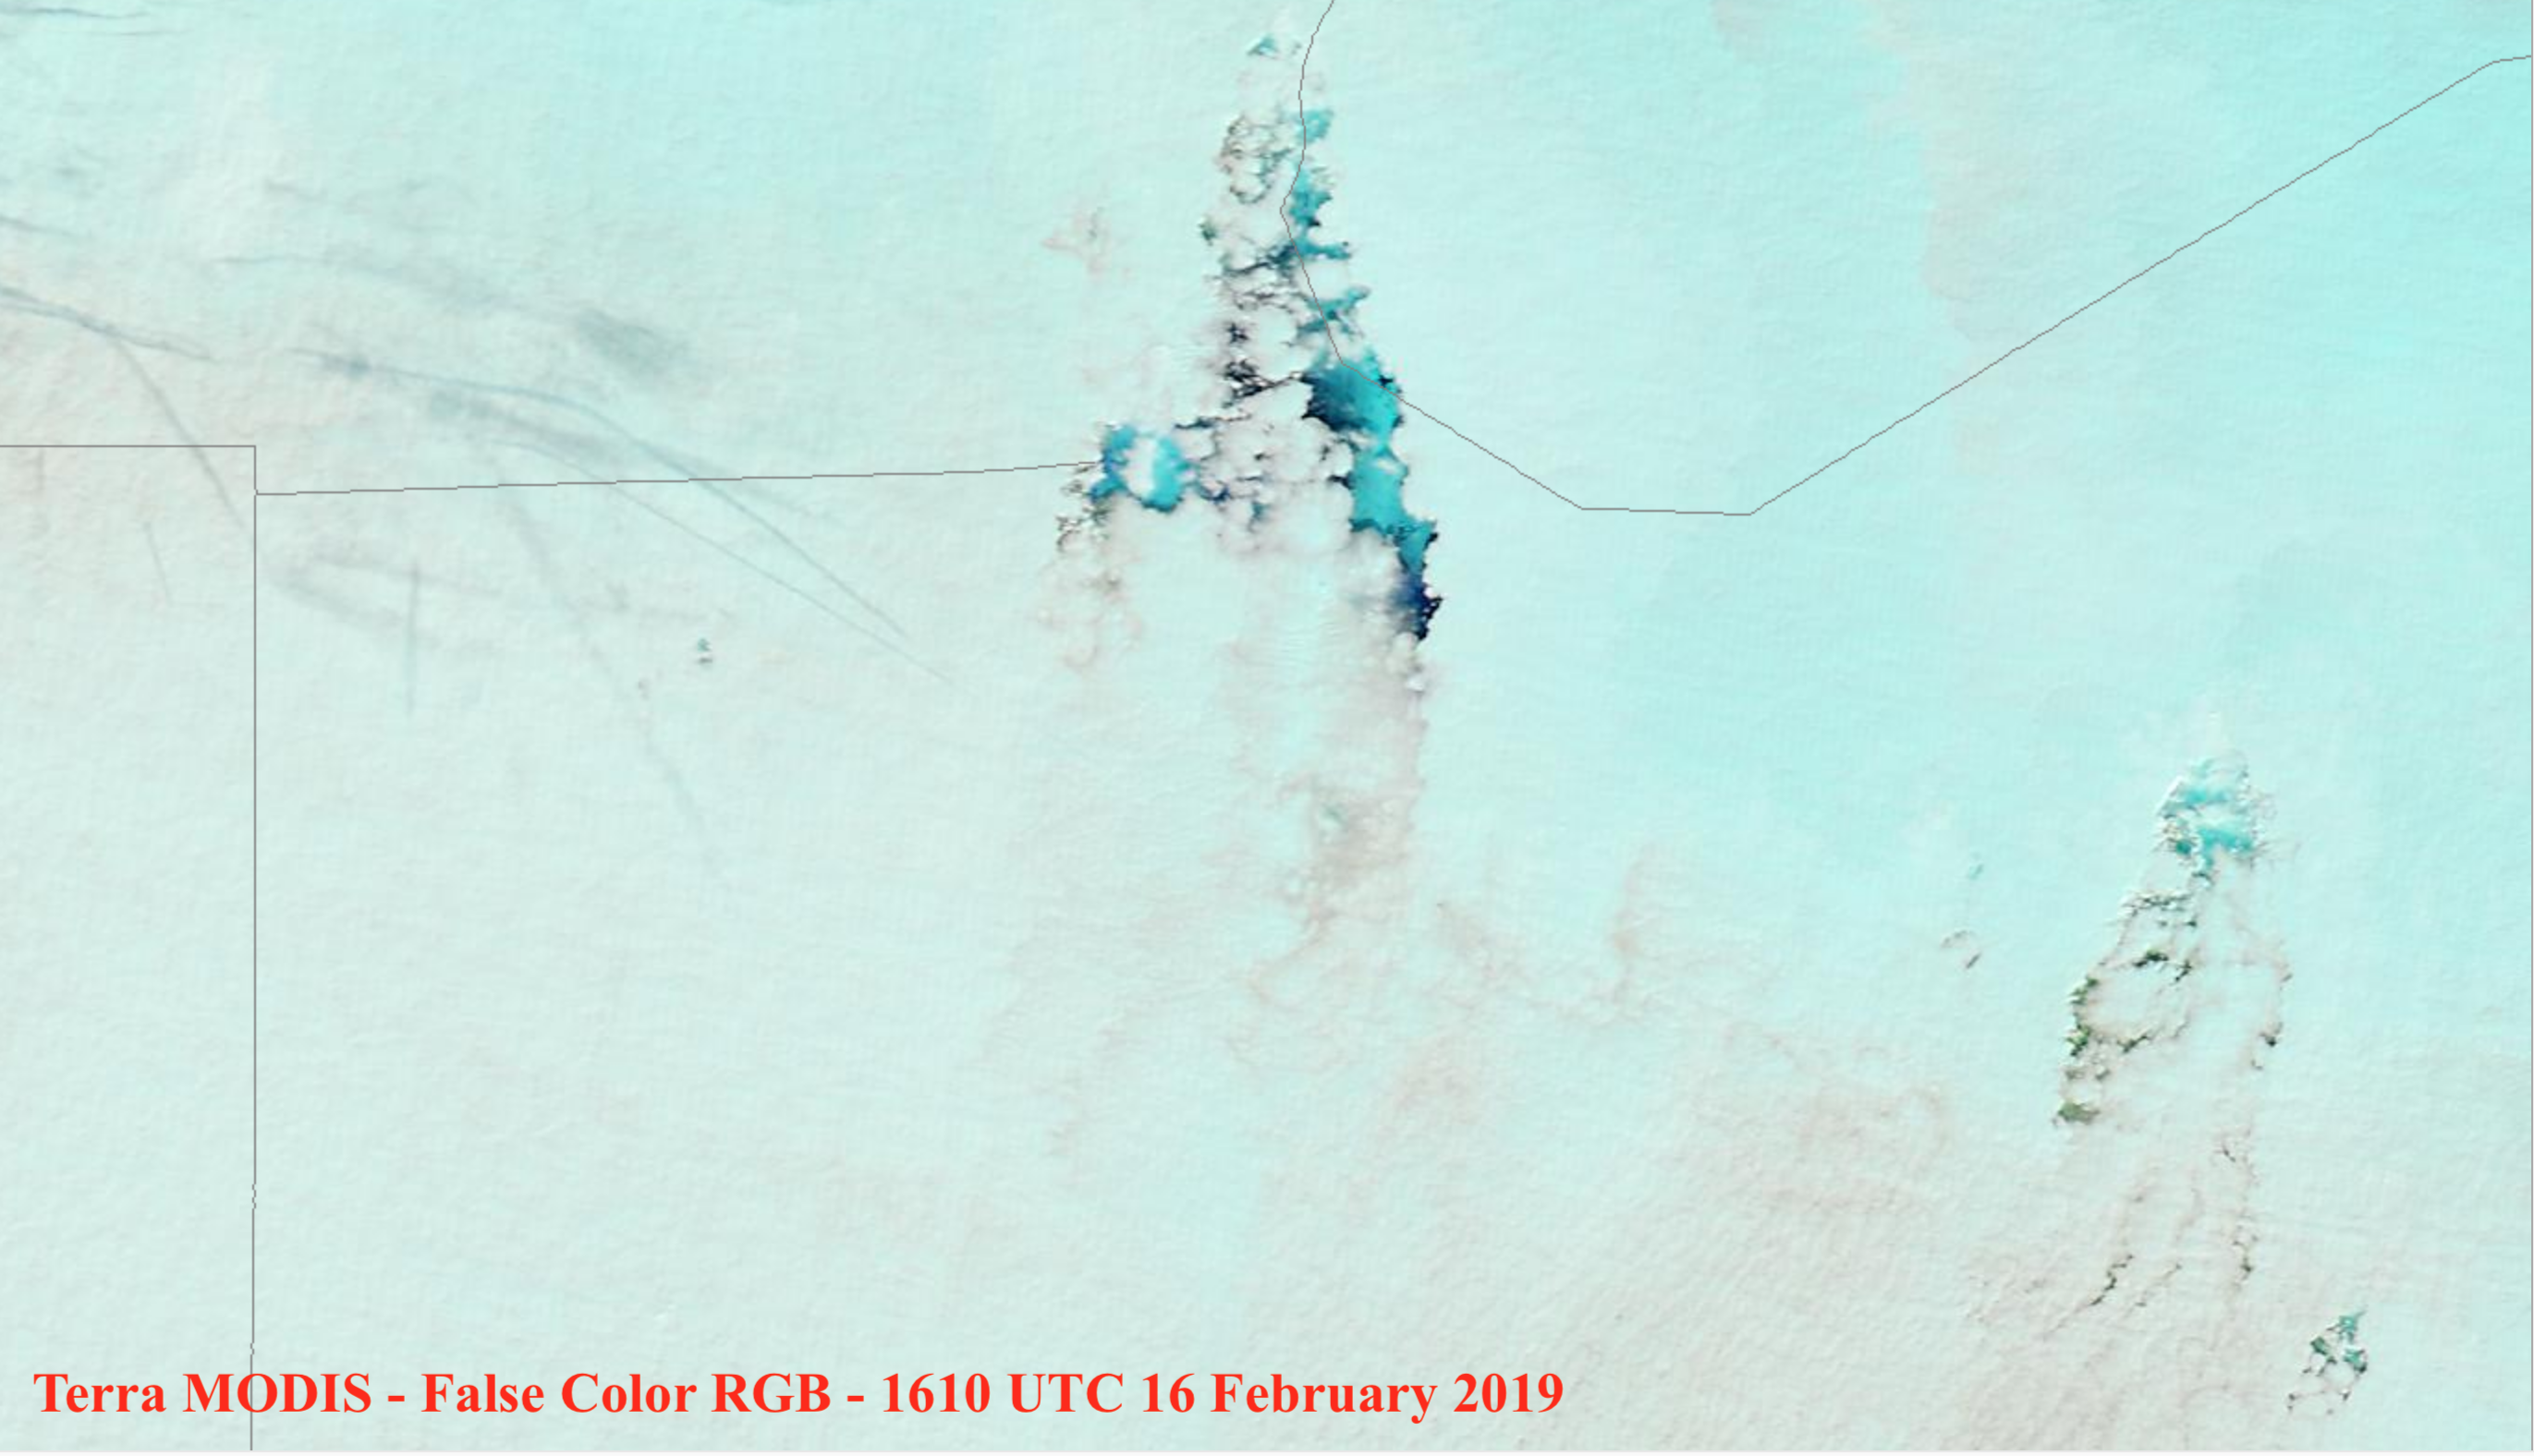
250-meter resolution Terra MODIS True Color and False Color Red-Green-Blue (RGB) images from the
MODIS Today site
(below) provided a more detailed view of the industrial plumes coming from the Detroit and Cleveland areas. The darker cyan color appearing within the cloud gaps was a signature of glaciated cloud material that was descending from the
supercooled cloud layer, falling as snow. Since there was no snow on the ground
reported that morning at Detroit in Michigan or at Cleveland and Akron in Ohio, we can be confident that the dark cyan was not a signature of surface snow cover being viewed through gaps in the cloud deck.
![Terra MODIS True Color and False Color RGB images [click to enlarge]](https://cimss.ssec.wisc.edu/satellite-blog/wp-content/uploads/sites/5/2019/02/190216_1610utc_terra_modis_truecolor_falsecolor_MI_OH_industrial_plumes_anim.gif)
Terra MODIS True Color and False Color RGB images at 1610 UTC [click to enlarge]
In a larger-scale view of Terra MODIS True Color and False Color RGB images from
RealEarth (below), note the presence of another industrial plume with its point source south of Sarnia, Ontario — in contrast to the other industrial plumes, the emissions from that source contained particles which acted as cloud condensation nuclei — causing the supercooled cloud water droplets to become
smaller, which made them more reflective and exhibit a brighter white appearance in the RGB images.
![Terra MODIS True Color and False Color RGB images [click to enlarge]](https://cimss.ssec.wisc.edu/satellite-blog/wp-content/uploads/sites/5/2019/02/190216_1601utc_terra_modis_truecolor_falsecolor_anim.gif)
Terra MODIS True Color and False Color RGB images [click to enlarge]
Looking at the Ontario plume using GOES-16 Visible, Near-Infrared “Snow/Ice” (
1.61 µm) and Near-Infrared “Cloud Particle Size” (
2.24 µm) imagery
(below), higher reflectivity of the smaller supercooled water droplets within the industrial plume is most apparent in the Near-Infrared images. This plume passed over Chatham, Ontario (
CYCK), where light snow was reported — though it’s unclear whether this snow was simply ongoing synoptic system and/or lake effect snow, or if there was some minor plume enhancement aiding the snowfall.
![GOES-16 "Red" Visible (0.64 µm, left), Near-Infrared "Snow/Ice" (1.61 µm, center) and Near-Infrared "Cloud Particle Size" (2.24 µm, right) images [click to play animation | MP4]](https://cimss.ssec.wisc.edu/satellite-blog/wp-content/uploads/sites/5/2019/02/G16_VIS_NIR_ONT_PLUME_16FEB2019_2019047_140213_GOES-16_0003PANELS.GIF)
GOES-16 “Red” Visible (0.64 µm, left), Near-Infrared “Snow/Ice” (1.61 µm, center) and Near-Infrared “Cloud Particle Size” (2.24 µm, right) images [click to play animation | MP4]
The Ontario industrial plume also exhibited a
warmer signature on GOES-16 Shortwave Infrared (
3.9 µm) images
(below), since smaller supercooled water droplets are more efficient reflectors of incoming solar radiation.
![GOES-16 Near-Infrared "Snow/Ice" (1.61 µm, left) and Near-Infrared "Cloud Particle Size" (2.24 µm, center) and Shortwave Infrared (3.9 µm, right) images [click to play animation | MP4]](https://cimss.ssec.wisc.edu/satellite-blog/wp-content/uploads/sites/5/2019/02/G16_NIR_SWIR_ONT_PLUME_16FEB2019_2019047_140213_GOES-16_0003PANELS.GIF)
GOES-16 Near-Infrared “Snow/Ice” (1.61 µm, left), and Near-Infrared “Cloud Particle Size” (2.24 µm, center) and Shortwave Infrared (3.9 µm, right) images [click to play animation | MP4]
View only this post
Read Less
![GOES-16 "Red" Visible (0.64 µm) images [click to play animation | MP4]](https://cimss.ssec.wisc.edu/satellite-blog/wp-content/uploads/sites/5/2019/02/190216_goes16_visible_IN_industrial_plume_anim.gif)
![GOES-16 Cloud Top Phase product [click to play animation | MP4]](https://cimss.ssec.wisc.edu/satellite-blog/wp-content/uploads/sites/5/2019/02/190216_goes16_cloudPhase_IN_industrial_plume_anim.gif)
![GOES-16 "Red" Visible (0.64 µm) images [click to play animation | MP4]](https://cimss.ssec.wisc.edu/satellite-blog/wp-content/uploads/sites/5/2019/02/190216_goes16_visible_MI_OH_industrial_plumes_anim.gif)
![GOES-16 "Red" Visible (0.64 µm, left), Near-Infrared "Snow/Ice" (1.61 µm, center) and Near-Infrared "Cloud Particle Size" (2.24 µm, right) images [click to play animation | MP4]](https://cimss.ssec.wisc.edu/satellite-blog/wp-content/uploads/sites/5/2019/02/190216_goes16_visible_nearInfrared_Ontario_plume_anim.gif)
![GOES-16 Near-Infrared "Snow/Ice" (1.61 µm, left) and Near-Infrared "Cloud Particle Size" (2.24 µm, center) and Shortwave Infrared (3.9 µm, right) images [click to play animation | MP4]](https://cimss.ssec.wisc.edu/satellite-blog/wp-content/uploads/sites/5/2019/02/190216_goes16_nearInfrared_shortwaveInfrared_Ontario_plume_anim.gif)

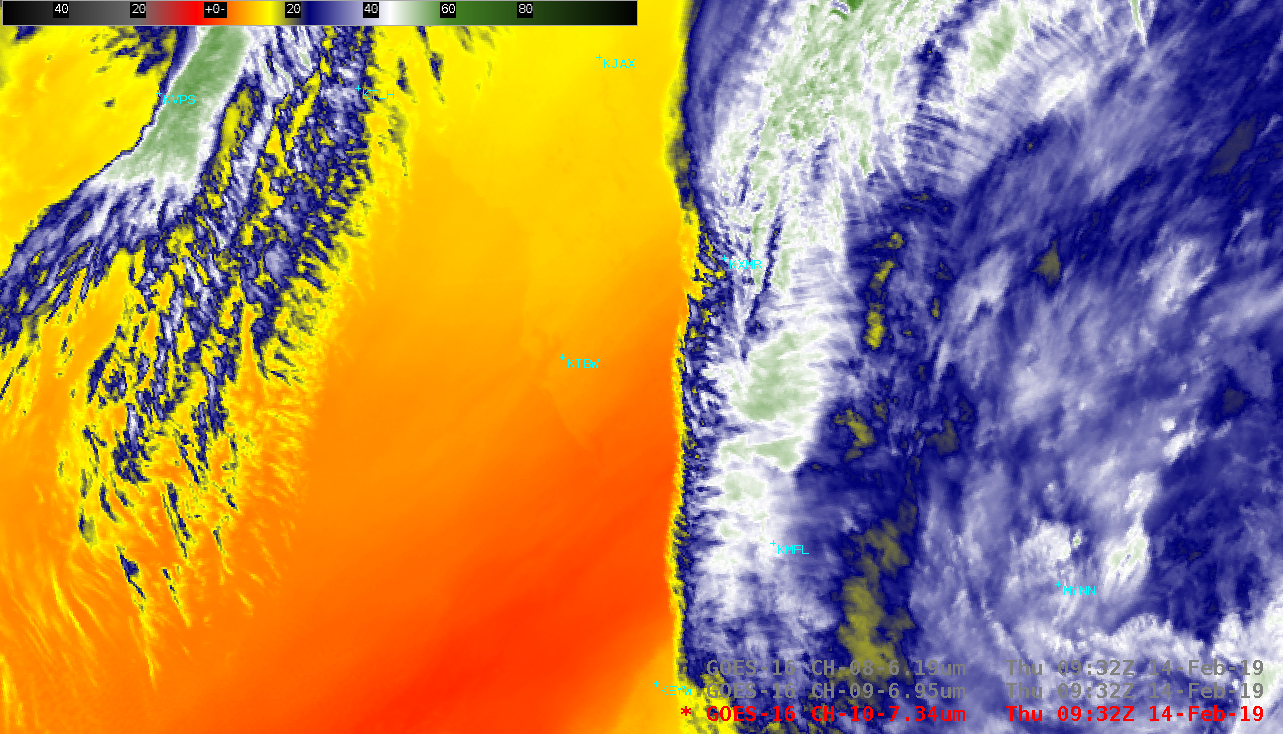
![GOES-16 Low-level Water Vapor (7.3 µm) images, with and without a map overlay; rawinsonde sites are plotted in cyan [click to play animation | MP4]](https://cimss.ssec.wisc.edu/satellite-blog/wp-content/uploads/sites/5/2019/02/190214_goes16_waterVapor_FL_dry_air_anim.gif)
![Plot of mean and extreme Total Precipitable Water values for Tampa, Florida [click to enlarge]](https://cimss.ssec.wisc.edu/satellite-blog/wp-content/uploads/sites/5/2019/02/190214_12utc_ktbw_raob_tpw.png)
![GOES-16 Total Precipitable Water product at 1207 UTC [click to enlarge]](https://cimss.ssec.wisc.edu/satellite-blog/wp-content/uploads/sites/5/2019/02/G16TPW-20190214_120713.png)
![Plots of GOES-16 Water Vapor weighting functions calculated from 00 UTC and 12 UTC rawinsonde data from Tampa, Florida [click to enlarge]](https://cimss.ssec.wisc.edu/satellite-blog/wp-content/uploads/sites/5/2019/02/190214_ktbw_waterVapor_weightingFunctions_anim.gif)
