VIIRS Day/Night Band (0.7 µm) and Infrared Window (11.45 µm) images from NOAA-20 at 1502 UTC (above) and from Suomi NPP at 1552 UTC (below) showed Category 2 Typhoon Wutip in the West Pacific Ocean (southeast of Guam) on 21 February 2019. With Moon in the Waning Gibbous phase (at... Read More
![NOAA-20 VIIRS Day/Night Band (0.7 µm) and Infrared Window (11.45 µm) images at 1502 UTC [click to enlarge]](https://cimss.ssec.wisc.edu/satellite-blog/wp-content/uploads/sites/5/2019/02/190221_1502utc_noaa20_viirs_dayNightBand_infraredWindow_Typhoon_Wutip_anim.gif)
NOAA-20 VIIRS Day/Night Band (0.7 µm) and Infrared Window (11.45 µm) images at 1502 UTC [click to enlarge]
VIIRS Day/Night Band (0.7 µm) and Infrared Window (11.45 µm) images from NOAA-20 at 1502 UTC
(above) and from Suomi NPP at 1552 UTC
(below) showed Category 2 Typhoon Wutip in the West Pacific Ocean
(southeast of Guam) on 21 February 2019. With Moon in the Waning Gibbous phase
(at 95% of Full), ample illumination was provided to highlight the “visible image at night” capability of the Day/Night Band.
Notable features included deep convection near the storm’s center of circulation (with the presence of subtle cloud-top gravity waves), and transverse banding along the eastern periphery of the cold central dense overcast. Bright pixels seen in the Suomi NPP Day/Night Band image were the result of clouds being illuminated by lightning activity. VIIRS images courtesy of William Straka, CIMSS.
![Suomi NPP VIIRS Day/Night Band (0.7 µm) and Infrared Window (11.45 µm) images at 1552 UTC [click to enlarge]](https://cimss.ssec.wisc.edu/satellite-blog/wp-content/uploads/sites/5/2019/02/190221_1552utc_suomiNPP_viirs_dayNightBand_infraredWindow_Typhoon_Wutip_anim.gif)
Suomi NPP VIIRS Day/Night Band (0.7 µm) and Infrared Window (11.45 µm) images at 1552 UTC [click to enlarge]
===== 22 February Update =====
![Himawari-8 Infrared Window (10.4 µm) images [click to play MP4 animation]](https://cimss.ssec.wisc.edu/satellite-blog/wp-content/uploads/sites/5/2019/02/HIM08_IR_WUTIP_22FEB2019_2019053_121215_HIMAWARI-8_0001PANEL.GIF)
Himawari-8 Infrared Window (10.4 µm) images [click to play MP4 animation]
Typhoon Wutip intensified to a Category 3 storm on 22 February (
ADT |
SATCON) — rapid scan
JMA Himawari-8 Infrared Window (10.4 µm) images at 2.5 minute intervals
(above) revealed cloud-top infrared brightness temperatures of -90ºC and colder
(yellow pixels surrounded by darker purple) shortly after
00 UTC. Multiple convective bursts developed around the center of circulation, and evidence of eye formation was seen for a short time beginning around
1137 UTC.
Himawari-8 “Red” Visible (0.64 µm) images of Wutip (below) showed that a distinct cloud-free eye did not form during that time period.
![Himawari-8 "Red" Visible (0.64 µm) images [click to play MP4 animation]](https://cimss.ssec.wisc.edu/satellite-blog/wp-content/uploads/sites/5/2019/02/HIM08_VIS_WUTIP_22FEB2019_2019053_034215_HIMAWARI-8_0001PANEL.GIF)
Himawari-8 “Red” Visible (0.64 µm) images [click to play MP4 animation]
A DMSP-17 SSMIS Microwave (85 GHz) image from the
CIMSS Tropical Cyclones site
(below) showed a nearly complete ring of strong convection around the eye region at 0916 UTC. A 24-hour animation of
MIMIC-TC morphed microwave imagery is available
here.
![DMSP-17 SSMIS Microwave (85 GHz) image [click to enlarge]](https://cimss.ssec.wisc.edu/satellite-blog/wp-content/uploads/sites/5/2019/02/190222_0916utc_dmsp17_ssmis_microwave_Wutip.png)
DMSP-17 SSMIS Microwave (85 GHz) image [click to enlarge]
, Wutip had been moving over water with warm Sea Surface Temperatures and high Ocean Heat Content values
(below).
![Sea Surface Temperature and Ocean Heat Content [click to enlarge]](https://cimss.ssec.wisc.edu/satellite-blog/wp-content/uploads/sites/5/2019/02/190221_sst_ohc_Wutip_anim.gif)
Sea Surface Temperature and Ocean Heat Content [click to enlarge]
===== 23 February Update =====
![Himawari-8 Infrared Window (10.4 µm) images [click to play MP4 animation]](https://cimss.ssec.wisc.edu/satellite-blog/wp-content/uploads/sites/5/2019/02/HIM08_IR_WUTIP_23FEB2019_2019054_120215_HIMAWARI-8_0001PANEL.GIF)
Himawari-8 Infrared Window (10.4 µm) images [click to play MP4 animation]
2.5-minute rapid scan Himawari-8 Infrared Window (10.4 µm) images
(above) revealed the formation of a large and well-define eye with an annular eyewall structure as Wutip rapidly intensified (
ADT |
SATCON) to Category 4 Super Typhoon status on 23 February. Mesovortices could be seen rotating within the eye. Wutip became the most intense February typhoon on record in the Northwest Pacific basin.
In a toggle between NOAA-20 VIIRS Day/Night Band (0.7 µm) and Infrared Window (11.45 µm) images at 1602 UTC (below), these mesovortices were also apparent — with the help of reflected moonlight — in the Day/Night Band.
![NOAA-20 VIIRS Day/Night Band (0.7 µm) and Infrared Window (11.45 µm) images at 1604 UTC [click to enlarge]](https://cimss.ssec.wisc.edu/satellite-blog/wp-content/uploads/sites/5/2019/02/190223_1604utc_noaa20_dayNightBand_infraredWindow_Wutip_anim.gif)
NOAA-20 VIIRS Day/Night Band (0.7 µm) and Infrared Window (11.45 µm) images at 1604 UTC [click to enlarge]
As noted in a
21 UTC discussion from the
JTWC, Wutip had a well-defined poleward outflow channel within the upper troposphere
(below), which was a favorable factor for its intensification.
![Himawari-8 Water Vapor (6.9 µm) images with plots of middle/upper-tropospheric derived motion winds [click to enlarge]](https://cimss.ssec.wisc.edu/satellite-blog/wp-content/uploads/sites/5/2019/02/190223_waterVapor_winds_Wutip_anim.gif)
Himawari-8 Water Vapor (6.9 µm) images with plots of middle/upper-tropospheric derived motion winds [click to enlarge]
View only this post
Read Less
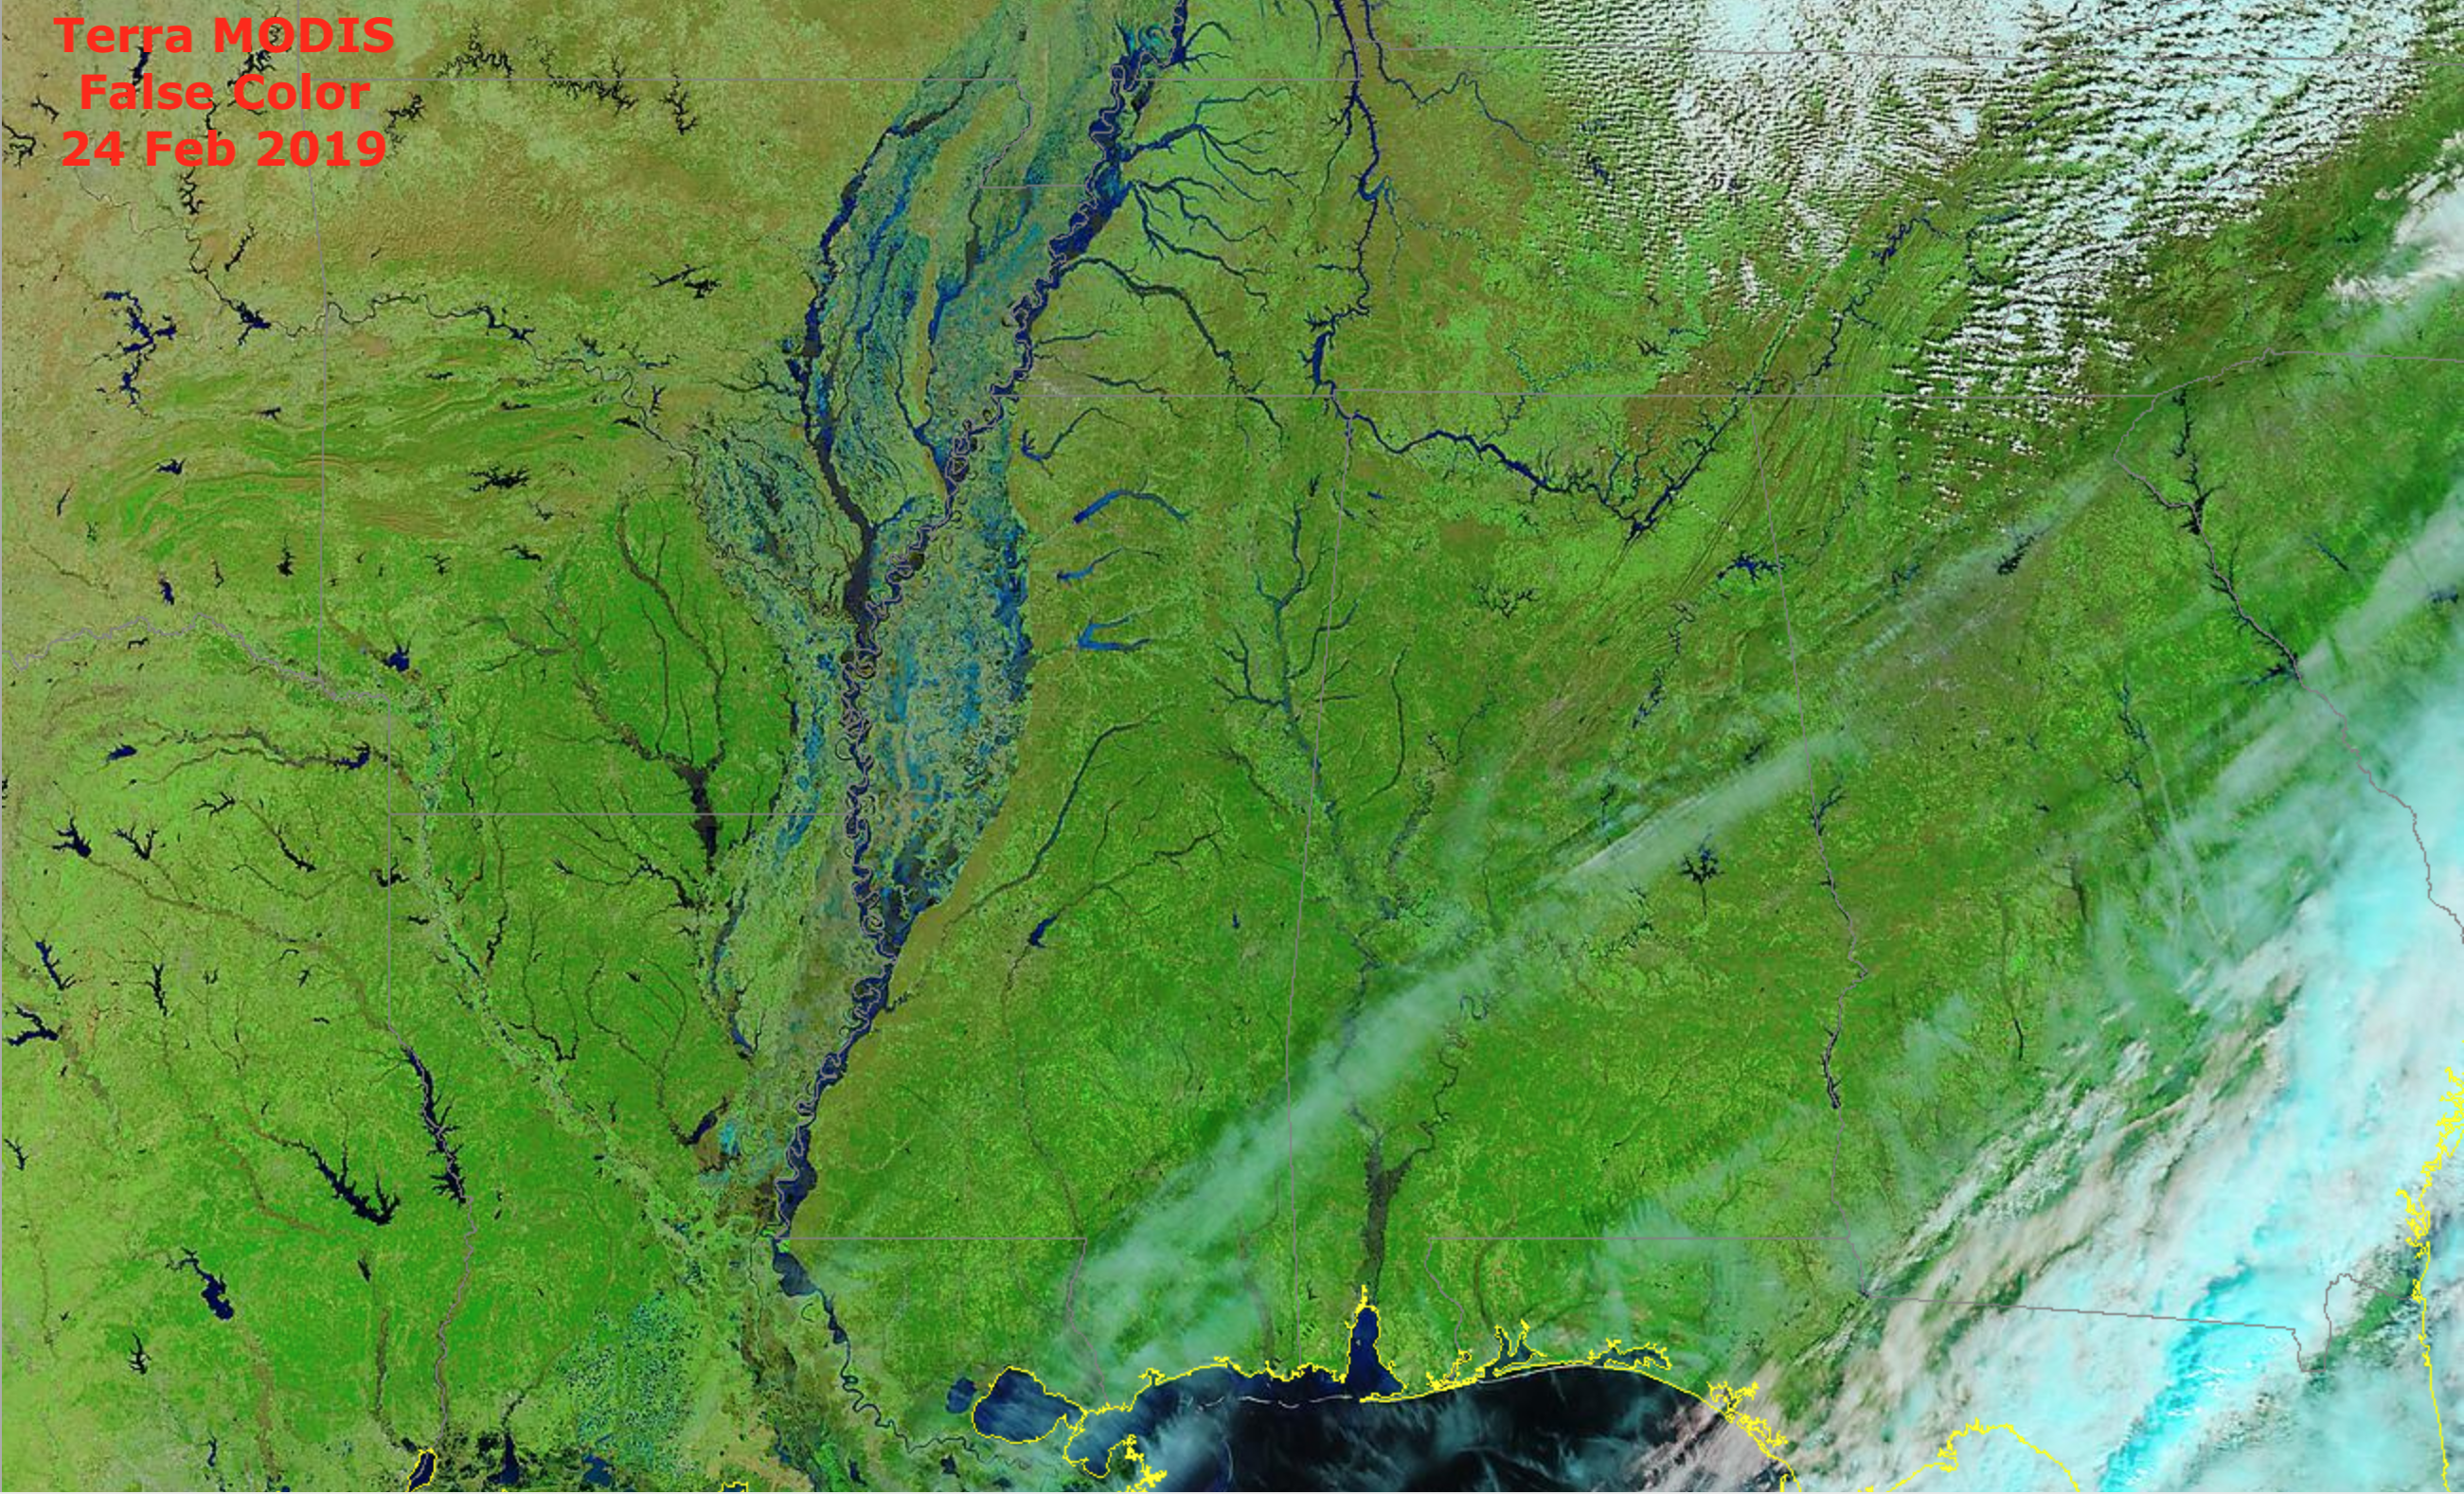
![30-day Precipitation and Percent of Normal Precipitation [click to enlarge]](https://cimss.ssec.wisc.edu/satellite-blog/wp-content/uploads/sites/5/2019/02/190224_30day_precip_percent_normal_MS_Valley_anim.gif)
![Terra MODIS False Color RGB images from 25 January and 24 February 2019 [click to enlarge]](https://cimss.ssec.wisc.edu/satellite-blog/wp-content/uploads/sites/5/2019/02/190125_190224_terra_modis_falsecolor_MS_Valley_anim.gif)
![Terra MODIS True Color and False Color RGB images from 24 February [click to enlarge]](https://cimss.ssec.wisc.edu/satellite-blog/wp-content/uploads/sites/5/2019/02/190224_terra_modis_truecolor_falsecolor_MS_Valley_anim.gif)
![NOAA-20 VIIRS Flood Map [click to enlarge]](https://cimss.ssec.wisc.edu/satellite-blog/wp-content/uploads/sites/5/2019/02/190224_noaa20_viirs_floodmap.png)
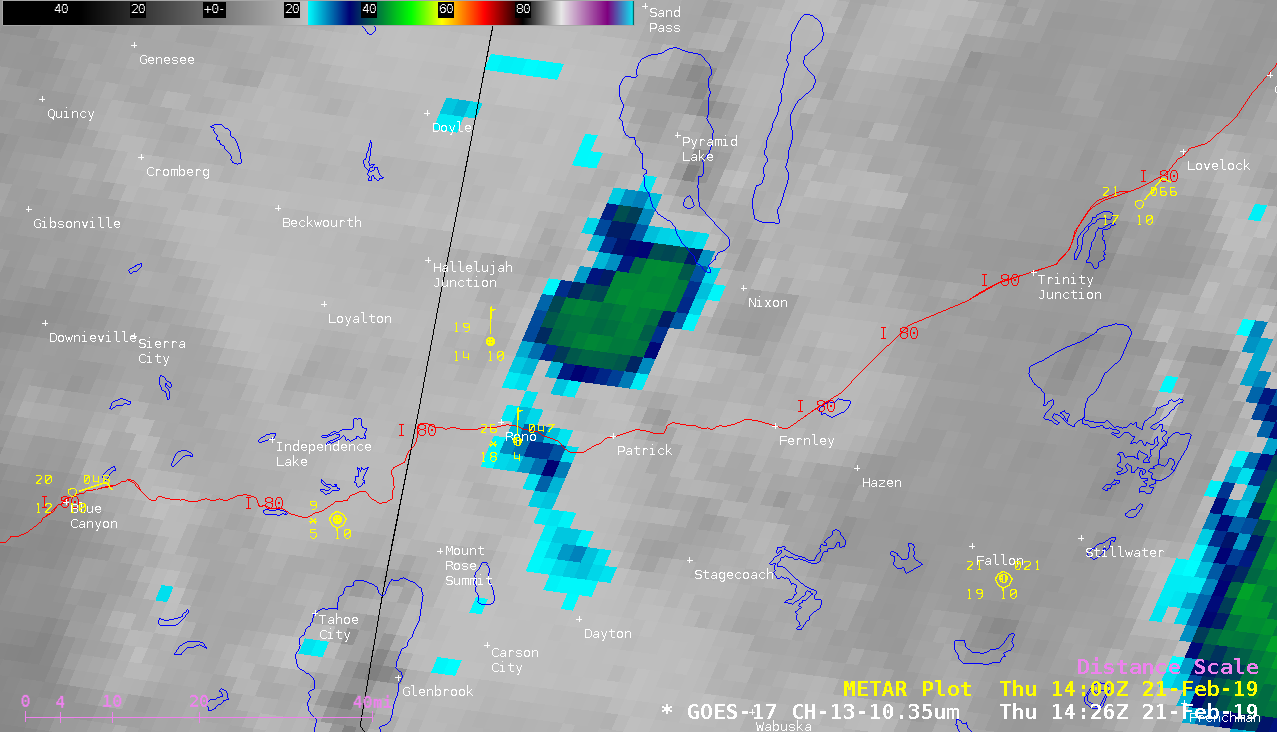
![NOAA-19 AVHRR Infrared Window (10.8 µm) image at 1254 UTC [click to enlarge]](https://cimss.ssec.wisc.edu/satellite-blog/wp-content/uploads/sites/5/2019/02/190221_1254UTC_NOAA19_IR_RENO_NV_2.GIF)
![Plot of 12 UTC rawinsonde data from Reno, Nevada [click to enlarge]](https://cimss.ssec.wisc.edu/satellite-blog/wp-content/uploads/sites/5/2019/02/190221_12UTC_KREV_RAOB.GIF)
![Terra MODIS Sea Surface Temperature product on 11 and 16 February [click to enlarge]](https://cimss.ssec.wisc.edu/satellite-blog/wp-content/uploads/sites/5/2019/02/190211_190216_modis_sst_Pyramid_Lake_NV_anim.gif)
![GOES-16 Land Surface Temperature product at 1701 UTC [click to enlarge]](https://cimss.ssec.wisc.edu/satellite-blog/wp-content/uploads/sites/5/2019/02/190221_1701utc_goes16_landSurfaceTemperature_Pyramid_Lake_NV.png)

