Himawari-8 Low-level (7.3 µm), Mid-level (6.9 µm) and Upper-level (6.2 µm) Water Vapor images (above) revealed an interesting standing wave west/northwest of Tropical Cyclone Pola in the South Pacific Ocean on 26 February 2019. The long-lived wave first became apparent just before 0800 UTC, and persisted until about 2330 UTC.The... Read More
![Himawari-8 Low-level (7.3 µm), Mid-level (6.9 µm) and Upper-level (6.2 µm) Water Vapor images [click to play animation | MP4]](https://cimss.ssec.wisc.edu/satellite-blog/wp-content/uploads/sites/5/2019/02/HIM08_WATER_VAPOR_POLA_26FEB2019_2019057_150000_HIMAWARI-8_0003PANELS.GIF)
Himawari-8 Low-level (7.3 µm), Mid-level (6.9 µm) and Upper-level (6.2 µm) Water Vapor images [click to play animation | MP4]
Himawari-8 Low-level (7.3 µm), Mid-level (6.9 µm) and Upper-level (6.2 µm) Water Vapor images
(above) revealed an interesting standing wave west/northwest of Tropical Cyclone Pola in the South Pacific Ocean on 26 February 2019. The long-lived wave first became apparent just before 0800 UTC, and persisted until about 2330 UTC.
The standing wave feature was also apparent in Himawari-8 “Clean” Infrared Window (10.4 µm) images (below). The abrupt warming of cloud-top infrared brightness temperatures associated with the wave suggests that subsidence was lowering the cloud height. Also note the very cold cloud-top temperatures of -90ºC and colder (yellow pixels embedded within the darker purple enhancement) — this was colder than the tropopause temperature on 12 UTC rawinsonde data from both Nadi, Fiji (NFFN) to the southwest and Pago Pago, American Samoa (NSTU) to the northeast (the wave feature was located closer to the Nadi sounding).
![Himawari-8 "Clean" Infrared Window (10.4 µm) images [click to play animation | MP4]](https://cimss.ssec.wisc.edu/satellite-blog/wp-content/uploads/sites/5/2019/02/HIM08_IR_POLA_26FEB2019_2019057_150000_HIMAWARI-8_0001PANEL.GIF)
Himawari-8 “Clean” Infrared Window (10.4 µm) images [click to play animation | MP4]
Consecutive VIIRS Infrared Window (11.45 µm) images from Suomi NPP and NOAA-20, as viewed using
RealEarth (below) showed a definitive bore-like structure with the wave, especially along the northern end.
![VIIRS Infrared Window (11.45 µm) images from NOAA-20 and Suomi NPP [click to enlarge]](https://cimss.ssec.wisc.edu/satellite-blog/wp-content/uploads/sites/5/2019/02/190226_noaa20_suomiNPP_viirs_infrared_Pola_anim.gif)
VIIRS Infrared Window (11.45 µm) images from NOAA-20 and Suomi NPP [click to enlarge]
Himawari-8 “Red” Visible (0.64 µm) images
(below) showed the feature during daylight hours — a distinct shadow was being cast during local sunrise, which indicated a sharp drop-off in cloud height from east to west along the wave.
![Himawari-8 "Red" Visible (0.64 µm) images [click to play animation | MP4]](https://cimss.ssec.wisc.edu/satellite-blog/wp-content/uploads/sites/5/2019/02/HIM08_VIS_POLA_26FEB2019_2019057_182000_HIMAWARI-8_0001PANEL.GIF)
Himawari-8 “Red” Visible (0.64 µm) images [click to play animation | MP4]
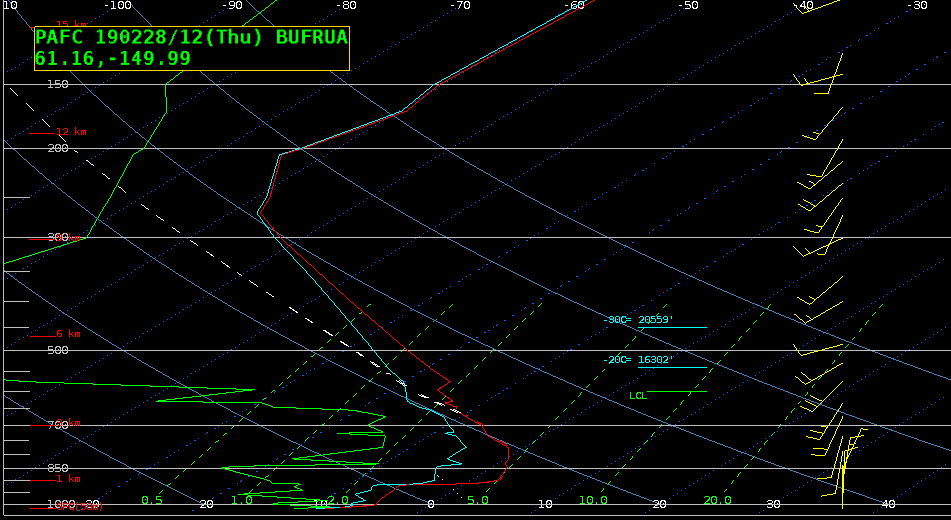
A HWRF-P model sounding for the latitude/longitude point 15.42ºS/179.75ºW valid at 18 UTC (
source) showed directional wind shear at the 450 hPa pressure level — such a wind shear could have acted to initiate a horizontal roll circulation, creating a narrow zone of cloud-eroding subsidence. In addition, a sharp change in wind direction was seen above 150 hPa on the
Paga Pago sounding — and the
Nadi sounding showed speed shear with height — which also could have induced a horizontal roll circulation within the upper troposphere.
![HWRF-P model sounding for the location 15.42ºS 179.75ºW at 18 UTC [click to enlarge]](https://cimss.ssec.wisc.edu/satellite-blog/wp-content/uploads/sites/5/2019/02/190226_18utc_hwrf_sounding_Pola.jpg)
HWRF-P model sounding for the location 15.42ºS/179.75ºW at 18 UTC [click to enlarge]
An interesting phenomenon was the apparent “shedding” of high-altitude cloud material from the higher/colder cloud canopy of Pola immediately east of the wave feature, as seen in Himawari-8 Shortwave Infrared (3.9 µm) images
(below). The westward direction and velocity of this cloud material motion had good agreement with GFS model winds at 150 hPa. Note that this shed cloud material appeared warmer
(darker gray) in the 3.9 µm imagery — the shearing of cirrus cloud may have acted to fracture the ice crystals, making them smaller in size and therefore more efficient reflectors of incoming solar radiation.
![Himawari-8 Shortwave Infrared (3.9 µm) images, with plots of GFS 150 hPa winds [click to play animation | MP4]](https://cimss.ssec.wisc.edu/satellite-blog/wp-content/uploads/sites/5/2019/02/HIM08_SWIR_POLA_26FEB2019_2019057_211000_HIMAWARI-8_0001PANEL.GIF)
Himawari-8 Shortwave Infrared (3.9 µm) images, with plots of GFS 150 hPa winds [click to play animation | MP4]
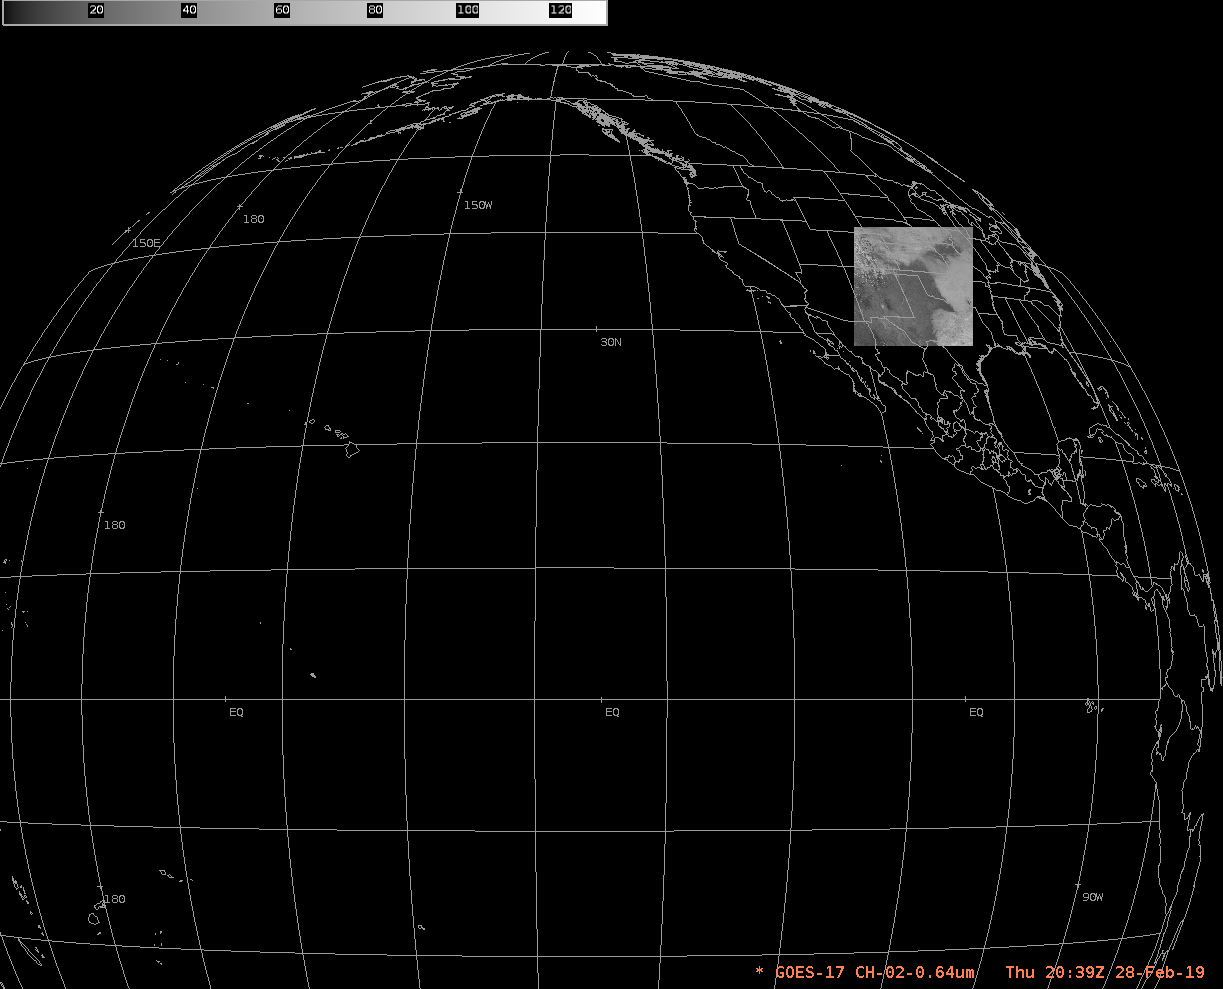
A toggle between GOES-17
(GOES-West) Infrared and Water Vapor images from the
CIMSS Tropical Cyclones site
(below) showed that the feature was aligned with a couplet of low-level convergence and upper-level divergence at 15 UTC — such an environment could also support a vertically-propagating gravity wave.
![GOES-17 Infrared and Water Vapor images, with contours of low-level convergence and upper-level divergence at 15 UTC [click to enlarge]](https://cimss.ssec.wisc.edu/satellite-blog/wp-content/uploads/sites/5/2019/02/190226_15utc_lowerConvergence_upperDivergence_TS_Pola_anim.gif)
GOES-17 Infrared and Water Vapor images, with contours of low-level convergence and upper-level divergence at 15 UTC [click to enlarge]
Another analysis of this feature is available from the
Australian Bureau of Meteorology Training Centre.
View only this post
Read Less
![Himawari-8 "Clean" Infrared Window (10.4 µm) images [click to play animation | MP4]](https://cimss.ssec.wisc.edu/satellite-blog/wp-content/uploads/sites/5/2019/03/190301_himawari8_infraredWindow_Australia_pyroCb_anim.gif)
![Suomi NPP VIIRS True Color RGB and Infrared Window (11.45 µm) images at 0537 UTC [click to enlarge]](https://cimss.ssec.wisc.edu/satellite-blog/wp-content/uploads/sites/5/2019/03/190301_0537utc_suomiNPP_viirs_truecolor_infrared_Australia_pyroCb_anim.gif)
![NOAA-20 VIIRS True Color RGB and Infrared Window (11.45 µm) images at 0628 UTC [click to enlarge]](https://cimss.ssec.wisc.edu/satellite-blog/wp-content/uploads/sites/5/2019/03/190301_0628utc_noaa20_viirs_truecolor_infrared_Australia_pyroCb_anim.gif)
![Himawari-8 Shortwave Infrared (3.9 µm) images [click to play animation | MP4]](https://cimss.ssec.wisc.edu/satellite-blog/wp-content/uploads/sites/5/2019/03/190301_himawari8_shortwaveInfrared_Australia_pyroCb_anim.gif)
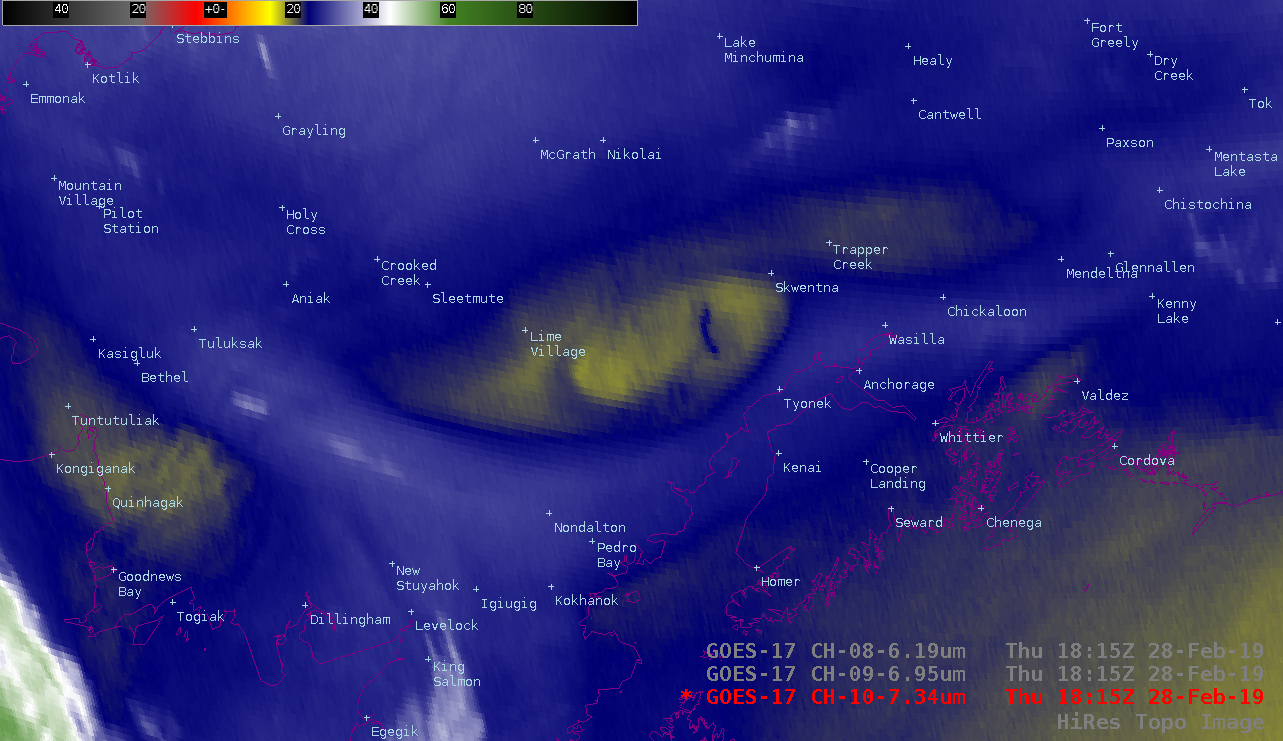
![GOES-17 Low-level (7.3 µm), Mid-level (6.9 µm) and Upper-level (6.2 µm) Water Vapor images, with topography [click to play animation | MP4]](https://cimss.ssec.wisc.edu/satellite-blog/wp-content/uploads/sites/5/2019/02/190228_goes17_waterVapor_Alaska_Range_anim.gif)
![GOES-17 Water Vapor weighting functions, calculated using 12 UTC rawinsonde data from Anchorage [click to enlarge]](https://cimss.ssec.wisc.edu/satellite-blog/wp-content/uploads/sites/5/2019/02/190228_12utc_panc_wv_wf.png)
![GOES-17 "Red" Visible (0.64 µm) images [click to play animation | MP4]](https://cimss.ssec.wisc.edu/satellite-blog/wp-content/uploads/sites/5/2019/02/190228_goes17_visible_Alaska_Range_anim.gif)
![GOES-17 "Red" Visible (0.64 µm) images [click to play animation | MP4]](https://cimss.ssec.wisc.edu/satellite-blog/wp-content/uploads/sites/5/2019/02/190228_goes17_visible_Cook_Inlet_AK_ice_anim.gif)
![GOES-17 Low-level (7.3 µm), Mid-level (6.9 µm) and Upper-level (6.2 µm) Water Vapor images, with topography [click to play animation | MP4]](https://cimss.ssec.wisc.edu/satellite-blog/wp-content/uploads/sites/5/2019/03/190301_goes17_waterVapor_Wrangell_Mountains_AK_anim.gif)
![GOES-17 Water Vapor weighting functions, calculated using rawinsonde data from Anchorage on 28 February (12 UTC) and 01 March (00 and 12 UTC) [click to enllarge]](https://cimss.ssec.wisc.edu/satellite-blog/wp-content/uploads/sites/5/2019/03/190228_190301_panc_wv_wf_anim.gif)
![GOES-17 Upper-level Water Vapor (6.2 µm) image at 2045 UTC, with NUCAPS sounding points at 2049 UTC plotted in green [click to enlarge]](https://cimss.ssec.wisc.edu/satellite-blog/wp-content/uploads/sites/5/2019/03/ak_wv8_nucaps-20190301_204538_M_D.png)
![Comparison of a dry NUCAPS sounding over the mountains (Point D) with a moist sounding near Anchorage (Point M) [click to enlarge]](https://cimss.ssec.wisc.edu/satellite-blog/wp-content/uploads/sites/5/2019/03/20190301_nucaps_Point_M_Point_D_anim.gif)

![Himawari-8 Low-level (7.3 µm), Mid-level (6.9 µm) and Upper-level (6.2 µm) Water Vapor images [click to play animation | MP4]](https://cimss.ssec.wisc.edu/satellite-blog/wp-content/uploads/sites/5/2019/02/190226_himawari8_waterVapor_Pola_anim.gif)
![Himawari-8 "Clean" Infrared Window (10.4 µm) images [click to play animation | MP4]](https://cimss.ssec.wisc.edu/satellite-blog/wp-content/uploads/sites/5/2019/02/190226_himawari8_infrared_Pola_anim.gif)
![Himawari-8 "Red" Visible (0.64 µm) images [click to play animation | MP4]](https://cimss.ssec.wisc.edu/satellite-blog/wp-content/uploads/sites/5/2019/02/190226_himawari8_visible_Pola_anim.gif)
![Himawari-8 Shortwave Infrared (3.9 µm) images, with plots of GFS 150 hPa winds [click to play animation | MP4]](https://cimss.ssec.wisc.edu/satellite-blog/wp-content/uploads/sites/5/2019/02/190226_himawari8_shortwaveInfrared_Pola_anim.gif)
