GOES-16 “Red” Visible (0.64 µm) images, with SPC storm reports plotted in red [click to play animation | MP4]
An outbreak of severe thunderstorms occurred during the afternoon hours of
03 March 2019, which produced large hail, damaging winds and tornadoes (
SPC storm reports). 1-minute
Mesoscale Domain Sector GOES-16
(GOES-East) “Red” Visible (
0.64 µm) images
(above) showed the development of numerous thunderstorms along and ahead of an advancing cold front (
surface analyses); many of those storms exhibited well-defined overshooting tops. Tornado track summaries for Alabama and Georgia are available from
NWS Birmingham and
NWS Atlanta.
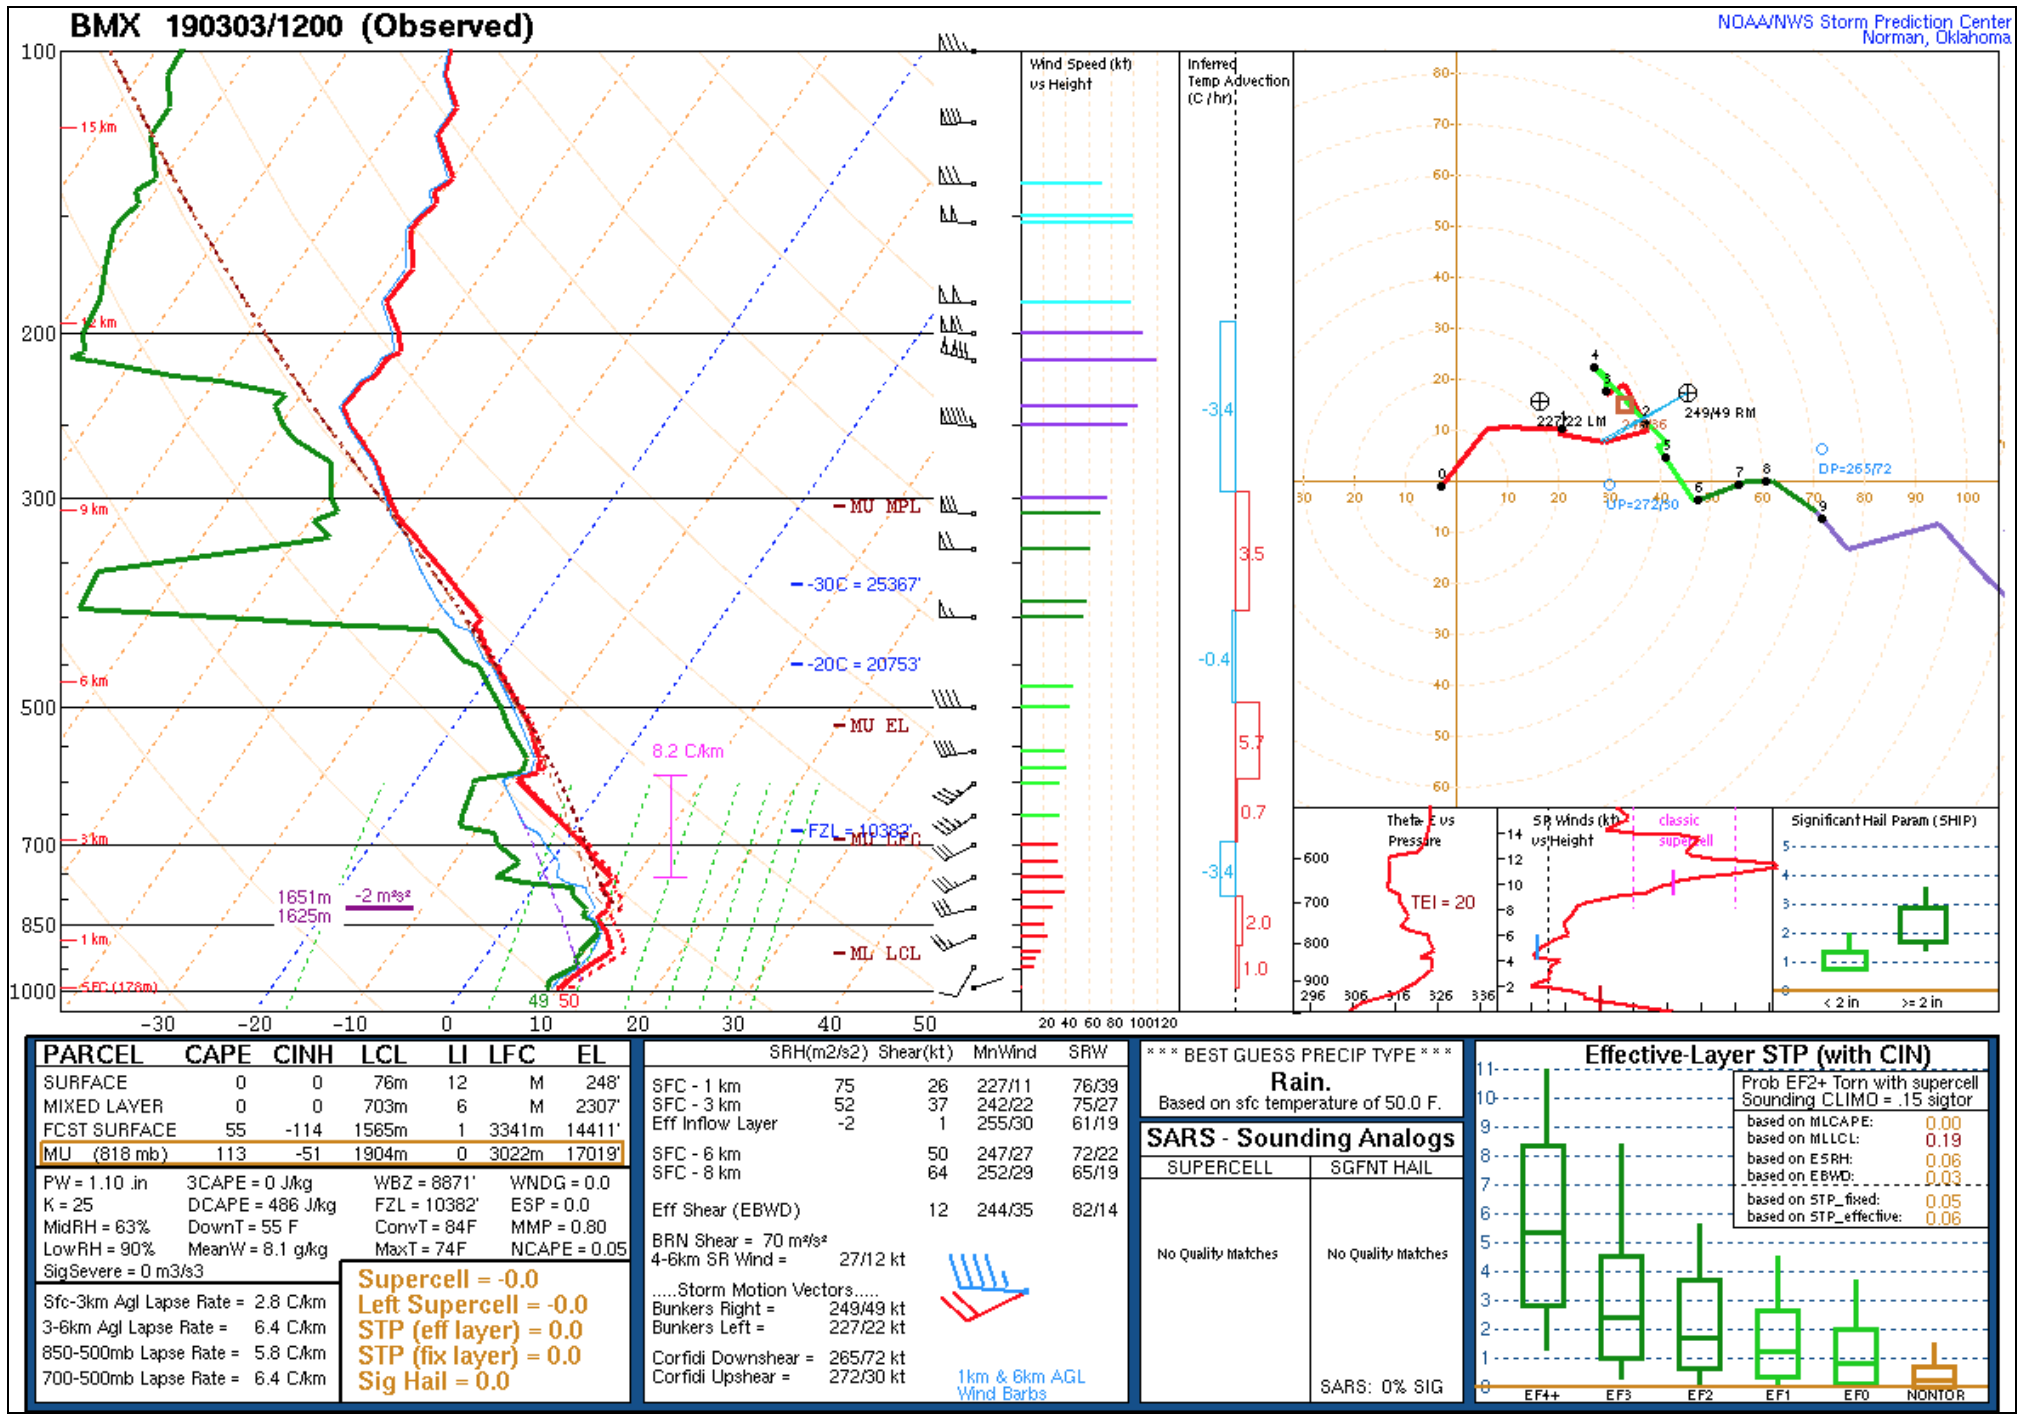
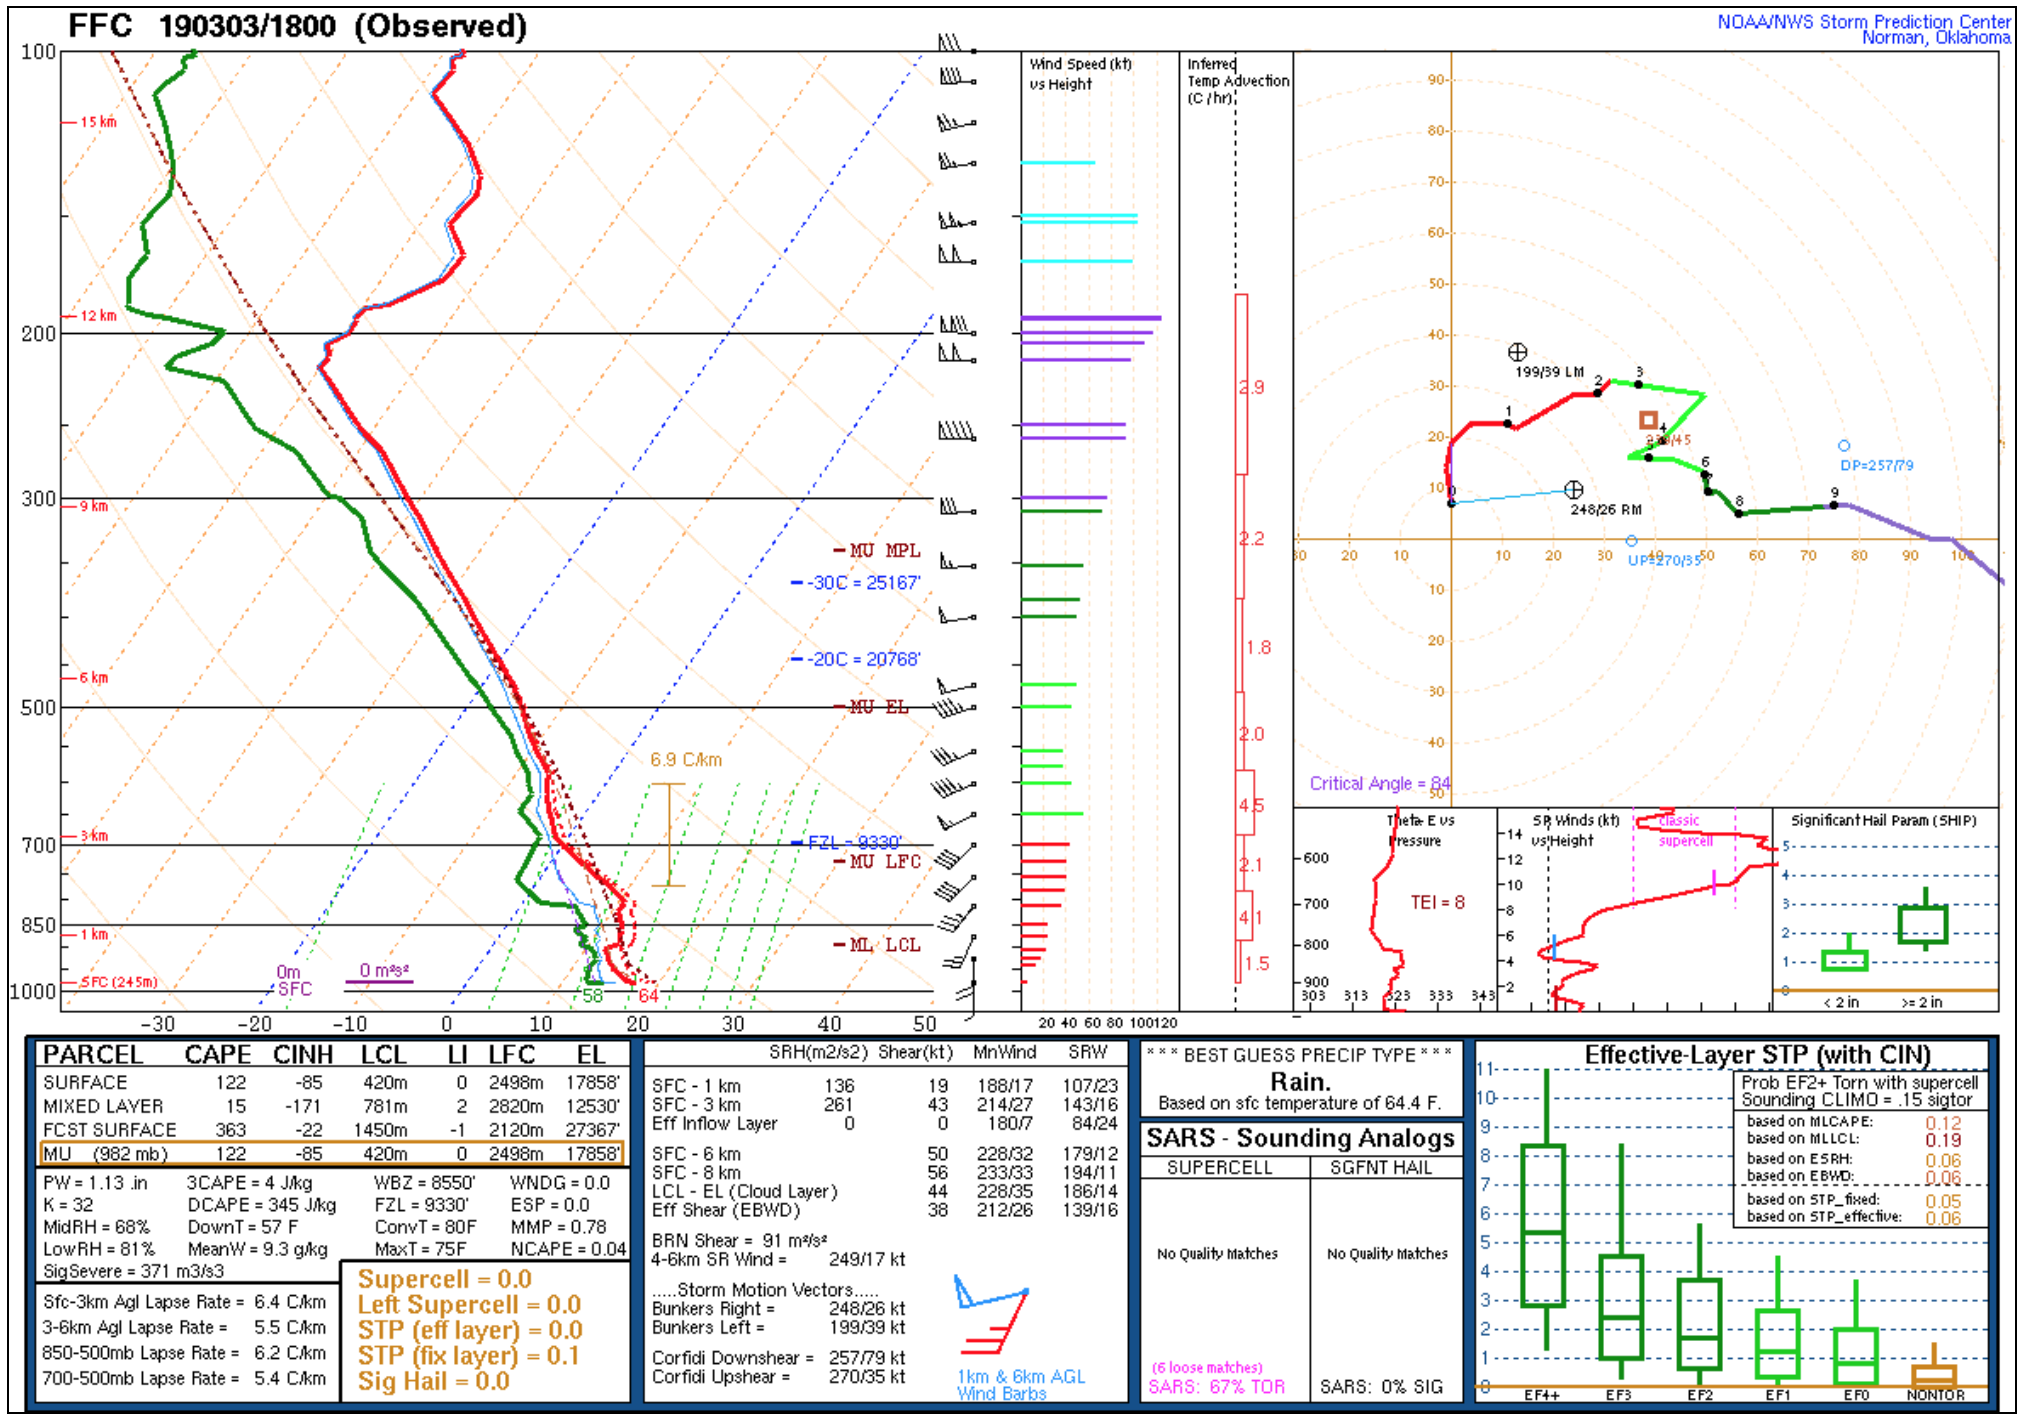
The corresponding GOES-16 “Clean” Infrared Window (10.3 µm) images are shown below. Cloud-top infrared brightness temperatures cooled to around -70ºC (darker black enhancement) with many of the stronger storms — judging from rawinsonde data from Birmingham, Alabama (at 12 UTC) and Peachtree City, Georgia (at 18 UTC), this roughly corresponded to an air parcel rising significantly past the tropopause to an altitude of at least 15 km.
![GOES-16 "Clean" Infrared Window (10.3 µm) images, with SPC storm reports plotted in red [click to play animation | MP4]](https://cimss.ssec.wisc.edu/satellite-blog/wp-content/uploads/sites/5/2019/03/G16_IR_AL_GA_SVR_03MAR2019_2019062_202650_GOES-16_0001PANEL.GIF)
GOES-16 “Clean” Infrared Window (10.3 µm) images, with SPC storm reports plotted in cyan [click to play animation | MP4]
An area which included western Lee County (located in far eastern Alabama, adjacent to the Georgia border) was highlighted by a
SPC MCD that was issued at 1900 UTC. Beginning about an hour later, 2 large tornadoes producing EF2 to EF4 damage moved across southern Lee County — initially beginning around
2000 UTC, then again beginning around
2050 UTC — and the formation of prominent overshooting tops was evident in GOES-16 Visible and Infrared imagery
(below). Station identifier
KAUO in Lee County is the Auburn-Opelika Airport. (side note: later, around 2204 UTC, the Weedon Field Airport
KEUF METAR site to the south of Lee County was directly hit by a separate
EF2 tornado, and rendered inoperative)
![GOES-16 "Clean" Infrared Window (10.3 µm) images, with SPC storm reports plotted in cyan [click to play animation | MP4]](https://cimss.ssec.wisc.edu/satellite-blog/wp-content/uploads/sites/5/2019/03/G16_VIS_IR_AL_GA_SVR_03MAR2019_2019062_200550_GOES-16_0002PANELS.GIF)
GOES-16 “Red” Visible (0.64 µm, left) and “Clean” Infrared Window (10.3 µm, right) images, with SPC storm reports plotted in red/cyan — Lee County, Alabama is outlined in solid blue, with other affected counties in dashed blue [click to play animation | MP4]
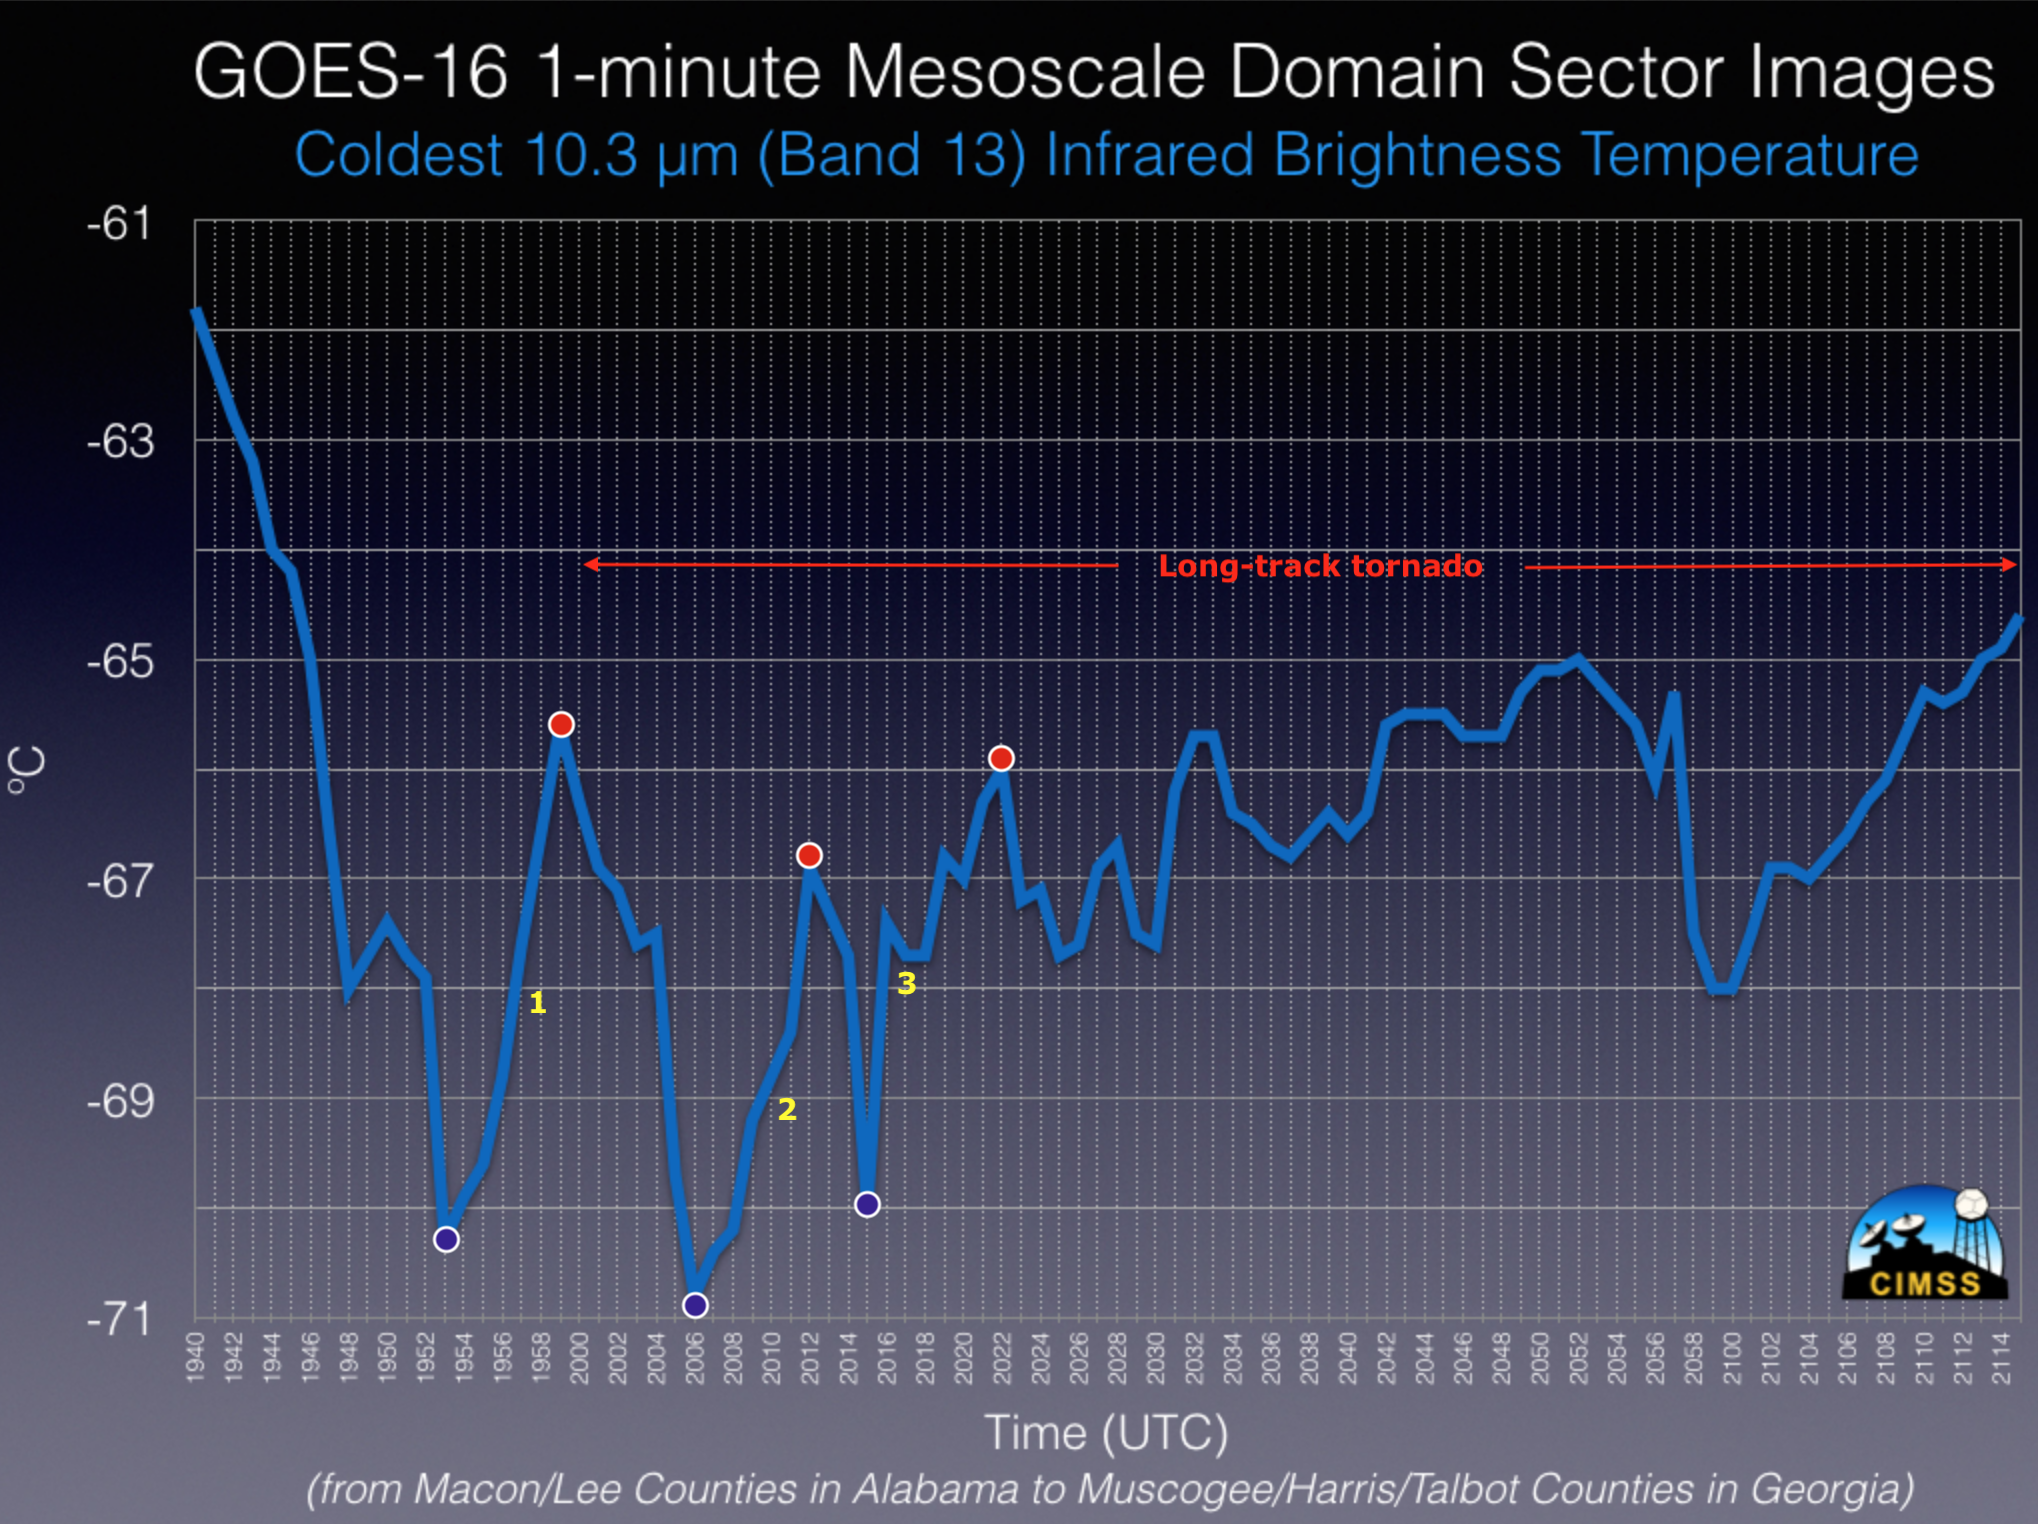
In a plot of the GOES-16 “Clean” Infrared Window
coldest brightness temperature for the EF4-tornado storm’s overshooting top as it moved from Macon/Lee Counties in Alabama to Muscogee/Harris/Talbot Counties in Georgia
(below), 3 distinct periods of cooling/warming occurred — with the warming indicative of a temporary collapse of the overshooting top pulse. The first (and largest-magnitude) cold/warm pulse (-70.3ºC to -65.6ºC) occurred from 1953-1959 UTC — just prior to the beginning of the
Beauregard-Smiths Station EF4 Tornado at 2000 UTC. A second cold/warm pulse (-70.8ºC to -66.9ºC) occurred from 2006-2012 UTC, with a third (-70.0ºC to -66.0ºC) from 2015-2022 UTC. At 2029 UTC the long-track tornado then crossed into
Muscogee County in Georgia, producing EF3 damage.
Plot of the coldest GOES-16 “Clean” Infrared Window (10.3 µm) overshooting top brightness temperatures, 2040-2115 UTC [click to enlarge]
The
NOAA/CIMSS ProbSevere product
(below) displayed a high tornado probability for the cells that approached Lee County, as discussed by the
Hazardous Weather Testbed. The ProbSevere model incorporates GOES-derived Normalized vertical growth rate and Cloud-top glaciation rate as 2 of its predictors.
![MRMS MergedReflectivity composite, with countours of the ProbSevere parameter [click for link to HWT blog post]](https://cimss.ssec.wisc.edu/satellite-blog/wp-content/uploads/sites/5/2019/03/190303_1942utc_prosevere_AL_GA.png)
MRMS MergedReflectivity composite, with countours of the ProbSevere parameter [click for link to HWT blog post]
A comparison of Aqua MODIS Visible (0.65 µm) and Infrared Window (11.0 µm) images along with the Total Precipitable Water derived product at 1836 UTC
(below) showed that a few large thunderstorms had begun to develop by that time; TPW values were as high as 43 mm (1.7 inches) over far southwestern Georgia.
![Aqua MODIS Visible (0.65 µm), Infrared Window (11.0 µm) and Total Precipitable Water images at 1836 UTC [click to enlarge]](https://cimss.ssec.wisc.edu/satellite-blog/wp-content/uploads/sites/5/2019/03/190303_1836utc_aqua_modis_visible_infrared_totalPrecipitableWater_AL_GA_anim.gif)
Aqua MODIS Visible (0.65 µm), Infrared Window (11.0 µm) and Total Precipitable Water images at 1836 UTC [click to enlarge]
![Suomi NPP VIIRS Day/Night Band (0.7 µm) image, with plots of available NUCAPS soundings [click to enlarge]](https://cimss.ssec.wisc.edu/satellite-blog/wp-content/uploads/sites/5/2019/03/viirs_vis_AL_GA-20190303_184532.png)
Suomi NPP VIIRS Day/Night Band (0.7 µm) image, with plots of available NUCAPS soundings [click to enlarge]
An overpass of the Suomi NPP satellite around 1850 UTC provided
NUCAPS soundings in non-cloudy areas
(above). One of the Good quality
(green) NUCAPS soundings in the pre-storm environment was located over southwestern Georgia
(circled in magenta) — it showed a Most Unstable CAPE value of 1264 J/kg, with a Lifted Index value of -4
(below).
![NUCAPS sounding over southwestern Georgia [click to enlarge]](https://cimss.ssec.wisc.edu/satellite-blog/wp-content/uploads/sites/5/2019/03/190303_1850utc_nucaps_GA.png)
NUCAPS sounding over southwestern Georgia [click to enlarge]
The GOES-16
All Sky CAPE product
(below) showed a trend of destabilization across southern Alabama and southern Georgia during the 5 hours leading up to the fatal tornadoes in Lee County AL.
![GOES-16 All Sky CAPE product [click to play animation]](https://cimss.ssec.wisc.edu/satellite-blog/wp-content/uploads/sites/5/2019/03/190303_1757z_cape.png)
GOES-16 All Sky CAPE product [click to play animation]
===== 05 March Update =====
![Comparison between Terra MODIS True Color and False Color RGB images on 24 February and 05 March 2019 [click to enlarge]](https://cimss.ssec.wisc.edu/satellite-blog/wp-content/uploads/sites/5/2019/03/190224_190305_terra_modis_truecolor_falsecolor_Lee_County_AL_anim.gif)
Comparison between Terra MODIS True Color and False Color RGB images on 24 February and 05 March 2019 [click to enlarge]
A toggle between before/after (24 February / 05 March 2019) Terra MODIS True Color and False Color Red-Green-Blue (RGB) images from the
MODIS Today site
(above) showed subtle evidence of portions of a tornado damage path — presumably that of the EF4 tornado that began in/near Lee County, Alabama and ended in far western Georgia. Click an additional time on the image to view at full magnification.
Sentinel-2 True Color images (below) provided a higher-resolution view of the tornado damage path. Imagery courtesy of Sentinel Hub.
![Sentinel-2 True Color RGB images from 24 February and 06 March [click to enlarge]](https://cimss.ssec.wisc.edu/satellite-blog/wp-content/uploads/sites/5/2019/03/190306_sentinel2_truecolor_AL_GA_tornado_damage_path_anim.gif)
Sentinel-2 True Color RGB images from 24 February and 06 March [click to enlarge]
View only this post
Read Less
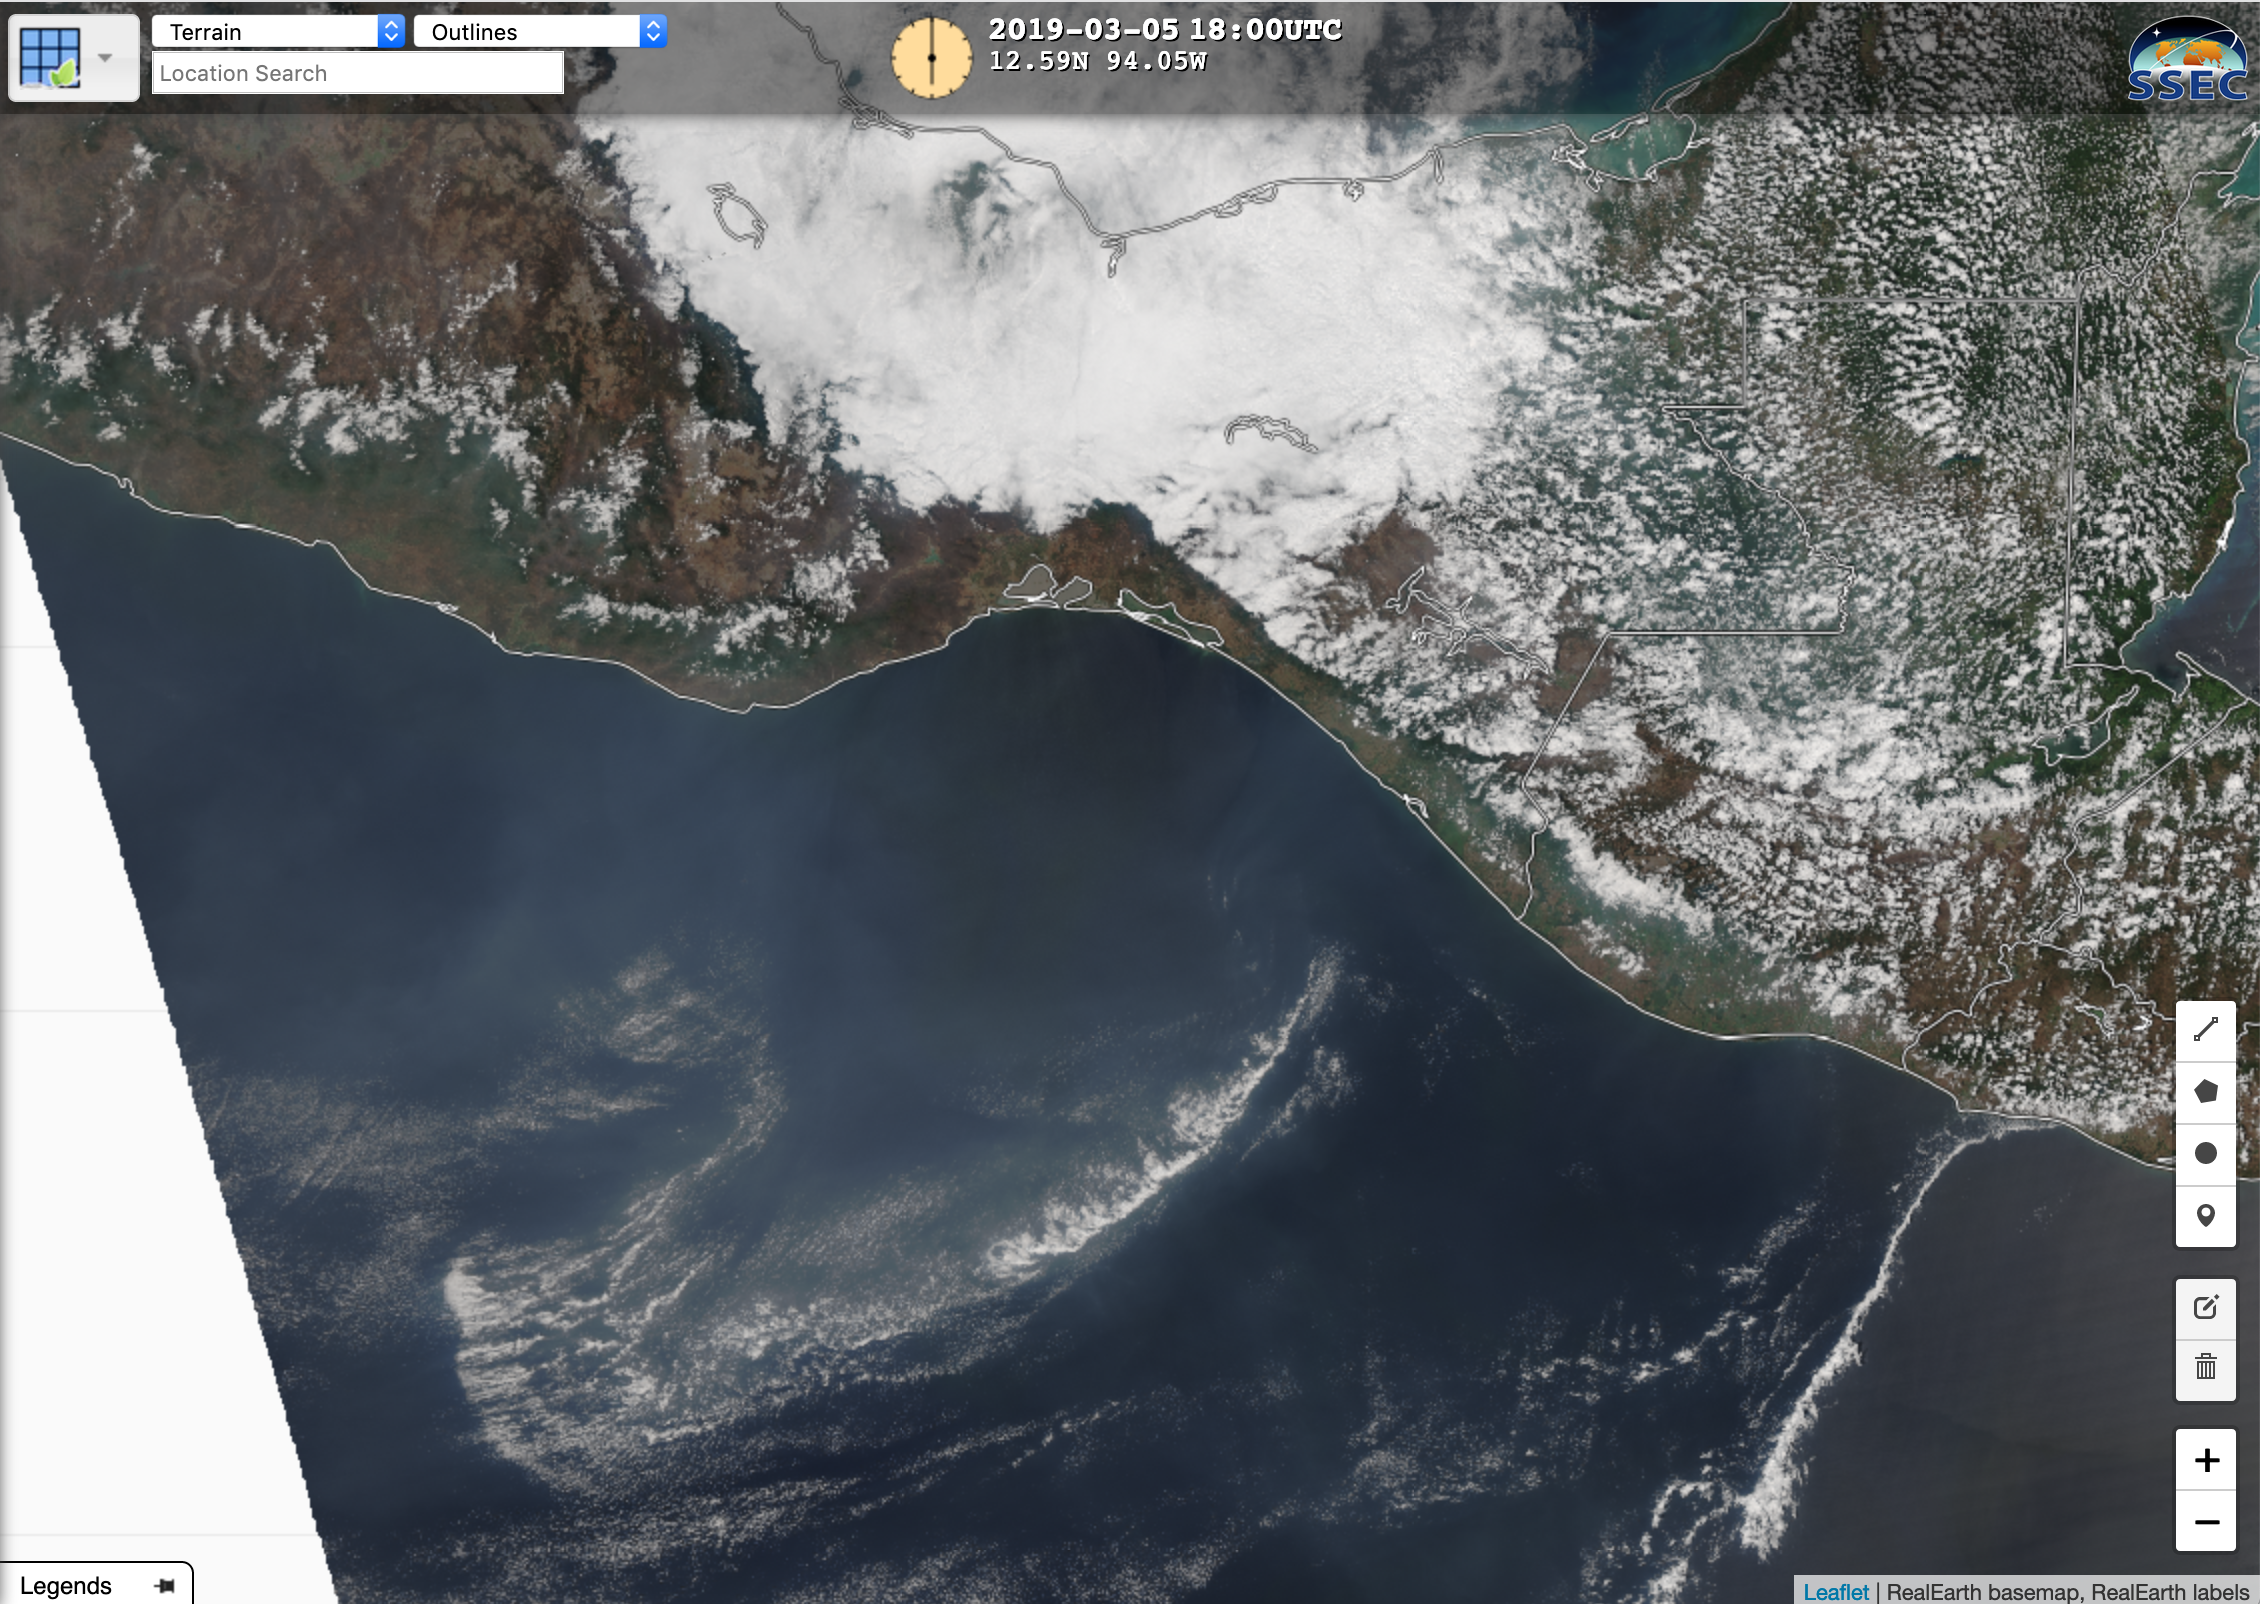

![GOES-16 Aerosol Optical Depth product [click to play animation | MP4]](https://cimss.ssec.wisc.edu/satellite-blog/wp-content/uploads/sites/5/2019/03/190305_goes16_aerosolOpticalDepth_Tehuano_anim.gif)
![GOES-16 Dust Detection product [click to play animation | MP4]](https://cimss.ssec.wisc.edu/satellite-blog/wp-content/uploads/sites/5/2019/03/190305_goes16_dustDetection_Tehuano_anim.gif)
![GOES-16 Aerosol Optical Depth product, with plots of available NUCAPS sounding profiles [click to enlarge]](https://cimss.ssec.wisc.edu/satellite-blog/wp-content/uploads/sites/5/2019/03/tehuano_nucaps_points-20190305_184530.png)
![Comparison of Dry (D) and Moist (M) NUCAPS soundings [click to enlarge]](https://cimss.ssec.wisc.edu/satellite-blog/wp-content/uploads/sites/5/2019/03/190305_1948utc_nucaps_dry_moist_soundings_Tehuano_anim.gif)
![NOAA-20 VIIRS True Color Red-Green-Blue (RGB) image [click to enlarge]](https://cimss.ssec.wisc.edu/satellite-blog/wp-content/uploads/sites/5/2019/03/190305_noaa20_viirs_truecolor_Tehuano.png)
![GOES-16 Shortwave Infrared (3.9 µm) image, with Metop-A ASCAT winds [click to enlarge]](https://cimss.ssec.wisc.edu/satellite-blog/wp-content/uploads/sites/5/2019/03/tehuano_ascat_swir-20190306_040030.png)
![GOES-16 Shortwave Infrared (3.9 µm) image, with Metop-A ASCAT winds [click to enlarge]](https://cimss.ssec.wisc.edu/satellite-blog/wp-content/uploads/sites/5/2019/03/tehuano_swir_ascat-20190306_160030.png)
![GOES-16 Shortwave Infrared (3.9 µm) images [click to play animation | MP4]](https://cimss.ssec.wisc.edu/satellite-blog/wp-content/uploads/sites/5/2019/03/190306_goes16_shortwaveInfrared_Tehuano_anim.gif)
![GOES-17 (left) and GOES-16 (right) "Red" Visible (0.64 µm) images, with plots of surface wind barbs (speed in knots) [click to play animation | MP4]](https://cimss.ssec.wisc.edu/satellite-blog/wp-content/uploads/sites/5/2019/03/190306_goes17_goes16_visible_Tehuano_anim.gif)
![GOES-16 "Red" Visible (0.64 µm) images + Dust Detection product [click to play animation | MP4]](https://cimss.ssec.wisc.edu/satellite-blog/wp-content/uploads/sites/5/2019/03/190306_goes16_visible_dustDetection_anim.gif)
![Suomi NPP VIIRS True Color RGB image [click to enlarge]](https://cimss.ssec.wisc.edu/satellite-blog/wp-content/uploads/sites/5/2019/03/190306_1930utc_suomiNPP_viirs_truecolor_Tehuano.png)
![GOES-16 "Clean" Infrared Window (10.3 µm) images, with SPC storm reports plotted in red [click to play animation | MP4]](https://cimss.ssec.wisc.edu/satellite-blog/wp-content/uploads/sites/5/2019/03/190303_goes16_infrared_spcStormReports_AL_GA_anim.gif)
![GOES-16 "Clean" Infrared Window (10.3 µm) images, with SPC storm reports plotted in cyan [click to play animation | MP4]](https://cimss.ssec.wisc.edu/satellite-blog/wp-content/uploads/sites/5/2019/03/190303_goes16_visible_infrared_spcStormReports_Lee_County_AL_anim.gif)
![GOES-16 All Sky CAPE product [click to play animation]](https://cimss.ssec.wisc.edu/satellite-blog/wp-content/uploads/sites/5/2019/03/190303_goes16_allSkyCAPE_anim.gif)
![Sequence of 3 consecutive VIIRS Infrared Window (11.45 µm) images from NOAA-20 and Suomi NPP [click to enlarge]](https://cimss.ssec.wisc.edu/satellite-blog/wp-content/uploads/sites/5/2019/03/190303_viirs_infrared_MT_anim.gif)
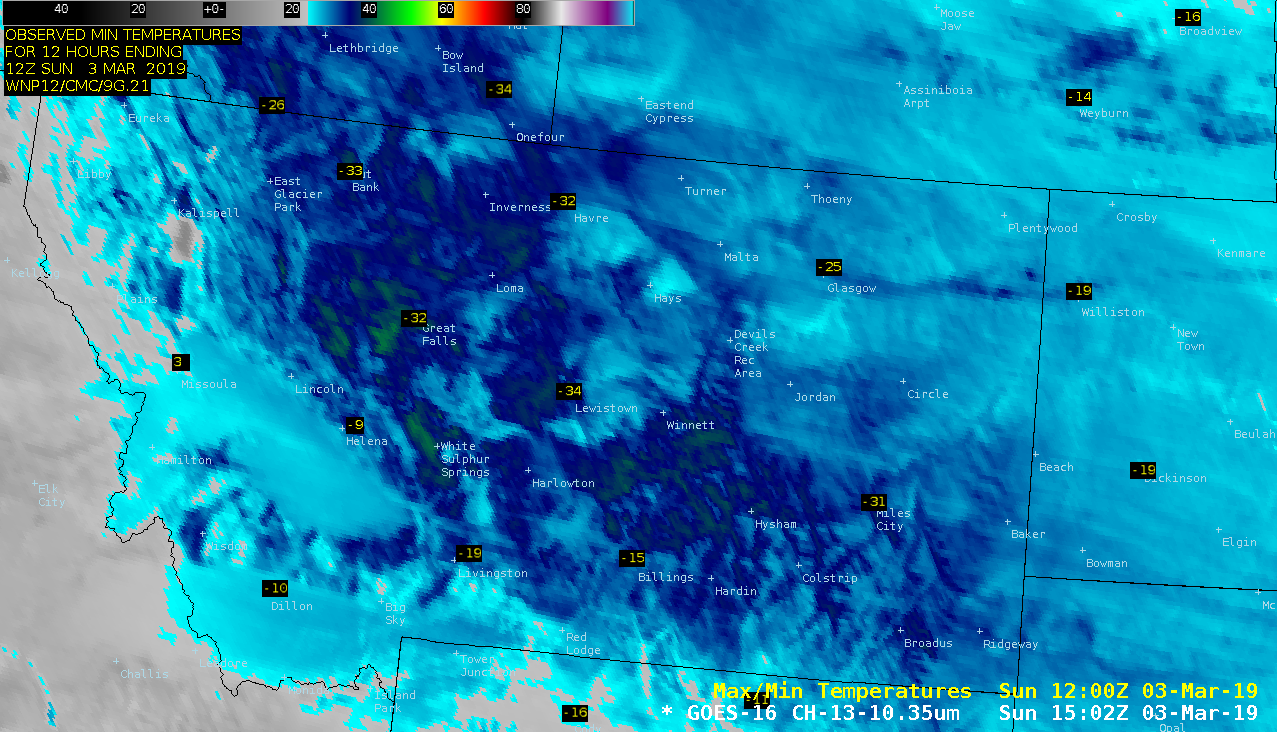
![GOES-16 "Clean" Infrared Window (10.3 µm) images, with observed minimum aurface air temperatures [click to play animation | MP4]](https://cimss.ssec.wisc.edu/satellite-blog/wp-content/uploads/sites/5/2019/03/190304_goes16_infrared_MT_anim.gif)
![Sequence of 3 consecutive VIIRS Infrared Window (11.45 µm) images from NOAA-20 and Suomi NPP [click to enlarge]](https://cimss.ssec.wisc.edu/satellite-blog/wp-content/uploads/sites/5/2019/03/190304_viirs_infrared_Montana_anim.gif)
