1-minute Mesoscale Domain Sector GOES-16 (GOES-East) “Clean” Infrared Window (10.35 µm) images (above) showed squall line thunderstorms which produced tornadoes, large hail and damaging winds (SPC Storm Reports) across Oklahoma on the evening of 25 May 2019. Of significance was the EF-3 tornado that affected El Reno, Oklahoma which was responsible for 2 fatalities (NWS Norman).The GOES-16 Infrared imagery... Read More

GOES-16 “Clean” Infrared Window (10.35 µm) images, with SPC Storm Reports plotted in cyan [click to play animation | MP4]
1-minute
Mesoscale Domain Sector GOES-16
(GOES-East) “Clean” Infrared Window (
10.35 µm) images
(above) showed
squall line thunderstorms which produced tornadoes, large hail and damaging winds (
SPC Storm Reports) across Oklahoma on the evening of
25 May 2019. Of significance was the EF-3 tornado that affected El Reno, Oklahoma which was responsible for 2 fatalities (
NWS Norman).
The GOES-16 Infrared imagery revealed evidence of pulsing updrafts (clusters of colder, brighter white pixels) to the northwest of El Reno (KRQO) — between Watonga (KJWG) and Weatherford (KOJA) — that began at 0248 UTC. 1-minute Infrared brightness temperatures associated with the bowing segment then fluctuated between -73.3ºC and -76.3ºC during the subsequent 40 minutes leading up to the El Reno tornado at 0328 UTC (below). Correcting for parallax, this would have moved those pulsing updrafts southeastward, closer to KRQO.
![1-minute Infrared brightness temperatures associated with the bowing segment that produced the El Reno tornado [click to enlarge]](https://www.ssec.wisc.edu/~scottb/190525_goes16_irbt_El_Reno_OK.png)
1-minute Infrared brightness temperatures associated with the bowing segment that produced the El Reno tornado [click to enlarge]
One way of illustrating the magnitude of the GOES-16 parallax shift is to compare SPC Storm Reports at the time of the El Reno tornado — plotting the reports at the actual ground location vs a “parallax-corrected” location which shifts them northwestward to more closely correspond to the 13-km mean height of the storm-top Infrared features
(below). Note that the parallax-corrected El Reno tornado report location is nearly coincident with that of a colder
(lighter shade of white) overshooting top.
![GOES-16 "Clean" Infrared Window (10.35 µm) images, with SPC Storm Reports plotted in cyan [click to enlarge]](https://www.ssec.wisc.edu/~scottb/190526_0326utc_spcStormReports_El_Reno_OK_anim.gif)
GOES-16 “Clean” Infrared Window (10.35 µm) images, with surface and parallax-corrected SPC Storm Reports plotted in cyan [click to enlarge]
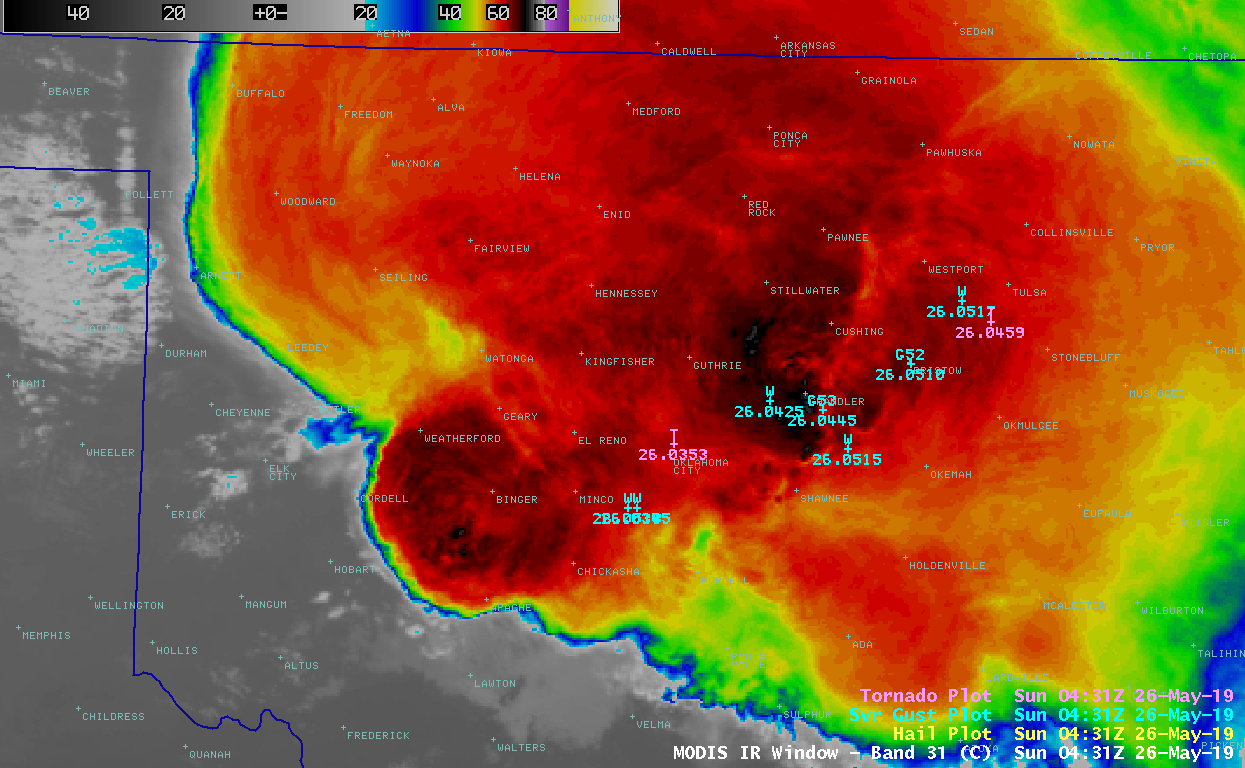
About an hour after the El Reno tornado, a Terra MODIS Infrared Window (11.0 µm) image
(below) displayed cloud-top infrared brightness temperatures as cold as -73ºC as the thunderstorms moved eastward and spread severe weather into the Tulsa area.
![Terra MODIS Infrared Window (11.0 µm) image, with plots of SPC Storm Reports with +/- 45 minutes of the image time [click to enlarge]](https://www.ssec.wisc.edu/~scottb/190526_0431utc_terra_modis_infrared_spcStormReports_OK_anim.gif)
Terra MODIS Infrared Window (11.0 µm) image, with plots of SPC Storm Reports with +/- 45 minutes of the image time [click to enlarge]
View only this post
Read Less
![GOES-17 “Red” Visible (0.64 µm) images, with hourly plots of surface reports [click to play MP4 animation]](https://cimss.ssec.wisc.edu/satellite-blog/wp-content/uploads/sites/5/2019/05/G17_VIS_OR_ID_NV_30SEC_29MAY2019_2019149_215101_GOES-17_0001PANEL.GIF)
![GOES-17 “Red” Visible (0.64 µm, left) and GOES-15 Visible (0.63 µm, right) images, with hourly plots of surface reports [click to play MP4 animation]](https://cimss.ssec.wisc.edu/satellite-blog/wp-content/uploads/sites/5/2019/05/G17_G15_VIS_OR_ID_NV_29MAY2019_2019149_205927_GOES-15_0002PANELS.GIF)
![GOES-16 “Red” Visible (0.64 µm) images, with SPC Storm Reports plotted in red [click to play MP4 animation]](https://cimss.ssec.wisc.edu/satellite-blog/wp-content/uploads/sites/5/2019/05/G16_VIS_KS_MO_SVR_28MAY2019_2019148_231716_GOES-16_0001PANEL.GIF)
![GOES-16 “Clean” Infrared Window (10.35 µm) images, with SPC Storm Reports plotted in cyan [click to play MP4 animation]](https://cimss.ssec.wisc.edu/satellite-blog/wp-content/uploads/sites/5/2019/05/G16_IR_KS_MO_SVR_28MAY2019_2019148_231716_GOES-16_0001PANEL.GIF)

![GOES-16 “Red” Visible (0.64 µm) images, with SPC Storm Reports plotted in red [click to play animation | MP4]](https://cimss.ssec.wisc.edu/satellite-blog/wp-content/uploads/sites/5/2019/05/190527_goes16_visible_spcStormReports_IN_anim.gif)
![GOES-16 “Red” Visible (0.64 µm) images, with SPC Storm Reports plotted in red [click to enlarge]](https://cimss.ssec.wisc.edu/satellite-blog/wp-content/uploads/sites/5/2019/05/190528_0000utc_goes16_visible_spcStormReports_parallax_IN_anim.gif)
![GOES-16 “Clean” Infrared Window (10.35 µm) images, with SPC Storm Reports plotted in cyan [click to play animation | MP4]](https://cimss.ssec.wisc.edu/satellite-blog/wp-content/uploads/sites/5/2019/05/190527_goes16_infrared_spcStormReports_IN_anim.gif)
![GOES-16 “Clean” Infrared Window (10.35 µm) images, with SPC Storm Reports plotted in cyan [click to play animation | MP4]](https://cimss.ssec.wisc.edu/satellite-blog/wp-content/uploads/sites/5/2019/05/190527_goes16_infrared_spcStormReports_OH_anim.gif)
![Terra MODIS Infrared Window (11.0 µm) image with plots of SPC Storm Reports within +/- 45 minutes of the image time [click to enlarge]](https://cimss.ssec.wisc.edu/satellite-blog/wp-content/uploads/sites/5/2019/05/190526_0243utc_terra_modis_infrared_spcStormReports_OH_anim.gif)

