
Strong near-surface inversions over the upper-midwest early on 1 June 2019 (as shown by 1200 UTC Skew-Ts at Green Bay, WI, Detroit/WhiteLake, MI and Gaylord, MI) helped support the presence of southward-propagating bore features, as shown in the still image (an animation) of radar imagery above (Courtesy Fred Best, SSEC), and (more subtly) in... Read More
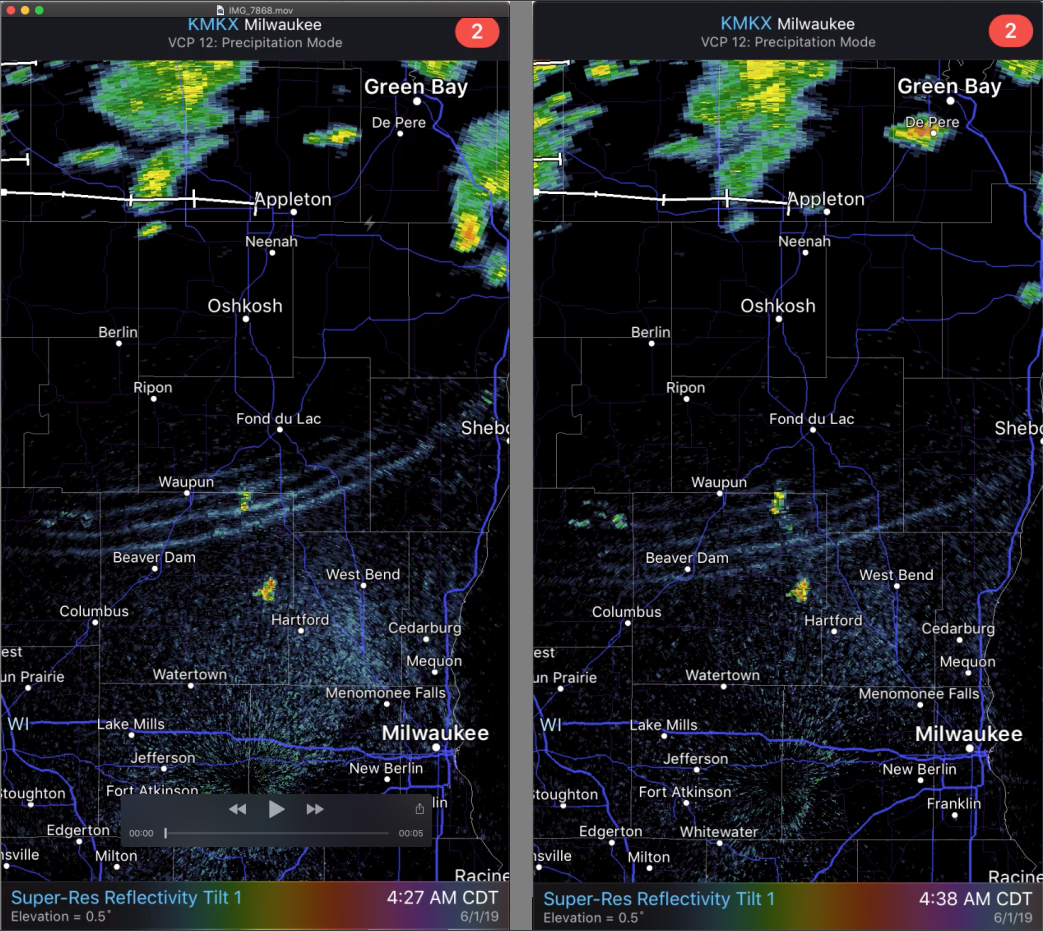
RadarScope imagery from shortly after 0900 UTC on 01 June 2019 (Click to play .mov animation)
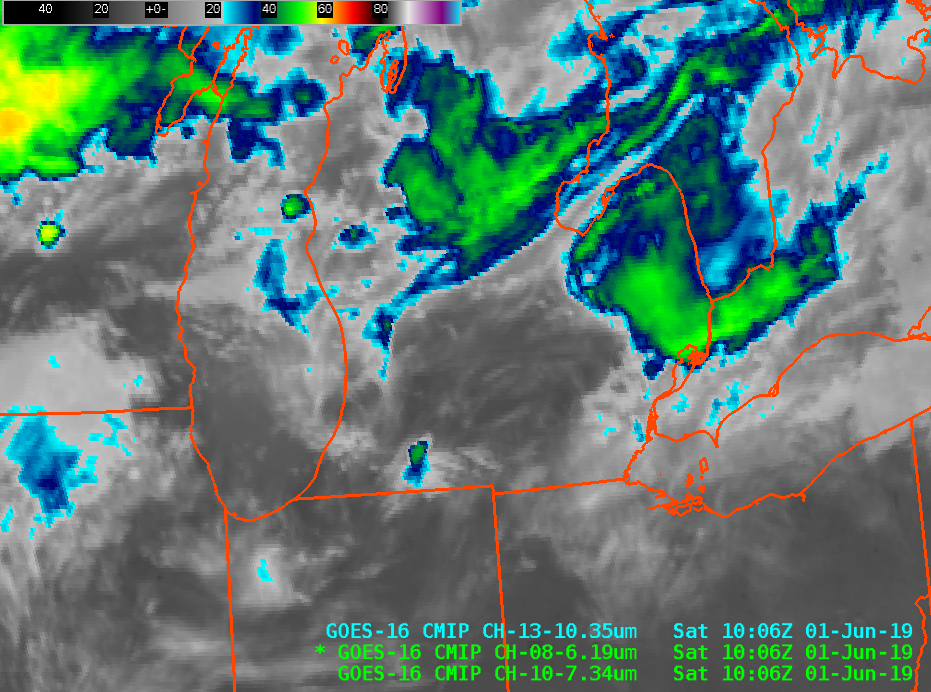
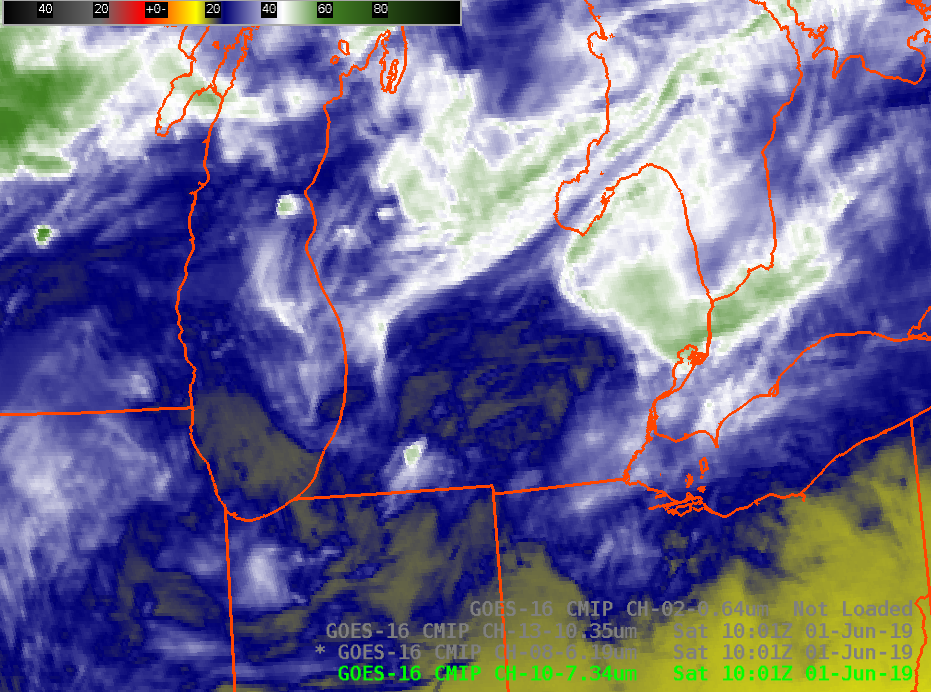
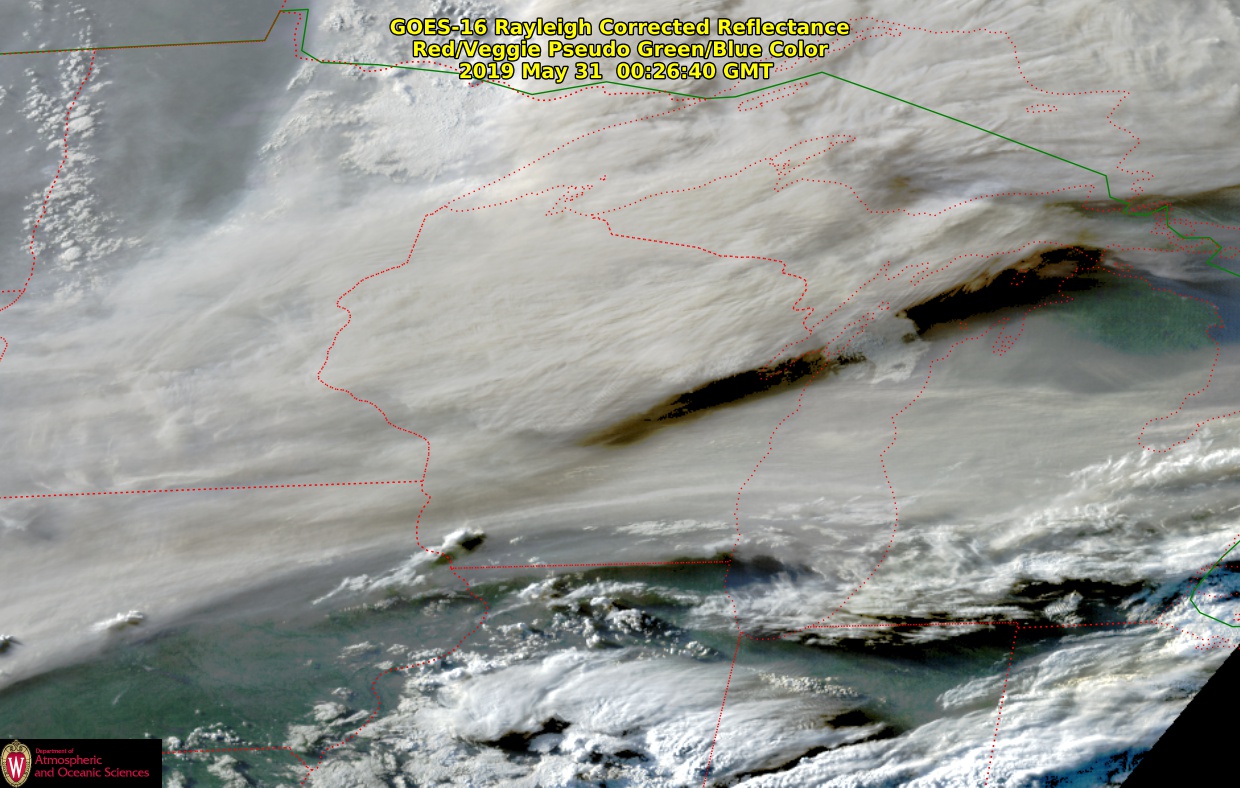
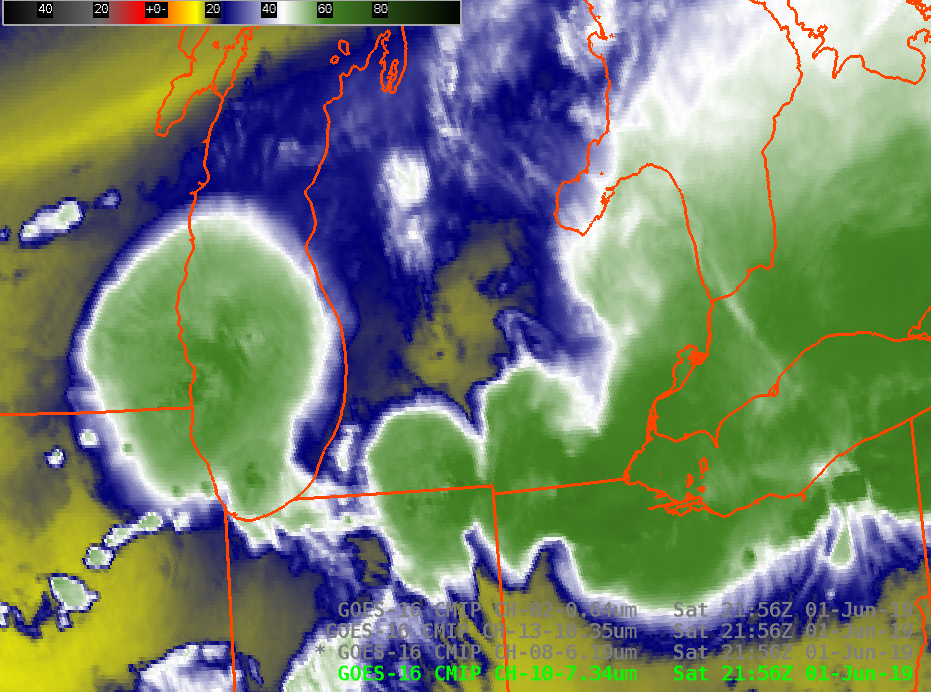
Strong near-surface inversions over the upper-midwest early on 1 June 2019 (as shown by 1200 UTC Skew-Ts at Green Bay, WI, Detroit/WhiteLake, MI and Gaylord, MI) helped support the presence of southward-propagating bore features, as shown in the still image (an animation) of radar imagery above (Courtesy Fred Best, SSEC), and (more subtly) in the water vapor imagery (Courtesy Scott Bachmeier) below.
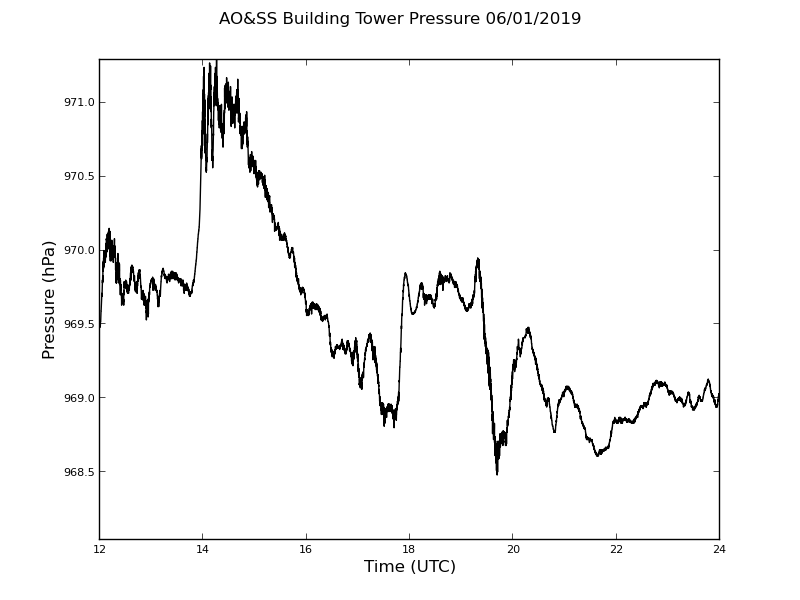
The pressure sensor at the top of the Atmospheric Oceanic and Space Science Building showed many small time-scale pressure perturbations on this day. (Image courtesy Pete Pokrandt)
Water Vapor Imagery from to on 1 June 2019; Low-level (GOES-16 ABI Band 10, 7.34 µm) on the left ; mid-level (GOES-16 ABI Band 9, 6.95 µm) in the center; upper-level (GOES-16 ABI Band 8, 6.19 µm) on the right
Later in the day, strong convection developed over southwestern Lower Michigan, starting shortly after 2215 UTC. The visible imagery below shows 1-minute imagery (GOES-16 ABI Band 2, 0.64 µm) from a Mesoscale sector positioned over the convection. At the start, the parallel lines of low clouds suggest a bore feature is propagating southward towards strong convection over northern Indiana and northern Ohio. Two things happen when that feature meets the convective outflow: some energy is apparently reflected to the north, but very strong convection rapidly develops near Battle Creek MI, where 2″ hail was observed at 2235 UTC (SPC Storm Reports).
GOES-16 ABI 1-minute Visible (0.64 µm) imagery, 2115-2149 UTC on 1 June 2019 (Click to play animated gif)
The clean window (GOES 16 ABI Band 13, 10.3 µm) animation during the day, below, show many features suggesting bore/gravity wave propagation over the area. It is challenging to pick out the impulse from this animation that lead to the severe convection that hit Battle Creek.
GOES-16 ABI Infrared (10.3 µm, Band 13 “Clean Window”) imagery, 1001-2331 UTC on 1 June 2019 (Click to play animated gif)
The Low-Level water vapor animation, shown below, also shows many features that resemble gravity waves or bores, but it also shows a line of parallel features moving towards the site of convective initiation (Consider this short loop from 2126 to 2156 UTC, for example).
GOES-16 ABI Water Vapor (7.3 µm, Band 10 “Low-Level Water Vapor”) infrared imagery, 1001-2331 UTC on 1 June 2019 (Click to play animated gif)
For convection to initiate, instability should be present. The graphic below from the Storm Prediction Center mesoanalysis website shows a nose of unstable air (represented by high values of CAPE) encroaching into southwestern Lower Michigan.
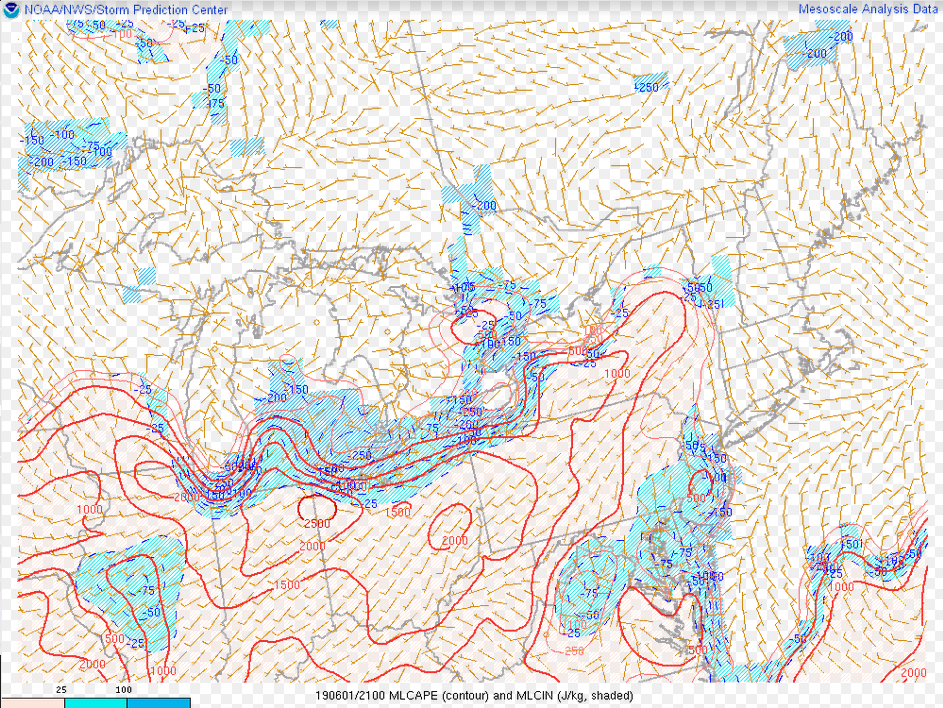
SPC CAPE analysis, 2100 UTC on 1 June 2019 (Click to enlarge)
GOES-16 Baseline Products can also diagnose instability. On 1 June 2019, however, abundant cloudiness limited the utility of the Baseline clear-sky only products, but AllSky versions have been developed and are available online at this website. The animation below shows the evolution of the AllSky Lifted Index from 1826 through 2356 UTC on 1 June 2019. In agreement with the SPC analysis, the AllSky product shows a nose of instability pushing into southwestern lower Michigan. An southward-propagating impulse (apparent in both visible and low-level water vapor imagery) meeting this gradient in instability did initiate convection on this day.
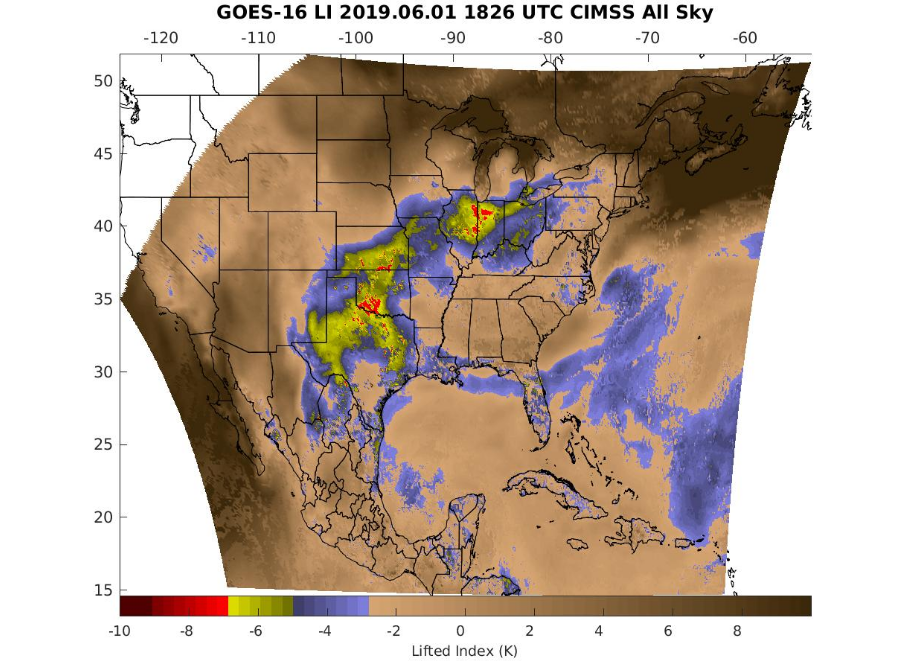
GOES-16 AllSky Lifted Index, half-hourly from 1826 UTC to 2356 UTC on 1 June 2019 (Click to play animated gif)
NOAA/CIMSS ProbSevere (v.2), a tool designed to give confidence that severe weather might occur in the next 60 minutes, shown below, tracked the rapid evolution of the storm. ProbHail increased from 7% at 2220 UTC to 81% at 2230 UTC!
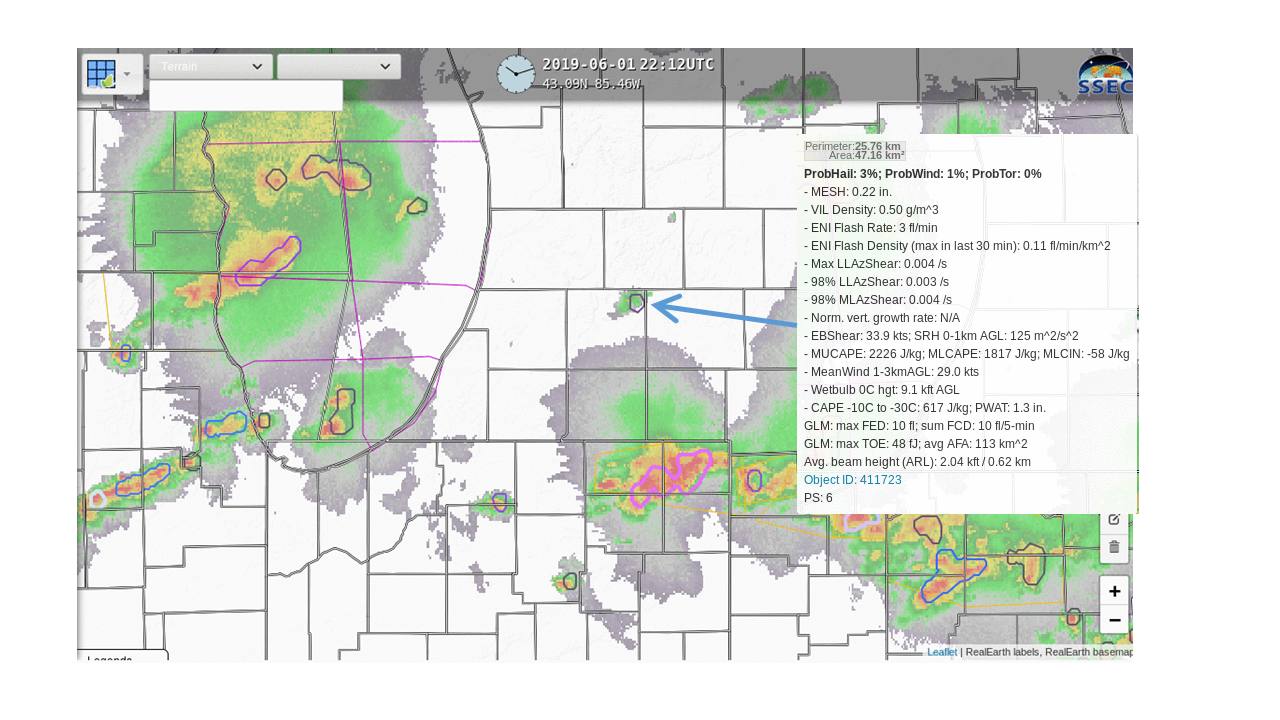
NOAA/CIMSS ProbSevere, with readout values, from 2200 to 2236 UTC on 1 June 2019 (Click to play animated gif)
The chart below, from John Cintineo, SSEC/CIMSS, graphically shows the very rapid development of Prob Hail values. Much of the increase in ProbHail was driven by MESH and Total Lightning observations. When an impulse enters a region of instability in a good environment, explosive growth can result.
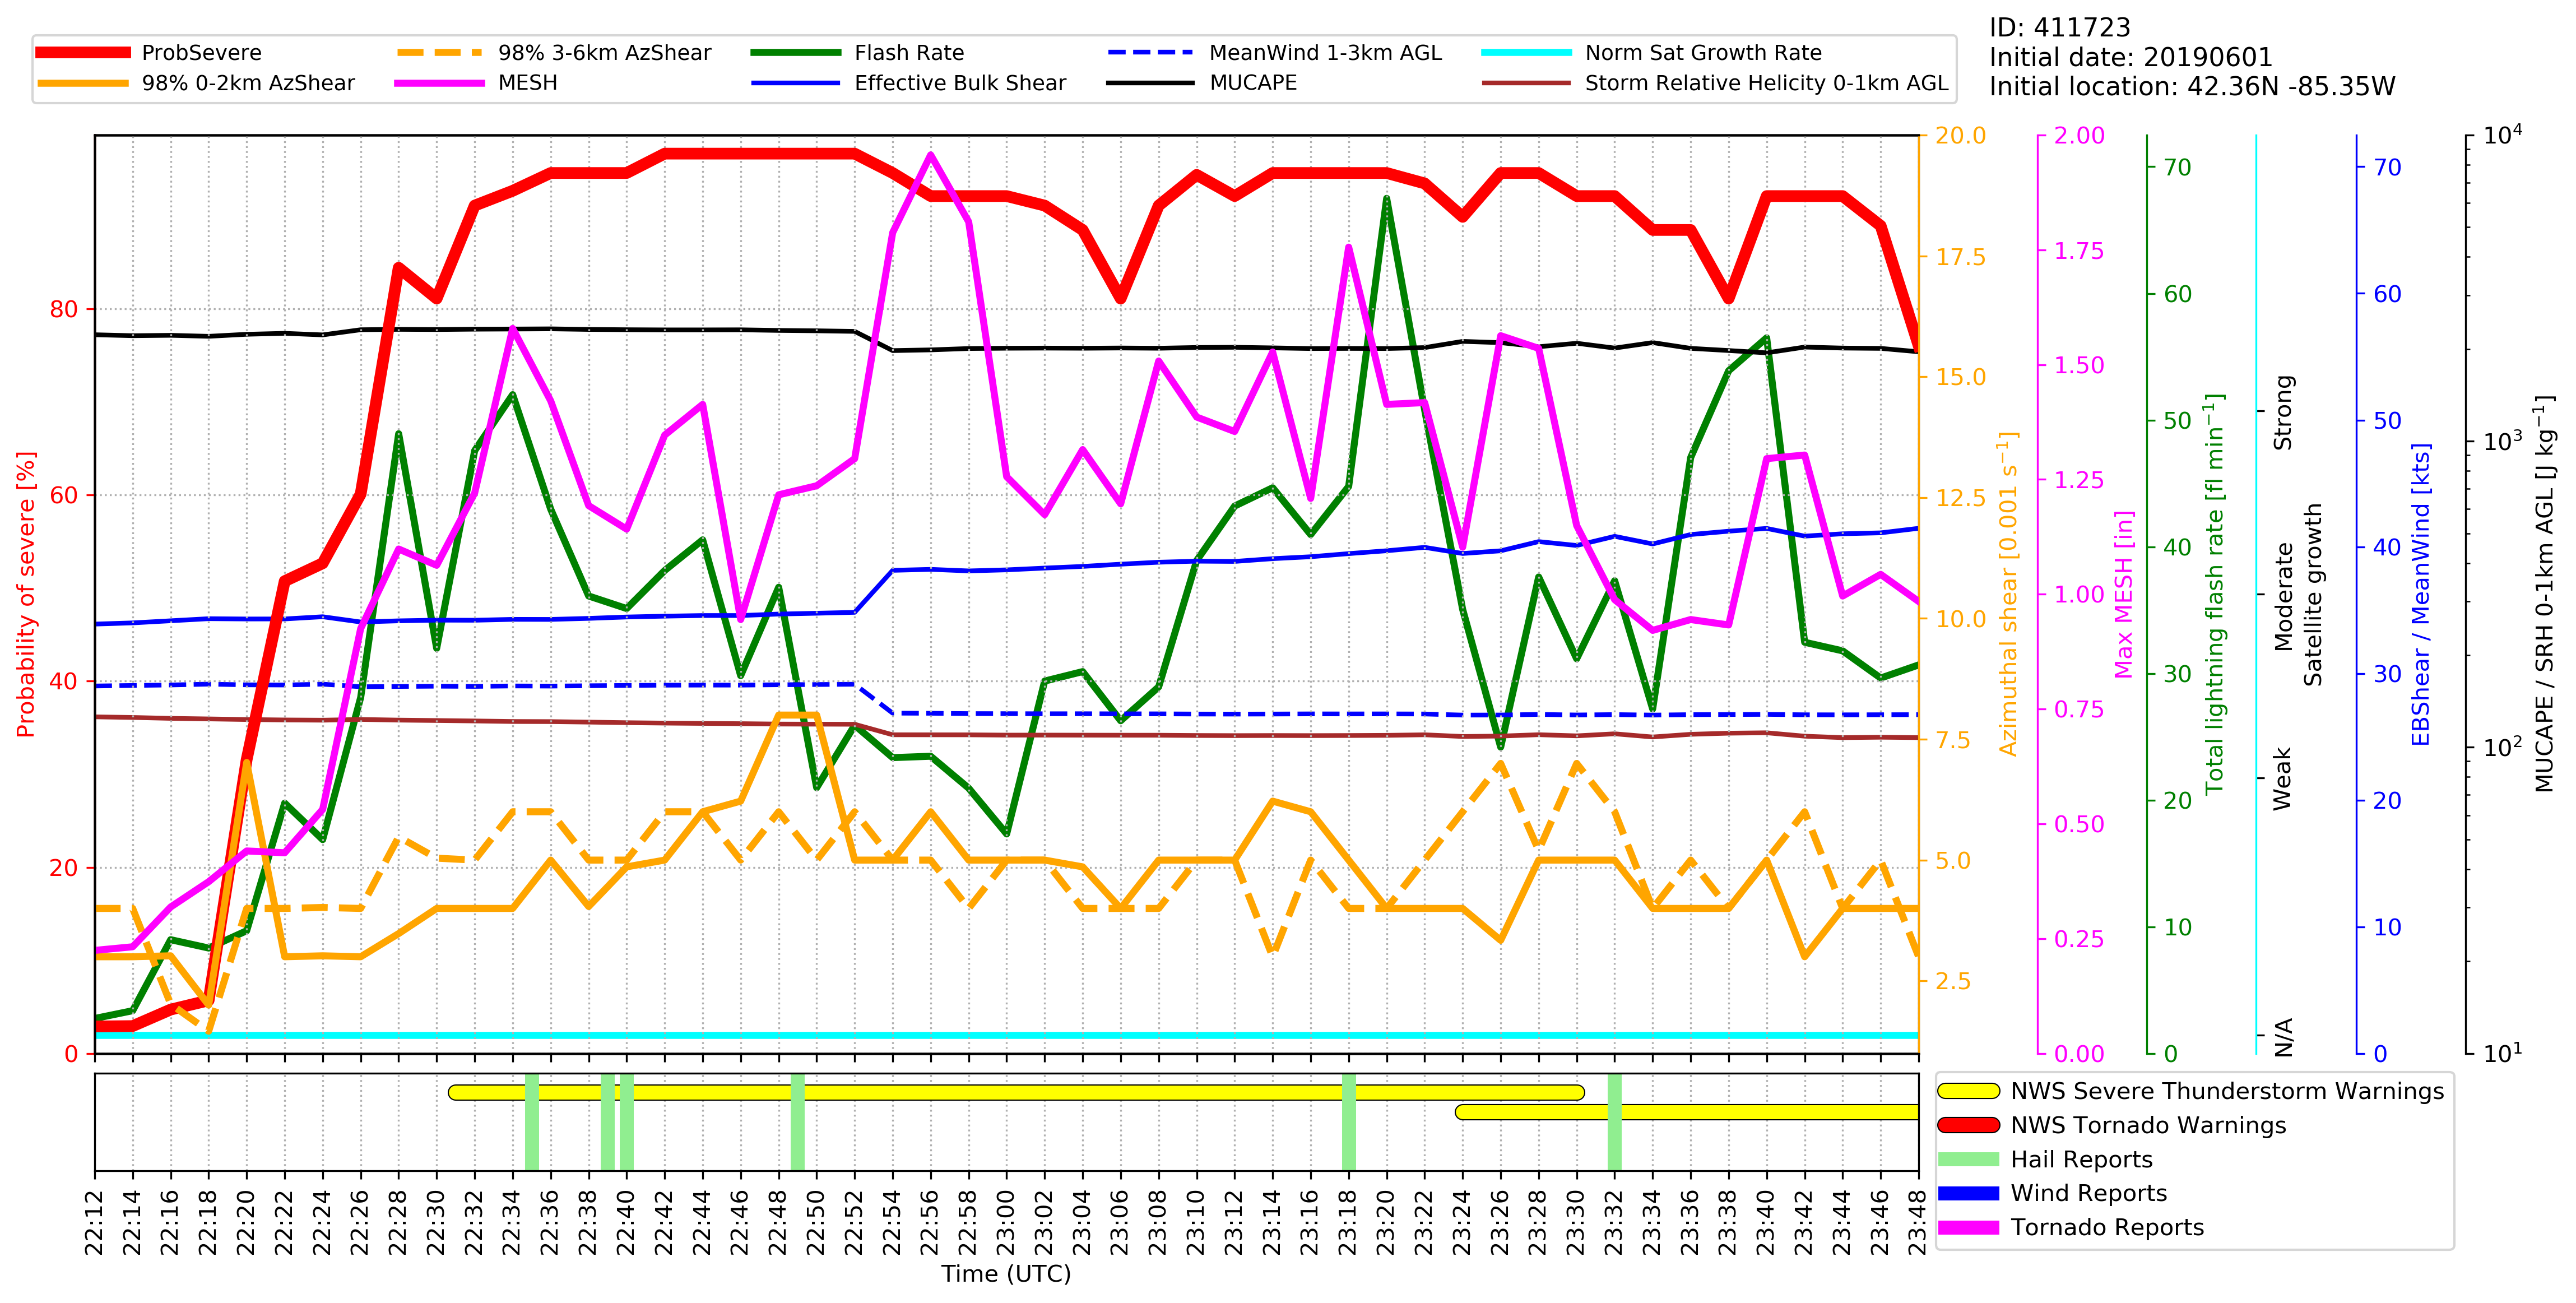
NOAA/CIMSS ProbSevere readout for Radar Object 411723 (the storm that produced Hail in Battle Creek MI on 1 June 2019) (Click to enlarge)
Many thanks to TJ Turnage, NWS Grand Rapids, for alerting us to this very interesting case.
View only this post
Read Less
![Landsat-8 False Color RGB images + GOES-16 River Flood Areal Extent product near the confluence of the Mississippi and Ohio Rivers [click to enlarge]](https://cimss.ssec.wisc.edu/satellite-blog/wp-content/uploads/sites/5/2019/06/190601_1636utc_landsat8_falsecolor_goes16_floodingWaterFraction_Mississippi_Ohio_River_anim.gif)
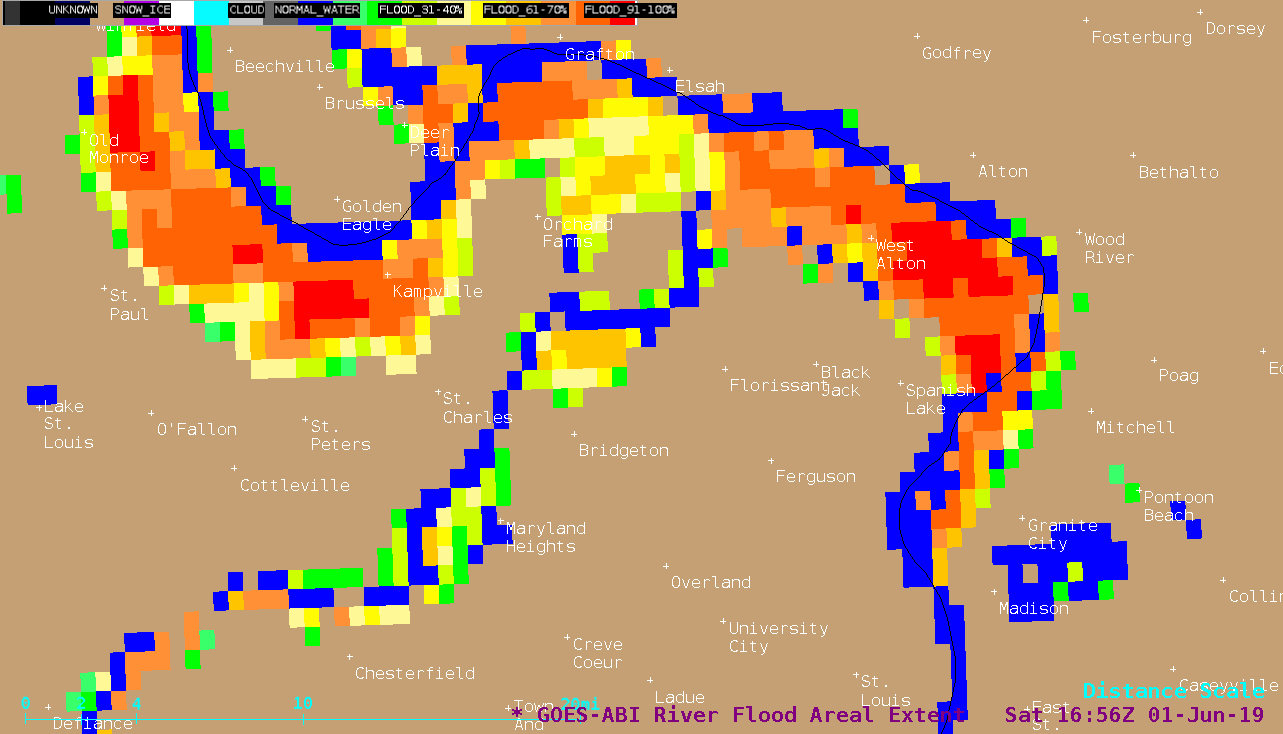
![GOES-16 River Flood Areal Extent product [click to enlarge]](https://cimss.ssec.wisc.edu/satellite-blog/wp-content/uploads/sites/5/2019/06/g16_flood-20190601_165600.png)
![Landsat-8 False Color RGB images + GOES-16 River Flood Areal Extent product near the confluence of the Mississippi and Missouri Rivers [click to enlarge]](https://cimss.ssec.wisc.edu/satellite-blog/wp-content/uploads/sites/5/2019/06/190601_1636utc_landsat8_falsecolor_goes16_floodingWaterFraction_Mississippi_River_STL_anim.gif)
![GOES-16 River Flood Areal Extent product [click to enlarge]](https://cimss.ssec.wisc.edu/satellite-blog/wp-content/uploads/sites/5/2019/06/g16_flood_stl-20190601_165600.png)
![7-day, 14-day and 30-day precipitation ending at 12 UTC on 01 June 2019 [click to enlarge]](https://cimss.ssec.wisc.edu/satellite-blog/wp-content/uploads/sites/5/2019/06/190601_7day_14day_30day_precip_anim.gif)
![30-day precipitation, departure and percent of normal ending at 12 UTC on 01 June 2019 [click to enlarge]](https://cimss.ssec.wisc.edu/satellite-blog/wp-content/uploads/sites/5/2019/06/190601_30day_precip_departure_percentNormal_anim.gif)


![GOES-16 True Color RGB images [click to play animation | MP4]](https://cimss.ssec.wisc.edu/satellite-blog/wp-content/uploads/sites/5/2019/05/190530_goes16_truecolor_WI_smoke_anim.gif)
![Images from the west-facing AOSS rooftop camera [click to play animation | MP4]](https://cimss.ssec.wisc.edu/satellite-blog/wp-content/uploads/sites/5/2019/05/190530_west_rooftop_camera_anim.gif)
![GOES-16 "Clean" Infrared Window (10.3 µm) images [click to play animation | MP4]](https://cimss.ssec.wisc.edu/satellite-blog/wp-content/uploads/sites/5/2019/05/190530_goes16_infrared_Upper_Midwest_anim.gif)
![GOES-16 Aerosol Optical Depth product [click to play animation | MP4]](https://cimss.ssec.wisc.edu/satellite-blog/wp-content/uploads/sites/5/2019/05/190530_goes16_aerosolOpticalDepth_Upper_Midwest_anim.gif)
![GOES-17 “Red” Visible (0.64 µm) images, with 3-hourly plots of ship wind reports [click to play animation | MP4]](https://cimss.ssec.wisc.edu/satellite-blog/wp-content/uploads/sites/5/2019/05/190530_goes17_visible_Pacific_Ocean_actiniae_anim.gif)
![TIROS-V image of actinoform clouds over the western Pacific Ocean on 07 October 1962 [click to enlarge]](https://cimss.ssec.wisc.edu/satellite-blog/wp-content/uploads/sites/5/2019/05/1963_tirosV_actinoform.jpg)
