1-minute Mesoscale Domain Sector GOES-16 (GOES-East) “Red” Visible (0.64 µm) images (above) showed the development of supercell thunderstorms that produced tornadoes, large hail and damaging winds (SPC Storm Reports) across parts of Oklahoma, Kansas and Missouri on 22 May 2019.GOES-16 “Clean” Infrared Window (10.35 µm) images (below) showed the storms as they persisted into the nighttime hours —... Read More
![GOES-16 “Red” Visible (0.64 µm) images, with SPC Storm Reports plotted in red [click to play animation | MP4]](https://cimss.ssec.wisc.edu/satellite-blog/wp-content/uploads/sites/5/2019/05/G16_VIS_MIDWEST_SVR_23MAY2019_2019142_230642_GOES-16_0001PANEL.GIF)
GOES-16 “Red” Visible (0.64 µm) images, with SPC Storm Reports plotted in red [click to play animation | MP4]
1-minute
Mesoscale Domain Sector GOES-16
(GOES-East) “Red” Visible (
0.64 µm) images
(above) showed the development of supercell thunderstorms that produced tornadoes, large hail and damaging winds (
SPC Storm Reports) across parts of Oklahoma, Kansas and Missouri on
22 May 2019.
GOES-16 “Clean” Infrared Window (10.35 µm) images (below) showed the storms as they persisted into the nighttime hours — including storms that produced EF3-rated tornadoes that affected Golden City, Missouri around 0211 UTC (which was responsible for 3 fatalities) and Jefferson City, Missouri around 0440 UTC.
![GOES-16 “Clean” Infrared Window (10.35 µm) images, with SPC Storm Reports plotted in cyan [click to play animation | MP4]](https://cimss.ssec.wisc.edu/satellite-blog/wp-content/uploads/sites/5/2019/05/G16_IR_MIDWEST_SVR_23MAY2019_2019143_044442_GOES-16_0001PANEL.GIF)
GOES-16 “Clean” Infrared Window (10.35 µm) images, with SPC Storm Reports plotted in cyan [click to play animation | MP4]
A closer look at 1-minute GOES-16 Infrared images for the storm producing the EF-3 tornado that affected Golden City, Missouri is shown below. A pulsing updraft with cold
(brighter white) infrared brightness temperature overshooting tops could be seen with the parent supercell as it crossed the Oklahoma/Kansas border around 0000 UTC, moved across extreme southeastern Kansas, then moved into southwestern Missouri around 0100 UTC. The
NWS Springfield damage survey listed the start time of the Garden City tornado at 0151 UTC.
![GOES-16 “Clean” Infrared Window (10.35 µm) images, with SPC Storm Reports plotted in cyan [click to play animation | MP4]](https://cimss.ssec.wisc.edu/satellite-blog/wp-content/uploads/sites/5/2019/05/G16_IR_KSGF_SVR_22MAY2019_2019143_015342_GOES-16_0001PANEL.GIF)
GOES-16 “Clean” Infrared Window (10.35 µm) images, with SPC Storm Reports plotted in cyan [click to play animation | MP4]
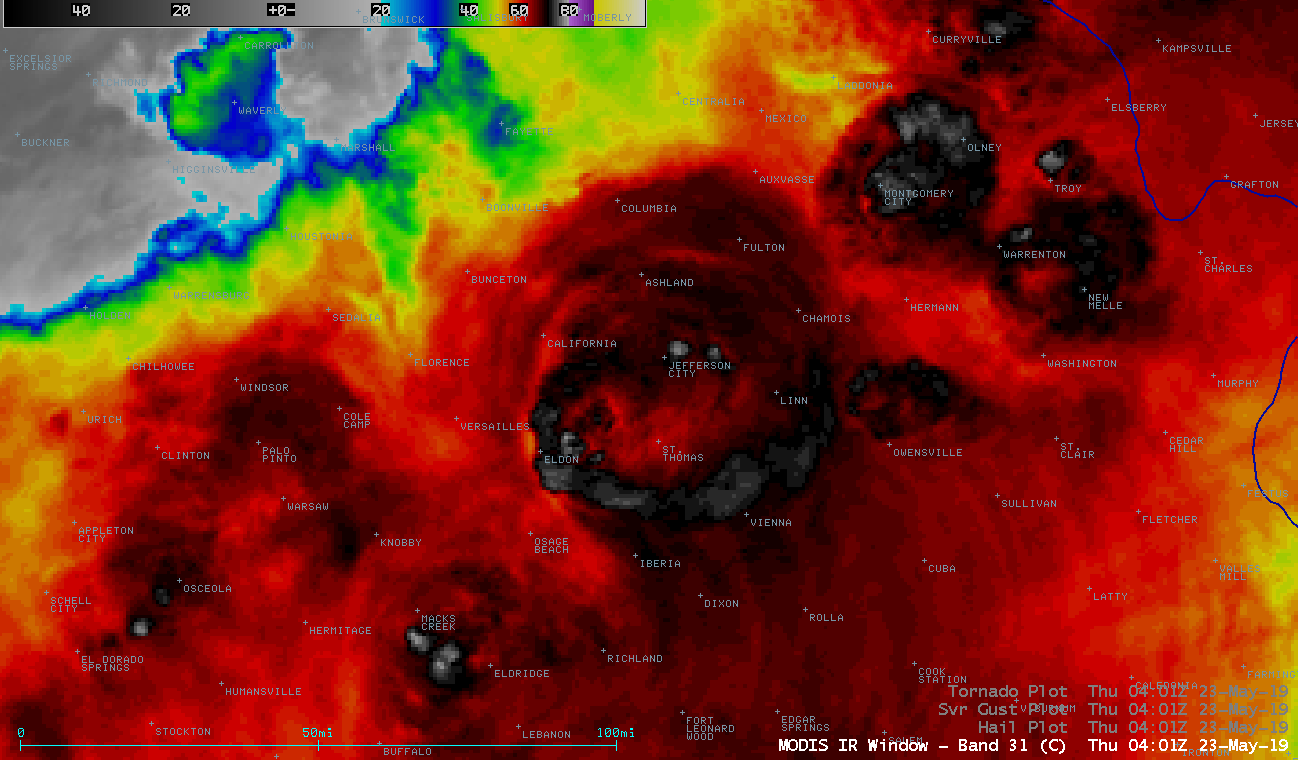
About 20 minutes prior to the Jefferson City tornado, a Terra MODIS Infrared Window (11.0 µm) image
(below) displayed a well-defined
Enhanced-V storm top signature.
![Terra MODIS Infrared Window (11.0 µm) image. with plot of SPC storm reports [click to enlarge]](https://cimss.ssec.wisc.edu/satellite-blog/wp-content/uploads/sites/5/2019/05/190423_0401utc_terra_modis_infrared_spcStormReports_Jefferson_City_MO_anim.gif)
Terra MODIS Infrared Window (11.0 µm) image, with plot of SPC storm reports [click to enlarge]
A closer look at 1-minute GOES-16 Infrared images for the storm producing the EF-3 tornado that affected Jefferson City (KJEF) is shown below — of note are the 2 pre-tornado updraft pulses west/southwest of KJEF at
0346 UTC and
0359 UTC, when cloud-top infrared brightness temperatures briefly cooled to -81ºC and -82ºC, respectively
(violet pixels). The
NWS St. Louis storm survey indicated that the tornado which eventually moved through Jefferson City began southwest of the city at 0420 UTC.
![GOES-16 “Clean” Infrared Window (10.35 µm) images, with SPC Storm Reports plotted in cyan [click to play animation | MP4]](https://cimss.ssec.wisc.edu/satellite-blog/wp-content/uploads/sites/5/2019/05/G16_IR_KJEF_SVR_22MAY2019_2019143_044045_GOES-16_0001PANEL.GIF)
GOES-16 “Clean” Infrared Window (10.35 µm) images, with SPC Storm Reports plotted in cyan [click to play animation | MP4]
A few hours later, a sequence of 3 VIIRS Infrared Window (11.45 µm) images
(below) from Suomi NPP and NOAA-20 showed the line of supercell thunderstorms between 0704 and 0844 UTC.
![VIIIRS Infrared Window (11.45 µm) images from Suomi NPP (0704 and 0844 UTC) and NOAA-20 (0754 UTC) [click to enlarge]](https://cimss.ssec.wisc.edu/satellite-blog/wp-content/uploads/sites/5/2019/05/190523_suomiNPP_noaa20_viirs_infrared_Midwest_anim.gif)
VIIRS Infrared Window (11.45 µm) images from Suomi NPP (0704 and 0844 UTC) and NOAA-20 (0754 UTC) [click to enlarge]
A closer view of the Suomi NPP VIIRS Infrared Window (11.45 µm) image at 0704 UTC
(below) revealed another well defined Enhanced-V signature in far northeastern Oklahoma.
![Suomi NPP VIIRS Infrared Window (11.45 µm) image at 0704 UTC [click to enlarge]](https://cimss.ssec.wisc.edu/satellite-blog/wp-content/uploads/sites/5/2019/05/VIIRS_11.45_BT_20190523_0704.png)
Suomi NPP VIIRS Infrared Window (11.45 µm) image at 0704 UTC [click to enlarge]
The Suomi NPP VIIRS Infrared Window (11.45 µm) image at 0844 UTC
(below) depicted an example of a warm “moat” surrounding a cold overshooting top having a minimum infrared brightness temperature of -81ºC
(violet enhancement) east of Patoka, Illinois.
![Suomi NPP VIIRS Infrared Window (11.45 µm) image at 0844 UTC [click to enlarge]](https://cimss.ssec.wisc.edu/satellite-blog/wp-content/uploads/sites/5/2019/05/VIIRS_11.45_BT_20190523_0844.png)
Suomi NPP VIIRS Infrared Window (11.45 µm) image at 0844 UTC [click to enlarge]
View only this post
Read Less
![GOES-16 “Red” Visible (0.64 µm) images, with SPC Storm Reports plotted in red [click to play animation | MP4]](https://cimss.ssec.wisc.edu/satellite-blog/wp-content/uploads/sites/5/2019/05/190522_goes16_visible_spcStormReports_Midwest_anim.gif)
![GOES-16 “Clean” Infrared Window (10.35 µm) images, with SPC Storm Reports plotted in cyan [click to play animation | MP4]](https://cimss.ssec.wisc.edu/satellite-blog/wp-content/uploads/sites/5/2019/05/190522_goes16_infrared_spcStormReports_Midwest_anim.gif)
![GOES-16 “Clean” Infrared Window (10.35 µm) images, with SPC Storm Reports plotted in cyan [click to play animation | MP4]](https://cimss.ssec.wisc.edu/satellite-blog/wp-content/uploads/sites/5/2019/05/190522_goes16_infrared_spcStormReports_Golden_City_MO_anim.gif)
![GOES-16 “Clean” Infrared Window (10.35 µm) images, with SPC Storm Reports plotted in cyan [click to play animation | MP4]](https://cimss.ssec.wisc.edu/satellite-blog/wp-content/uploads/sites/5/2019/05/190522_goes16_infrared_spcStormReports_KJEF_anim.gif)
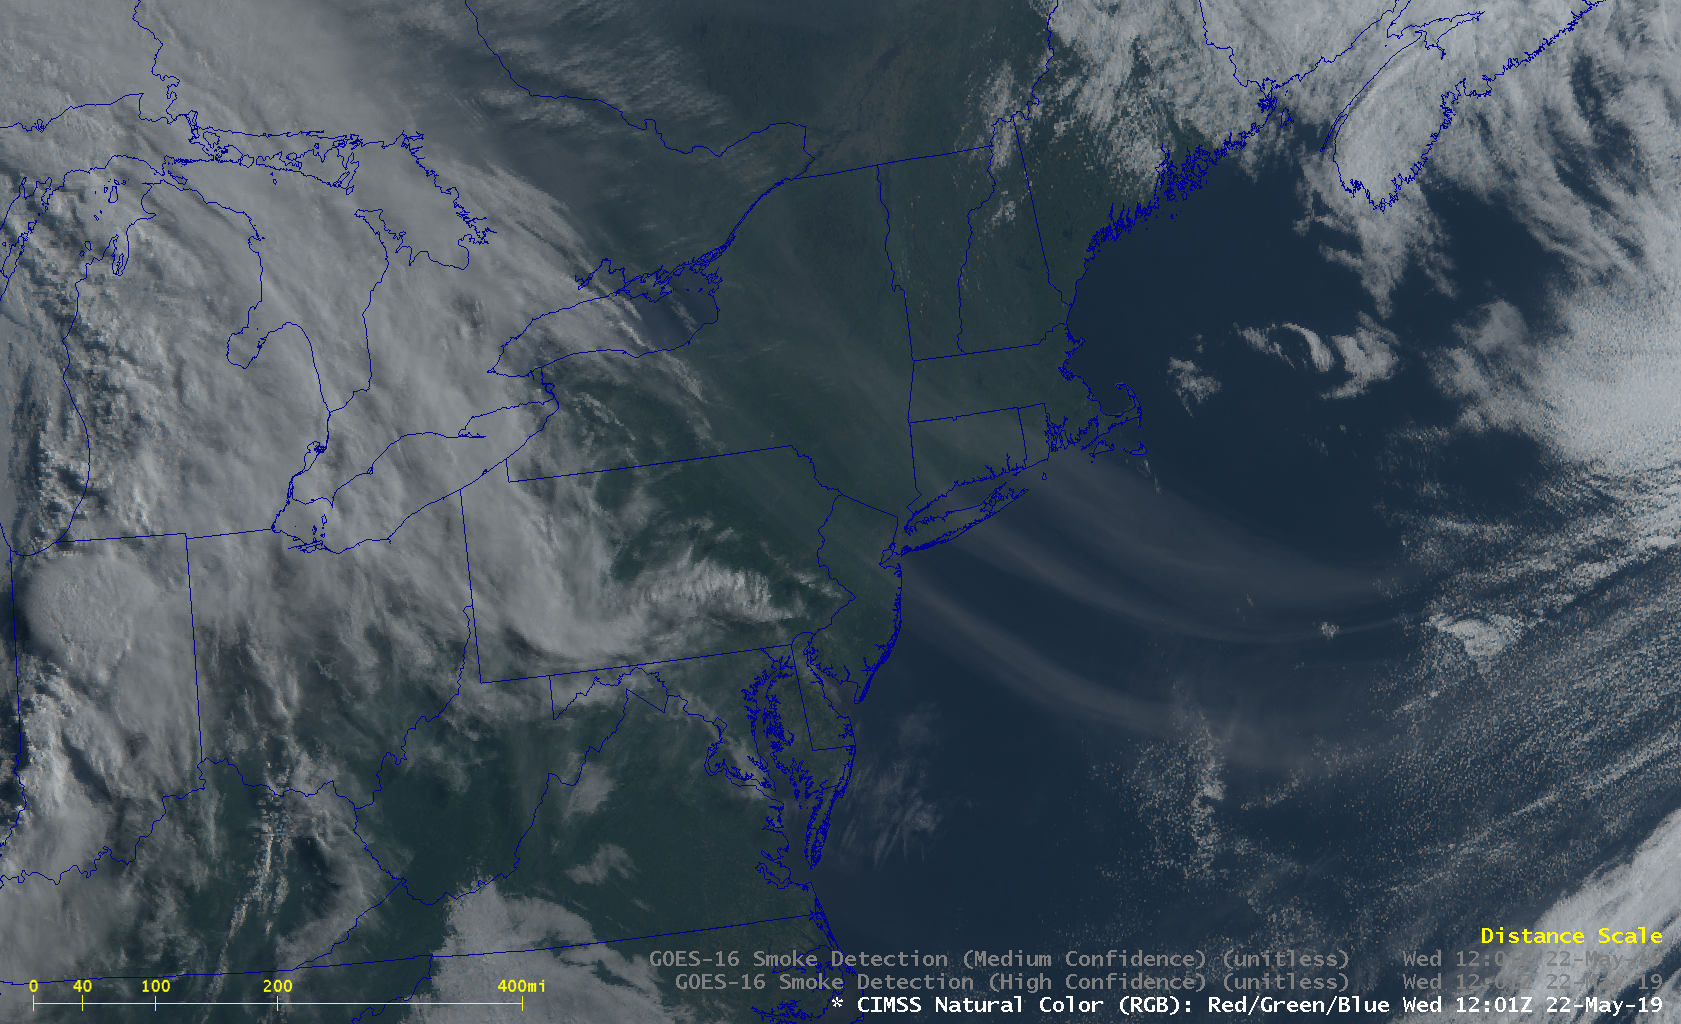
![GOES-16 CIMSS Natural Color images, with an overlay of the Smoke Detection Product ;click to play animation | MP4]](https://cimss.ssec.wisc.edu/satellite-blog/wp-content/uploads/sites/5/2019/05/190522_goes16_naturalColor_smokeDetection_Northeast_US_anim.gif)
![Suomi NPP VIIRS Day/Night Band (0.7 µm) and Infrared Window (11.45 µm) images at 0722 UTC [click to enlarge]](https://cimss.ssec.wisc.edu/satellite-blog/wp-content/uploads/sites/5/2019/05/190522_0722utc_suomiNPP_viirs_dayNightBand_infraredWindow_Northeast_US_smoke_anim.gif)
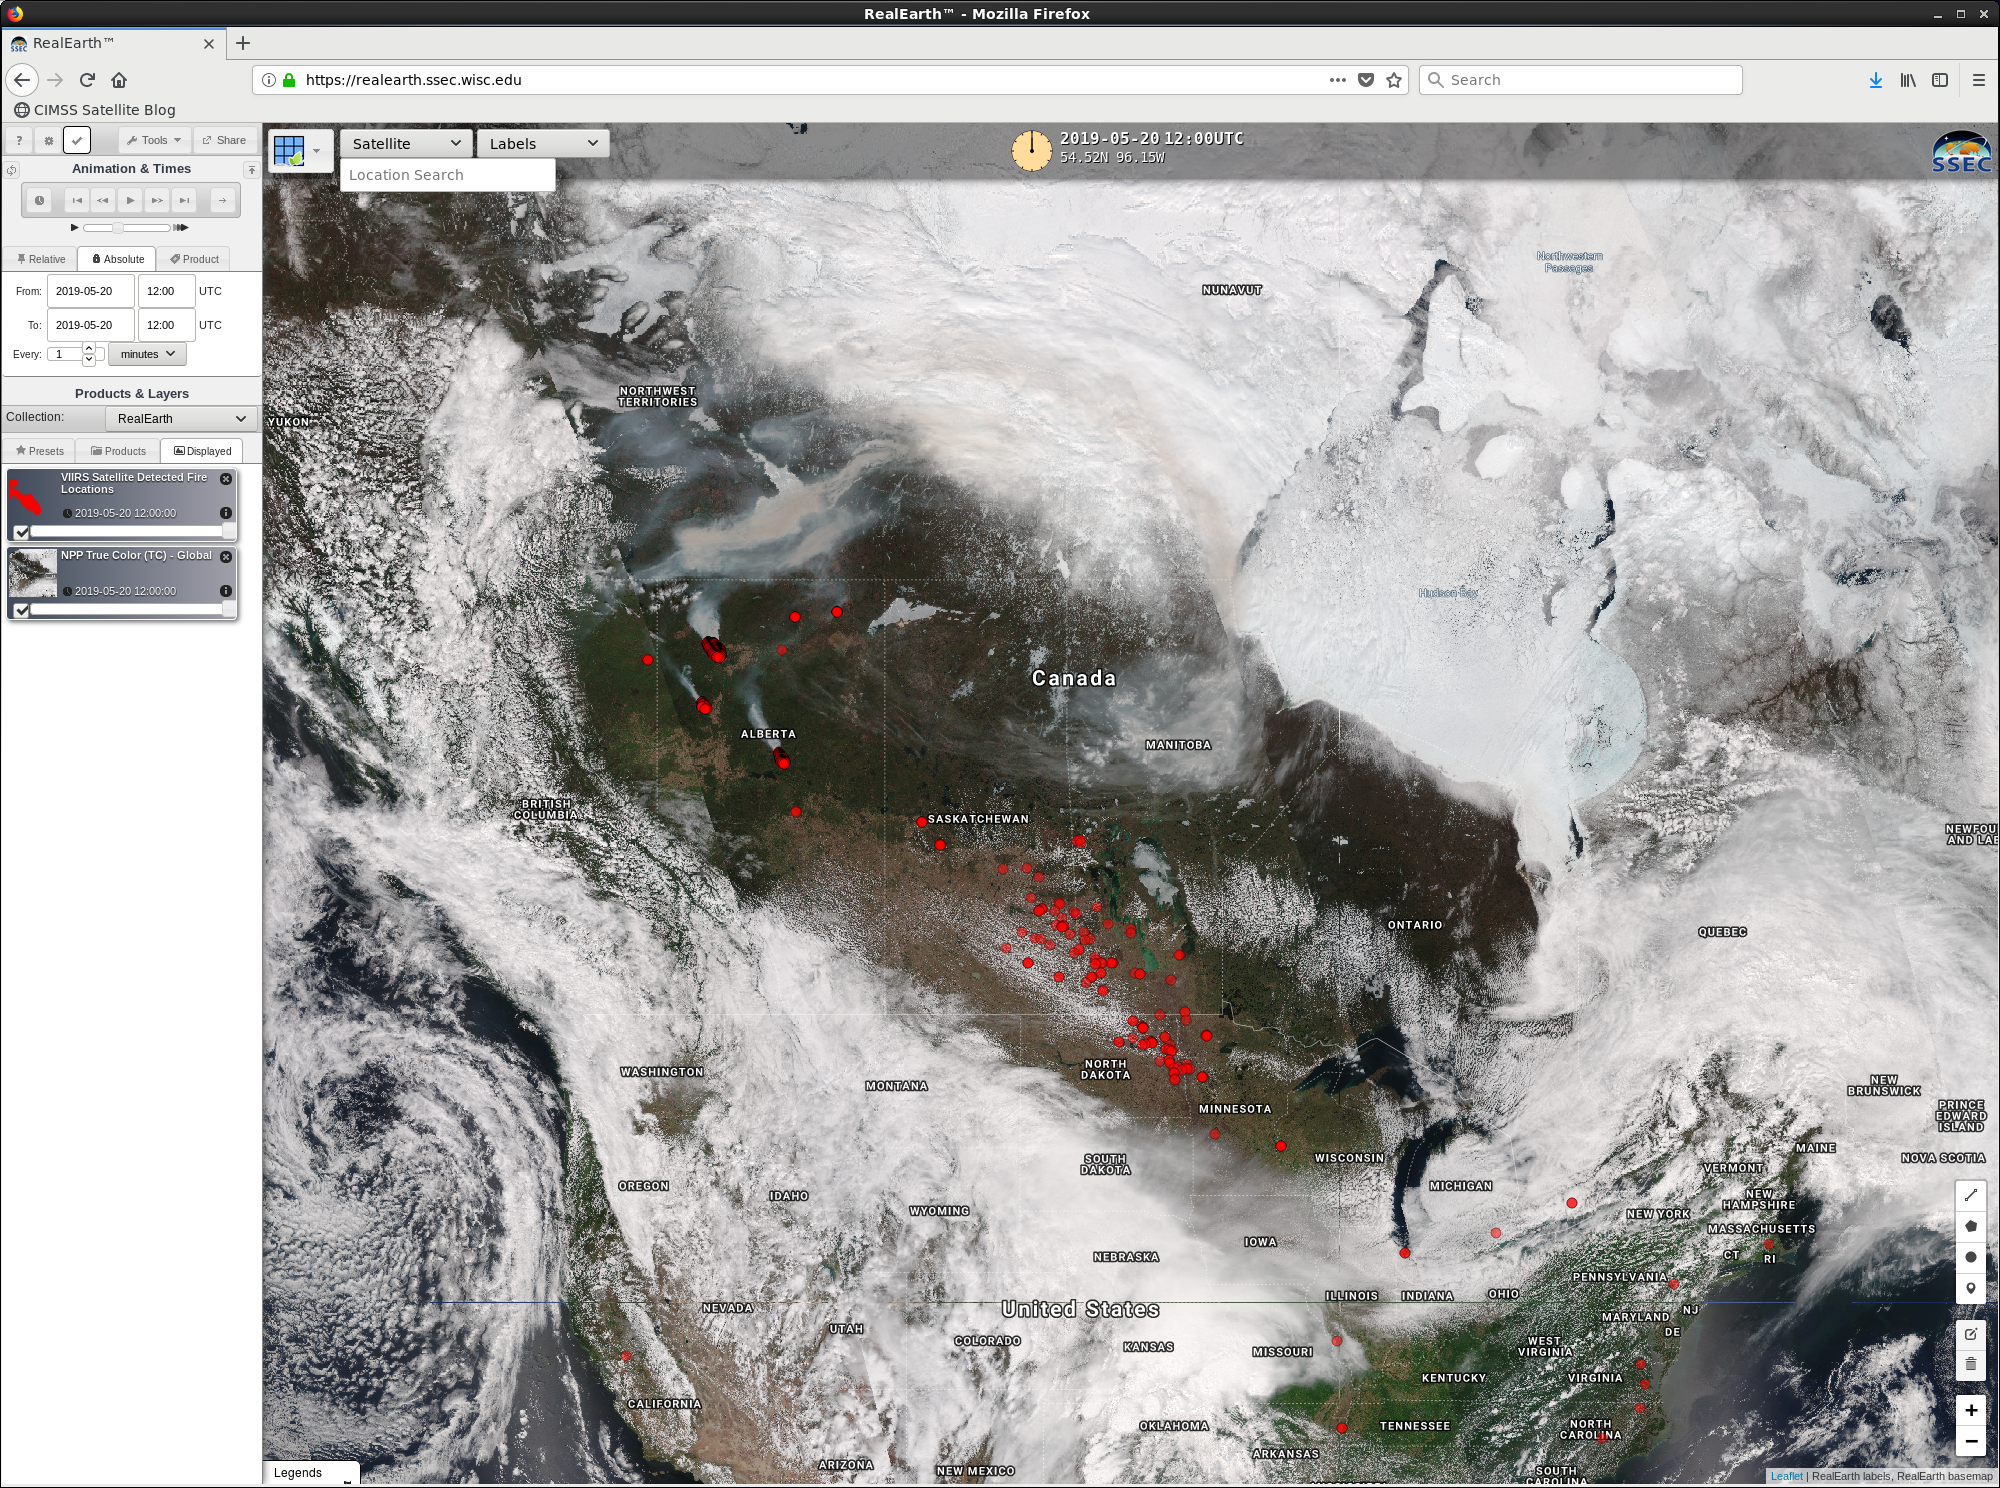
![Daily composites of Suomi NPP VIIRS True Color RGB images with Fire Detections, 18-22 May [click to play animation]](https://cimss.ssec.wisc.edu/satellite-blog/wp-content/uploads/sites/5/2019/05/190518_190522_suomiNPP_truecolor_Alberta_wildfire_smoke_anim.gif)
![HYSPLIT model 72-hour back trajectories from 3 points off the Northeast US coast [click to enlarge]](https://cimss.ssec.wisc.edu/satellite-blog/wp-content/uploads/sites/5/2019/05/190522_12utc_Northeast_US_smoke_trajectories.gif)
![6-hourly GFS 500 hPa analyses [click to enlarge]](https://cimss.ssec.wisc.edu/satellite-blog/wp-content/uploads/sites/5/2019/05/190518_190522_500hPa_analyses_anim.gif)
![GOES-16 "Clean" Infrared Window (10.35 µm) images, with SPC Storm Reports plotted in cyan [click to play MP4 animation]](https://cimss.ssec.wisc.edu/satellite-blog/wp-content/uploads/sites/5/2019/05/G16_IR_TX_OK_SVR_20MAY2019_2019140_234741_GOES-16_0001PANEL.GIF)
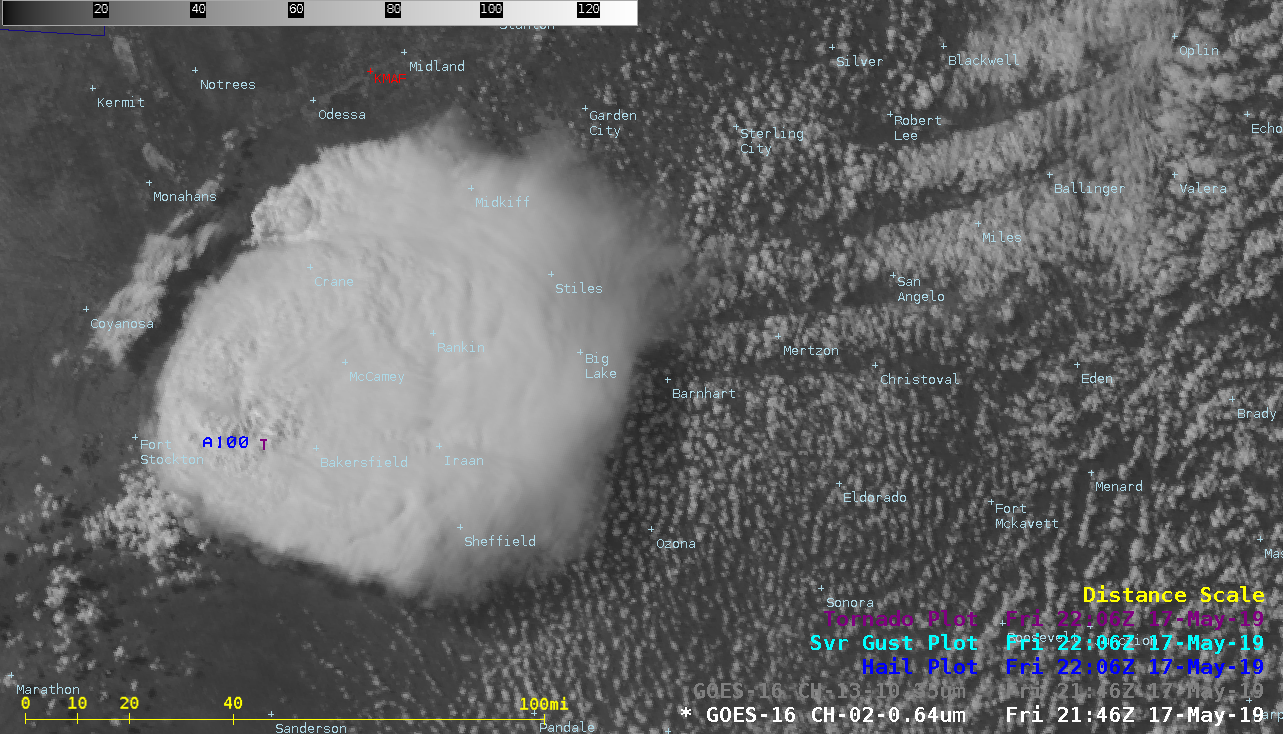
![GOES-16 "Red" Visible (0.64 µm) images, with SPC Storm Reports plotted in red [click to play MP4 animation]](https://cimss.ssec.wisc.edu/satellite-blog/wp-content/uploads/sites/5/2019/05/G16_VIS_ZOOM_TX_OK_SVR_20MAY2019_2019140_203941_GOES-16_0001PANEL.GIF)
![GOES-16 "Clean" Infrared Window (10.35 µm) images, with SPC Storm Reports plotted in cyan [click to play MP4 animation]](https://cimss.ssec.wisc.edu/satellite-blog/wp-content/uploads/sites/5/2019/05/G16_IR_TX_OK_SVR_ZOOM_20MAY2019_2019140_203941_GOES-16_0001PANEL.GIF)
![GOES-16 Low-level (7.3 µm), Mid-level (6.9 µm) and Upper-level (6.2 µm) Water Vapor images [click to play MP4 animation]](https://cimss.ssec.wisc.edu/satellite-blog/wp-content/uploads/sites/5/2019/05/tx_wv8-20190520_220841.png)
![GOES-16 Split Window Difference (10.3-12.3 µm) images [click to play animation | MP4]](https://cimss.ssec.wisc.edu/satellite-blog/wp-content/uploads/sites/5/2019/05/190520_goes16_splitWindowDifference_NM_TX_blowing_dust_anim.gif)
![Suomi NPP VIIRS True Color and False Color RGB images, along with the Flood Detection Product [click to enlarge]](https://cimss.ssec.wisc.edu/satellite-blog/wp-content/uploads/sites/5/2019/05/190521_suomiNPP_viirs_truecolor_falsecolor_floodingLandFraction_OK_anim.gif)
![Terra MODIS False Color RGB images over northern Oklahoma on 15 May and 21 May [click to enlarge]](https://cimss.ssec.wisc.edu/satellite-blog/wp-content/uploads/sites/5/2019/05/190515_190521_modis_falsecolor_OK_anim.gif)

![GOES-16 "Clean" Infrared Window (10.35 µm) images, with SPC Storm Reports plotted in cyan [click to play animation | MP4]](https://cimss.ssec.wisc.edu/satellite-blog/wp-content/uploads/sites/5/2019/05/190517_goes16_infrared_spcStormReports_KS_NE_anim.gif)
![GOES-16 "Clean" Infrared Window (10.35 µm) images, with SPC Storm Reports plotted in cyan [click to play animation | MP4]](https://cimss.ssec.wisc.edu/satellite-blog/wp-content/uploads/sites/5/2019/05/190517_goes16_infrared_spcStormReports_KS_anim.gif)
![GOES-17 "Red" Visible (0.64 µm) and "Clean" Infrared Window (10.35 µm) images, with plots of SPC Storm Reports [click to play MP4 animation]](https://cimss.ssec.wisc.edu/satellite-blog/wp-content/uploads/sites/5/2019/05/tx_vis_oa_g17-20190517_214627.png)

