![Sequence of Infrared Window images from Terra/Aqua MODIS (11.0 µm) and Suomi NPP VIIRS (11.45 µm) [click to enlarge]](https://cimss.ssec.wisc.edu/satellite-blog/wp-content/uploads/sites/5/2018/10/181010_modis_viirs_infrared_am_Michael_anim.gif)
Infrared Window images from Terra/Aqua MODIS (11.0 µm) and NOAA-20/Suomi NPP VIIRS (11.45 µm) [click to enlarge]
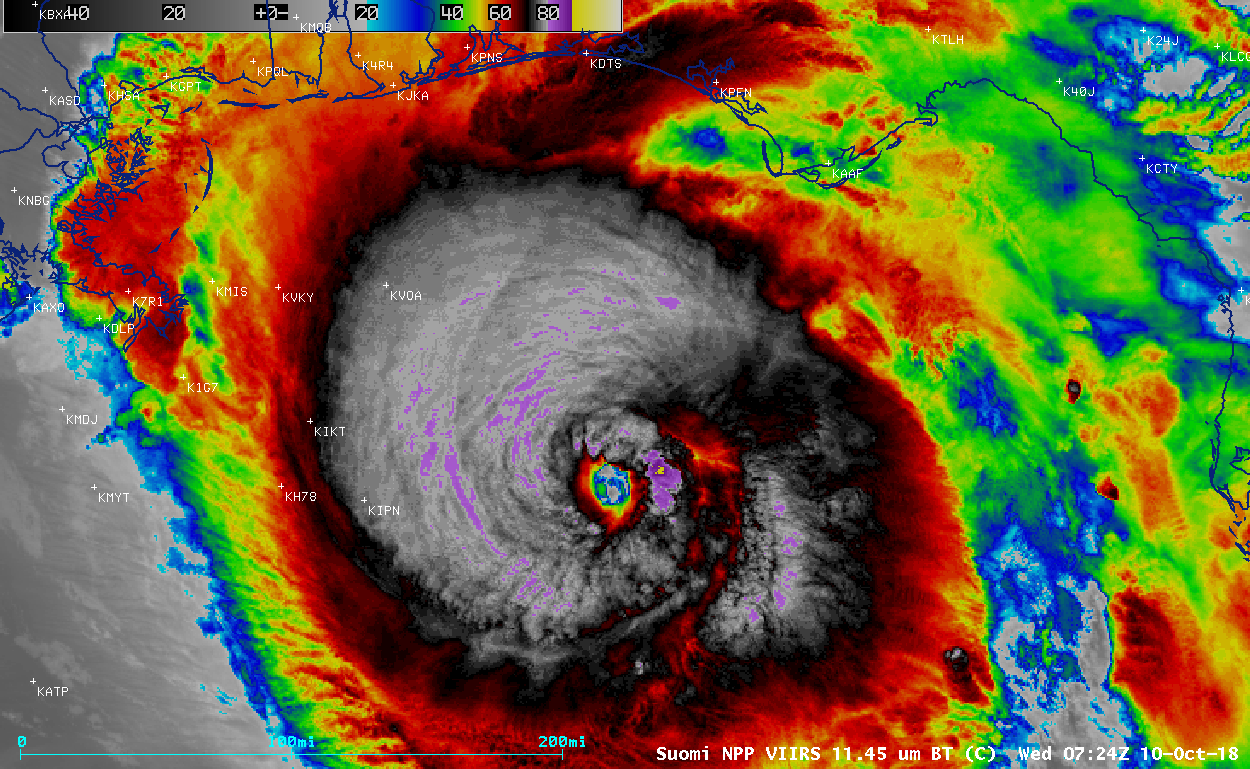
A sequence of Infrared Window images from Terra/Aqua MODIS (11.0 µm) and NOAA-20/Suomi NPP VIIRS (11.45 µm)
(above) showed
Category 4 Hurricane Michael as it was making its approach toward the Florida coast during the nighttime hours preceding sunrise on
10 October 2018. The yellow pixels east of the eye on the
0724 UTC VIIRS image highlighted cloud-top infrared brightness temperatures of -90ºC and colder (with a minimum of -92ºC).
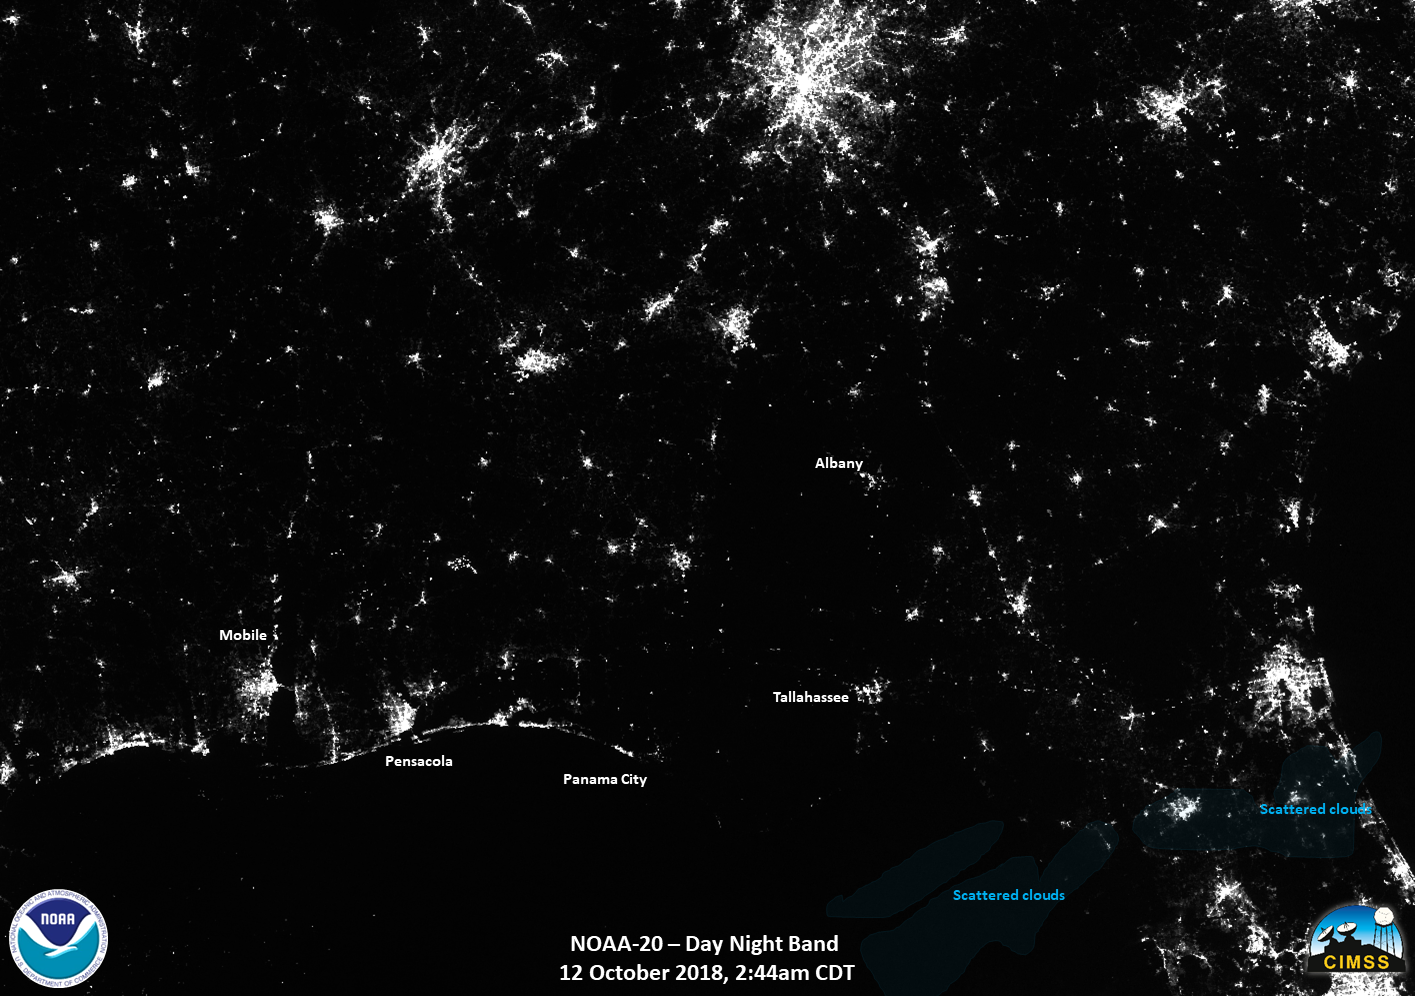
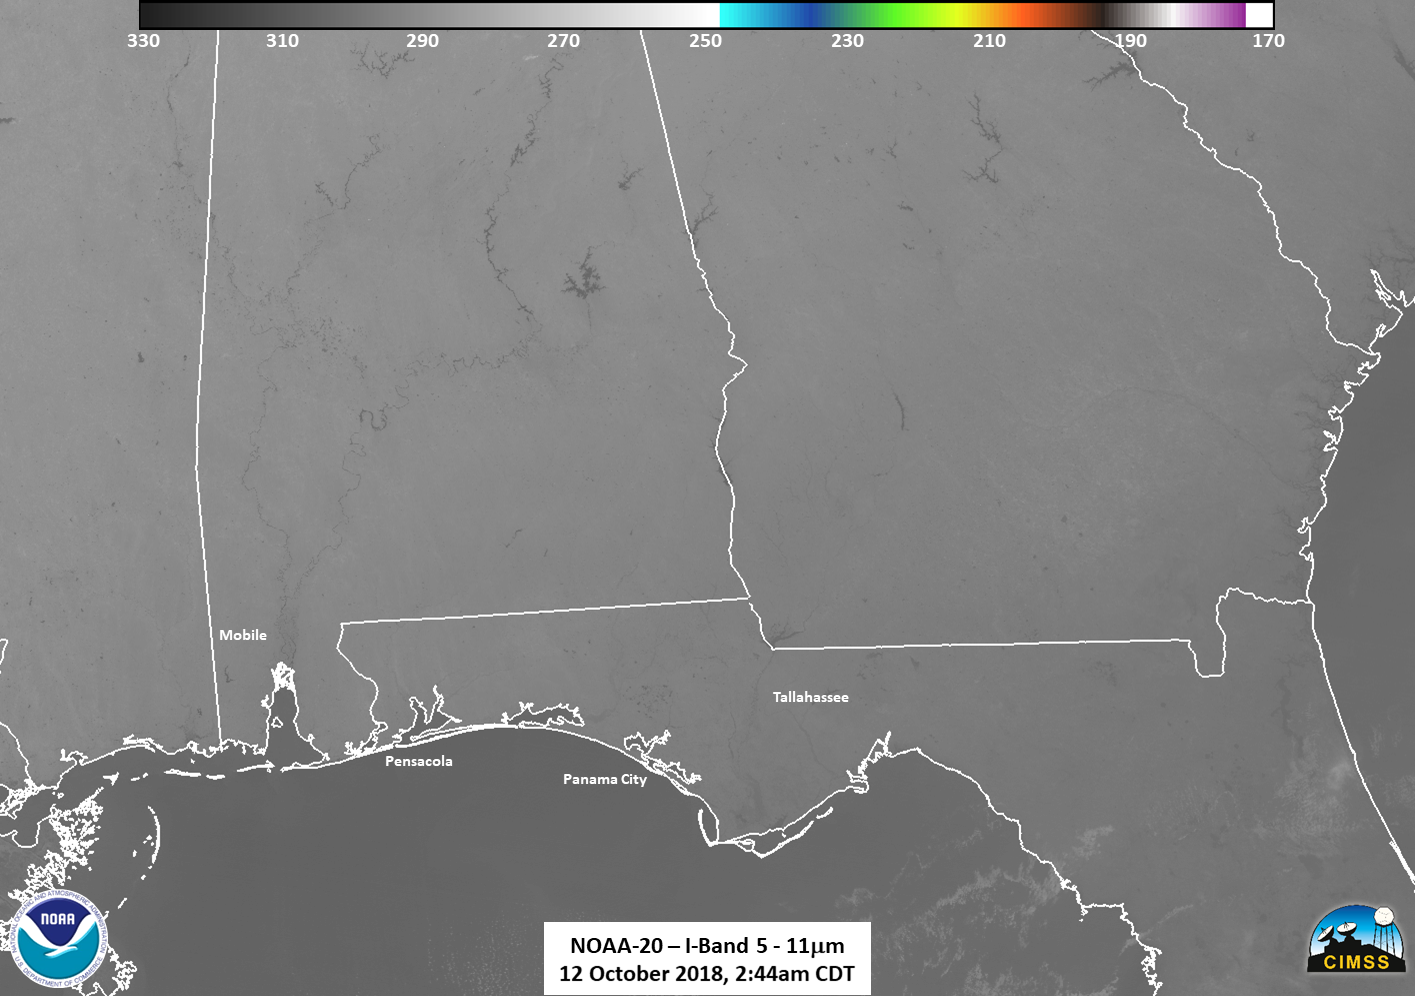
Toggles between VIIRS Day/Night Band (0.7 µm) and Infrared Window (11.45 µm) images from NOAA-20 and Suomi NPP (below; courtesy of William Straka, CIMSS) revealed convectively-generated mesospheric airglow waves propagating away from the hurricane.
![NOAA-20 VIIRS Day/Night Band (0.7 µm) and Infrared Window (11.45 µm) images [click to enlarge]](https://cimss.ssec.wisc.edu/satellite-blog/wp-content/uploads/sites/5/2018/10/181010_0642utc_noaa20_viirs_DayNightBand_InfraredWindow_Hurricane_Michael_anim.gif)
NOAA-20 VIIRS Day/Night Band (0.7 µm) and Infrared Window (11.45 µm) images [click to enlarge]
![Suomi NPP VIIRS Day/Night Band (0.7 µm) and Infrared Window (11.45 µm) images [click to enlarge]](https://cimss.ssec.wisc.edu/satellite-blog/wp-content/uploads/sites/5/2018/10/181010_0732utc_suomiNPP_viirs_DayNightBand_InfraredWindow_Hurricane_Michael_anim.gif)
Suomi NPP VIIRS Day/Night Band (0.7 µm) and Infrared Window (11.45 µm) images [click to enlarge]
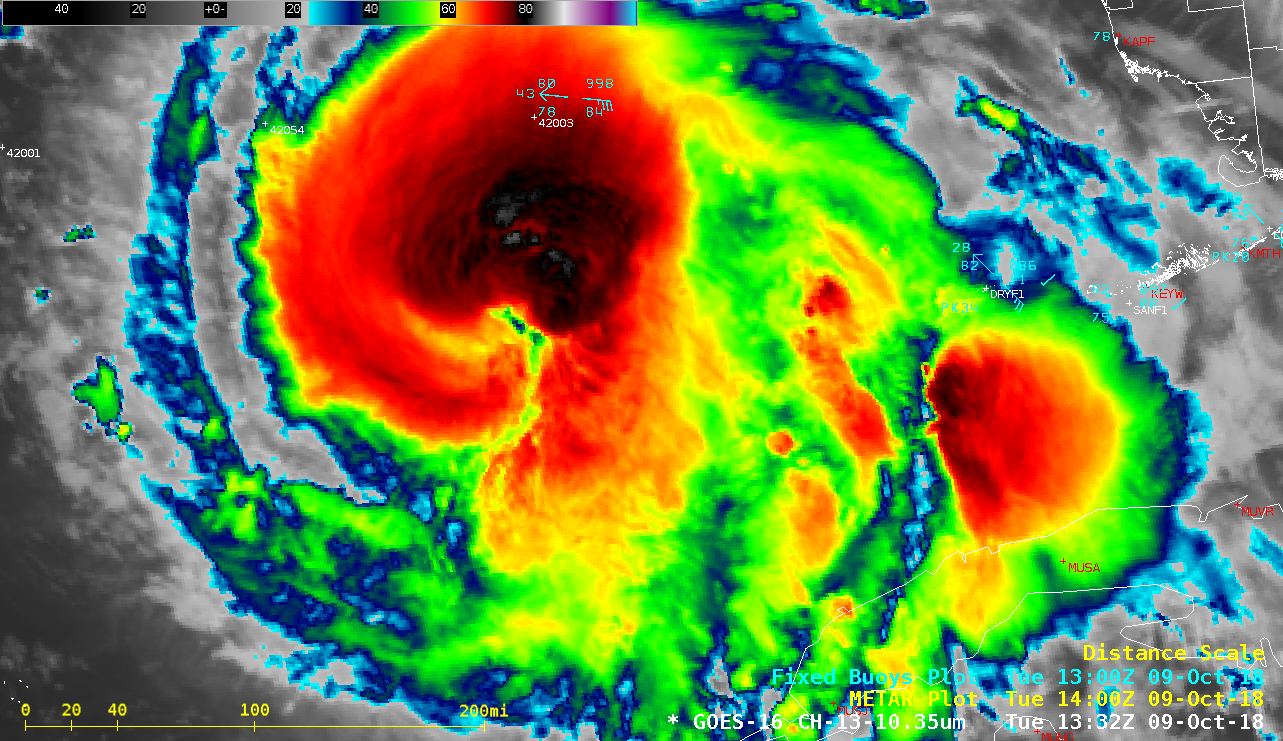
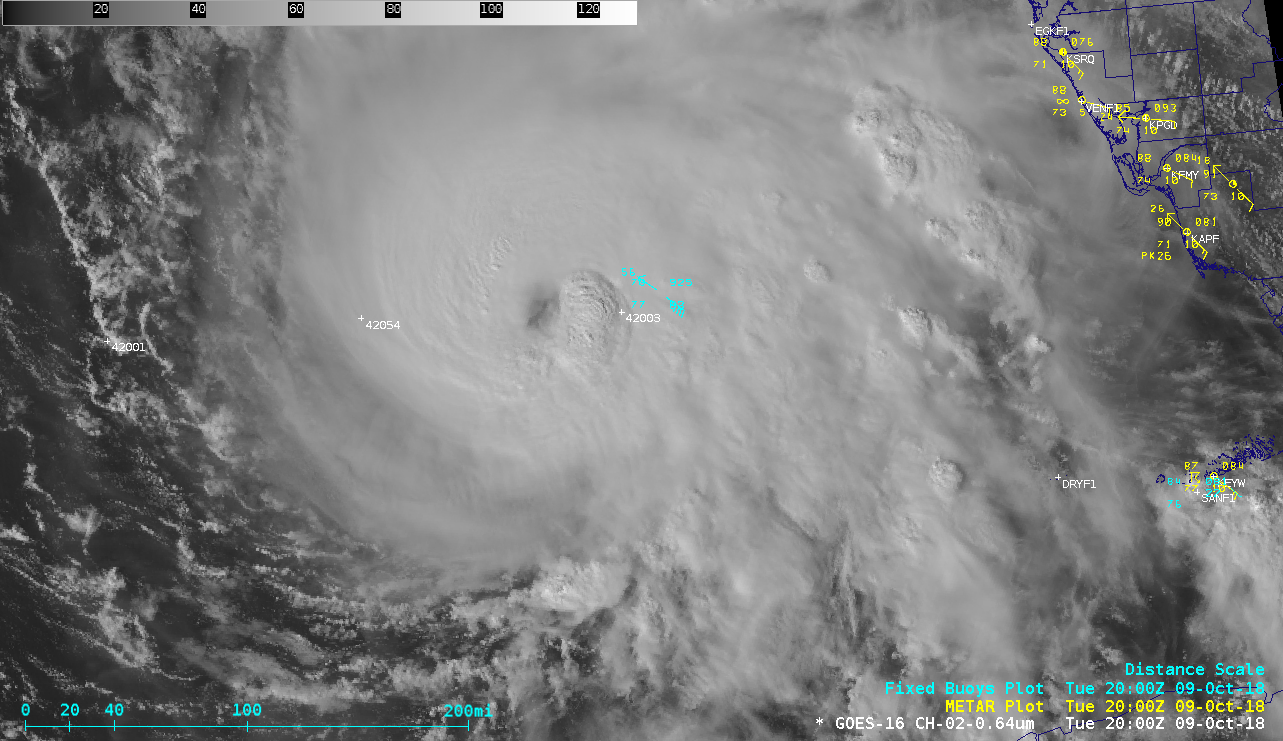
Overlapping GOES-16
(GOES-East) Mesoscale Domain Sectors provided
30-second interval “Clean” Infrared Window (
10.3 µm) and “Red” Visible (
0.64 µm) images of Michael after sunrise
(below).
GOES-16 “Clean” Infrared Window (10.3 µm) images [click to play MP4 animation]
![GOES-16 "Red" Visible (0.64 µm) images [click to play MP4 animation]](https://cimss.ssec.wisc.edu/satellite-blog/wp-content/uploads/sites/5/2018/10/g16_vis_mich_fl-20181010_121928.png)
GOES-16 “Red” Visible (0.64 µm) images [click to play MP4 animation]
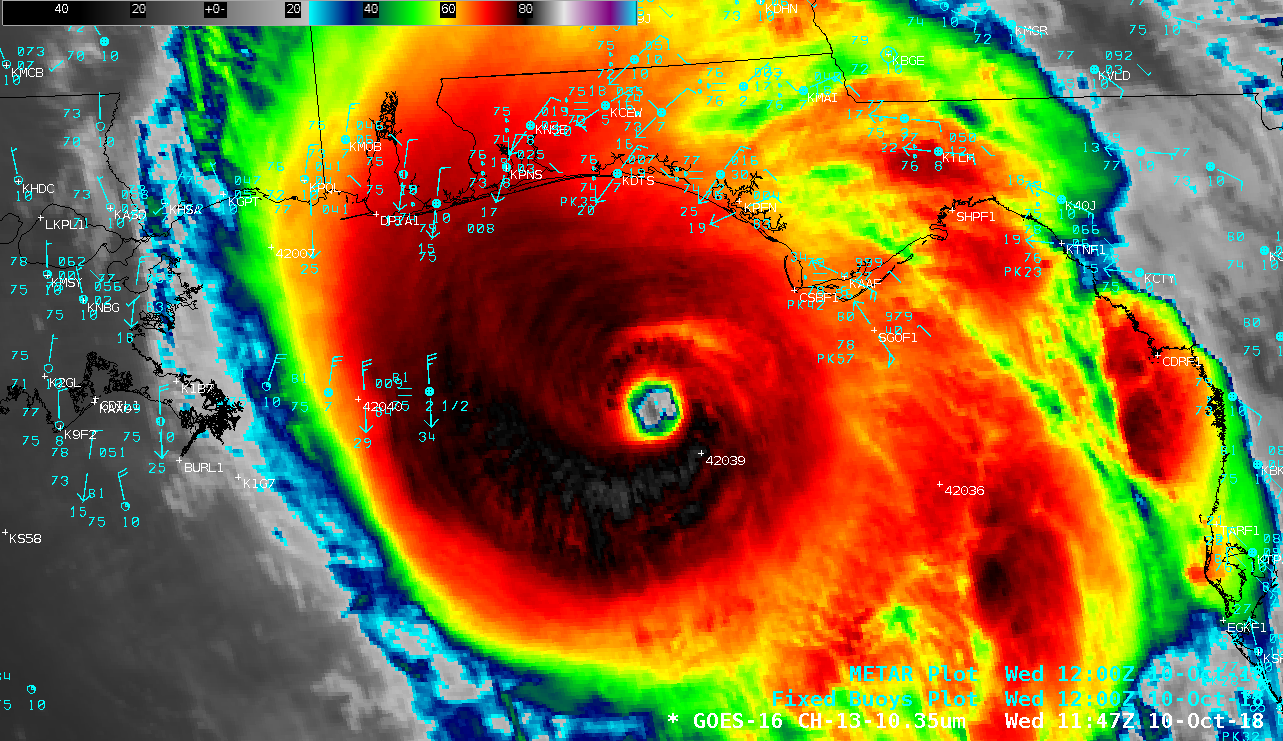
Closer views of GOES-16 Visible and Infrared images
(below) showed Hurricane Michael making landfall around 1730-1745 UTC near Mexico Beach, Florida as a
Category 5 storm with estimated maximum sustained winds of 140 knots (160 mph) and a minimum central pressure of 919 hPa (27.41 inches). During the 24-hour period prior to landfall, Michael had been moving over water having
moderate Ocean Heat Content and warm Sea Surface Temperatures; and as had been the case during much of Michael’s time as a hurricane, in spite of the fact that
deep-layer wind shear was somewhat unfavorable (
09 October |
10 October landfall), the storm was still able to maintain a trend of intensification (
ADT |
SATCON). Additional information regarding the landfall of Michael (and its historical significance) is available
here.
![GOES-16 "Red" Visible (0.64 µm) images [click to play MP4 animation]](https://cimss.ssec.wisc.edu/satellite-blog/wp-content/uploads/sites/5/2018/10/vis_zoom_mich-20181010_160228.png)
GOES-16 “Red” Visible (0.64 µm) images [click to play MP4 animation]
![GOES-16 "Clean" Infrared Window (10.3 µm) images [click to play MP4 animation]](https://cimss.ssec.wisc.edu/satellite-blog/wp-content/uploads/sites/5/2018/10/ir_zoom_mich-20181010_160228.png)
GOES-16 “Clean” Infrared Window (10.3 µm) images [click to play MP4 animation]
GOES-16
Geostationary Lightning Mapper (GLM) Groups — aggregates of individual lightning Events — are plotted on 30-second GOES-16 Visible images
(below). The red symbols denote lightning Groups within the 1-minute period immediately preceding the Visible image time. The native GLM
parallax correction is turned
off — so the lightning locations correspond to where the satellite viewed the lightning signatures at the tops of the clouds.
GOES-16 “Red” Visible (0.64 µm) images, with GLM lightning Groups plotted in red [click to play MP4 animation]
As pointed out on
Twitter by the SOO at NWS Nashville, GOES-16 Visible imagery
(below) revealed the bright white sandy beaches of Saint Andrew Sound (
Google Maps) as the eye of Michael passed overhead.
Surface observations from
Panama City (KECP),
Tyndall AFB (KPAM) and
Apalachicola (KAAF) are plotted on the images — all 3 sites stopped reporting after landfall, presumably due to
power outages (the peak wind gust at Tyndall AFB was
129 mph). A longer animation (from 1300-1959 UTC) of 30-second GOES-16 Visible images is available
here (courtesy of Pete Pokrandt, UW-AOS).

GOES-16 “Red” Visible (0.64 µm) images, with surface observations and with/without a map overlay [click to play animation | MP4]
The signature of the beaches was also evident on GOES-17 Visible imagery
(below) — but since that satellite was scanning at the standard 5-minute interval, they were only seen on 2 consecutive images. Note that GOES-17 imagery shown here is preliminary and non-operational.
![GOES-17 "Red" Visible (0.64 µm) images, with surface observations and with/without a map overlay [click to enlarge]](https://cimss.ssec.wisc.edu/satellite-blog/wp-content/uploads/sites/5/2018/10/181010_goes17_visible_Michael_eye_landfall_anim.gif)
GOES-17 “Red” Visible (0.64 µm) images, with surface observations and with/without a map overlay [click to enlarge]
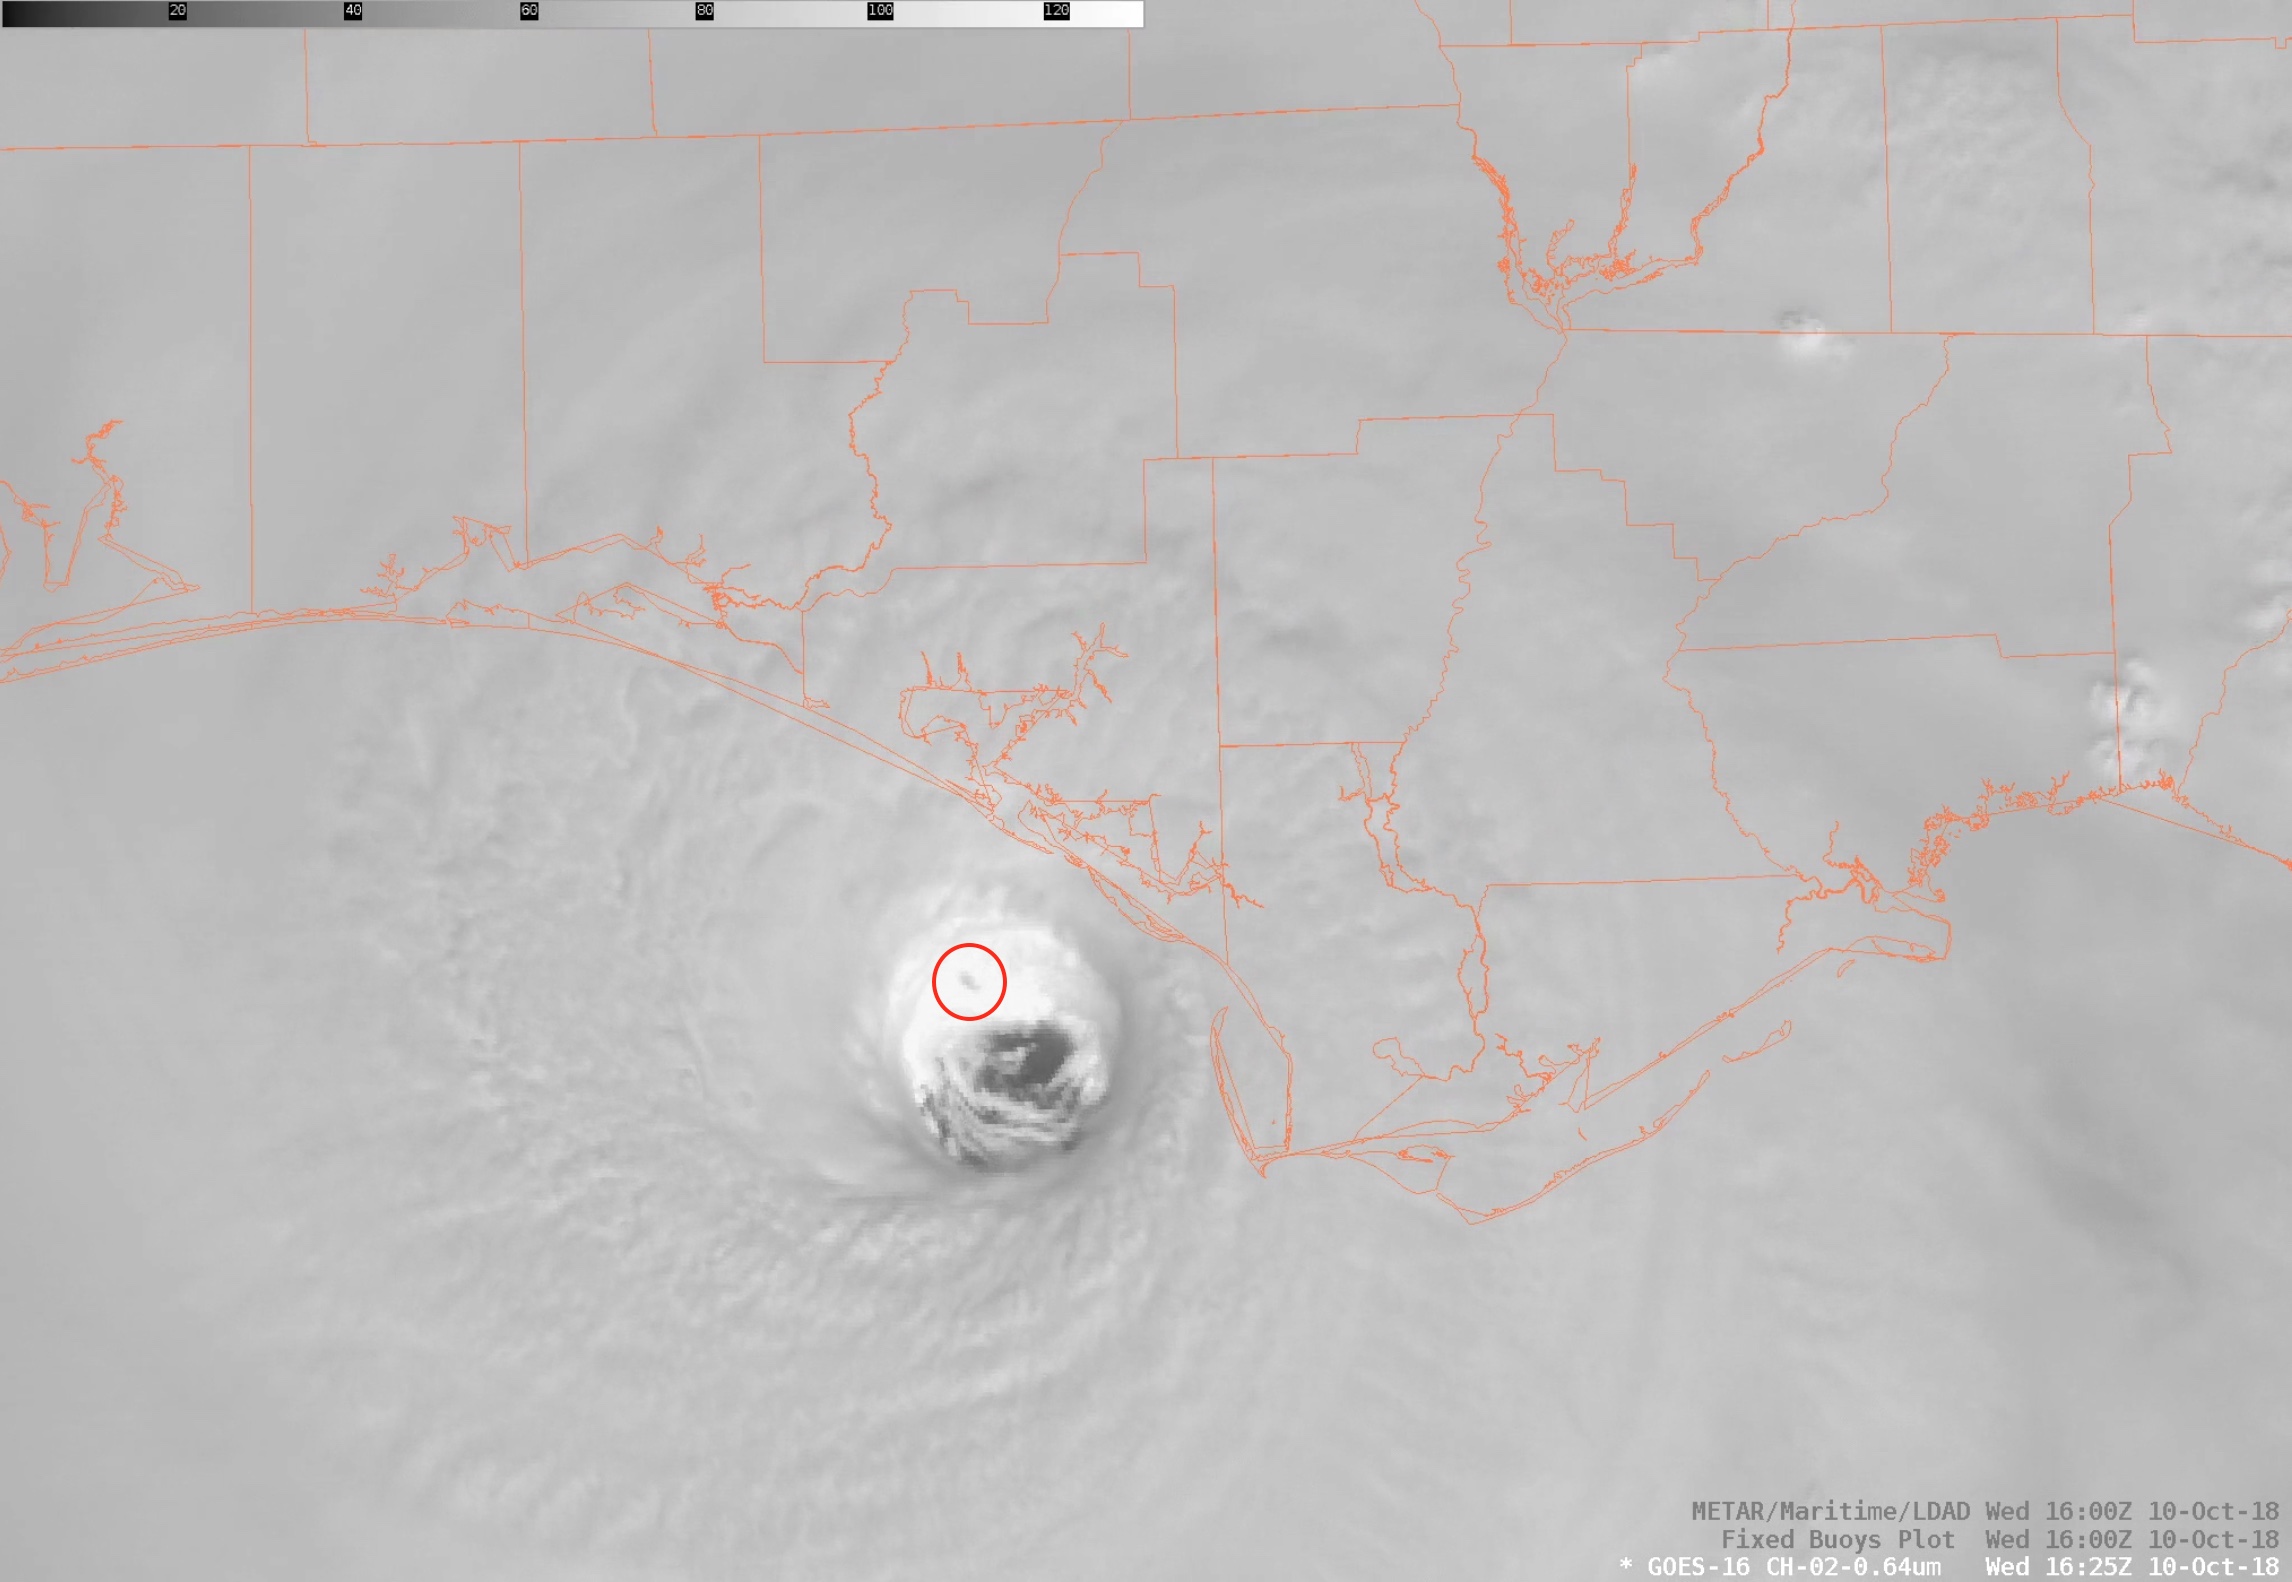
One item of local curiosity that was observed on GOES-16 Visible imagery: a darker shadow-like feature within the eye, which slowly migrated from the northern to the western portion during the 1613-1642 UTC period (
1625 UTC still image |
MP4 animation). Closer inspection of the GOES-16
ABI Near-Infrared and Infrared spectral bands
(below) indicated that this was indeed a cloud shadow, from a cirrus filament that became detached from the southeastern edge of the eyewall and then rotated cyclonically within the eye to cast a shadow against the brightly-illuminated quasi-vertical edges of the eyewall.
![16-panel images of all GOES-16 ABI spectral bands [click to play animation | MP4]](https://cimss.ssec.wisc.edu/satellite-blog/wp-content/uploads/sites/5/2018/10/16p-20181010_162220_anot.png)
All 16 spectral bands of the GOES-16 ABI [click to play animation | MP4]
A sequence of Infrared Window images from Aqua MODIS (11.0 µm) and NOAA-20/Suomi NPP VIIRS (11.45 µm)
(below) provided a high-resolution view of the cold cloud tops associated with Michael during and shortly after landfall.
![Infrared Window images from Aqua MODIS (11.0 µm) and NOAA-20/Suomi NPP VIIRS (11.45 µm) [click to enlarge]](https://cimss.ssec.wisc.edu/satellite-blog/wp-content/uploads/sites/5/2018/10/181010_modis_viirs_infrared_pm_Michael_anim.gif)
Infrared Window images from Aqua MODIS (11.0 µm) and NOAA-20/Suomi NPP VIIRS (11.45 µm) [click to enlarge]
On a larger scale, GOES-16 mid/upper-level Derived Motion Winds from the
CIMSS Tropical Cyclones site
(below) revealed the development of a well-defined outflow channel to the north of the storm, especially during the 12 hours prior to landfall — this enhanced poleward outflow (aided by the approach of an upper-level trough from the central US) may have been a contributing factor in Michael’s continued intensification leading up to landfall.
![GOES-16 Mid/Upper-level winds, 21 UTC on 09 October to 21 UTC on 10 October [click to enlarge]](https://cimss.ssec.wisc.edu/satellite-blog/wp-content/uploads/sites/5/2018/10/181009_181010_goes16_upper_level_winds_Michael_anim.gif)
GOES-16 Mid-level (6.9 µm) Water Vapor images with Mid/Upper-level winds, from 21 UTC on 09 October to 21 UTC on 10 October [click to enlarge]
Aqua MODIS Near-Infrared “Cirrus” (1.37 µm) and Water Vapor (6.7 µm) images
(below) showed that clouds and moisture were being transported by this outflow channel as far northward as the Ohio River Valley shortly after the time of landfall.
Aqua MODIS Near-Infrared “Cirrus” (1.37 µm) and Water Vapor (6.7 µm) images [click to enlarge]
A GOES-16 Red-Green-Blue (RGB) animation
(below; courtesy of Rick Kohrs, SSEC) showed the landfall of Michael.
![GOES-16 RGB images [click to play MP4 animation]](https://cimss.ssec.wisc.edu/satellite-blog/wp-content/uploads/sites/5/2018/10/181010_michael_rgb.jpeg)
GOES-16 RGB images [click to play MP4 animation]
A stereoscopic animation using GOES-16 and GOES-17 Visible imagery is provided below; to view the animation in 3-D, cross your eyes until 3 images appear — then focus on the image in the middle. Note that GOES-17 images shown here are preliminary and non-operational.
“Red” Visible (0.64 µm) images from GOES-16 (left) and GOES-17 (right) [click to play animation]
===== 11 October Update =====
![Aqua MODIS True Color RGB images from 06 October and 11 October [click to enlarge]](https://cimss.ssec.wisc.edu/satellite-blog/wp-content/uploads/sites/5/2018/10/181006_181011_aqua_modis_truecolor_FL_before_after_Michael_anim.gif)
Aqua MODIS True Color RGB images from 06 October and 11 October [click to enlarge]
A before/after comparison of Aqua MODIS True Color RGB images (
source) from 06 October and 11 October
(above) showed a dramatic increase in turbidity of the water off the “Emerald Coast” portion of the Florida Panhandle — this turbidity was the result of turbulent mixing of the relatively shallow continental shelf water by the strong winds of the hurricane. The close-up images above are centered off the coast near the landfall location; the large-scale images below show more of the Gulf Coast, from Texas to the Florida Peninsula.
![Aqua MODIS True Color RGB images from 06 October and 11 October [click to enlarge]](https://cimss.ssec.wisc.edu/satellite-blog/wp-content/uploads/sites/5/2018/10/181006_181011_aqua_modis_truecolor_GoM_before_after_Michael_anim.gif)
Aqua MODIS True Color RGB images from 06 October and 11 October [click to enlarge]
Hourly images of the
MIMIC Total Precipitable Water product during the 5-day period from 07-11 October
(below) showed the transport of tropical moisture from the Caribbean Sea across the Gulf of Mexico and over the southeastern US — heavy rainfall and flooding occurred from Florida and Alabama to the Mid-Atlantic states (
WPC summary).
![MIMIC Total Precipitable Water images, 07-11 October [click to play animation | MP4]](https://cimss.ssec.wisc.edu/satellite-blog/wp-content/uploads/sites/5/2018/10/comp20181010.120000_tpw.png)
MIMIC Total Precipitable Water images, 07-11 October [click to play animation | MP4]
The entire life cycle of Michael can be viewed in a compilation of GOES-16 Infrared 1-minute (or 30-second, when available) Mesoscale Sector images from 07-11 October, available
here — with a zoomed-in version of the images from 08-11 October available
here or on
YouTube (courtesy of Pete Pokandt, UW-AOS).
===== 18 October Update =====
![Terra MODIS True Color RGB images from 04 October and 18 October [click to enlarge]](https://cimss.ssec.wisc.edu/satellite-blog/wp-content/uploads/sites/5/2018/10/181004_181018_terra_modis_truecolor_FL_panhandle_before_after_Michael_anim.gif)
Terra MODIS True Color RGB images from 04 October and 18 October [click to enlarge]
A comparison of before/after Terra MODIS True Color RGB images from 04 October and 18 October
(above) revealed a broad swath of damaged/dead vegetation
(lighter shades of brown) along the path of strongest winds associated with the eyewall of Hurricane Michael.
Larger-scale versions of those same before/after Terra MODIS True Color RGB images from the SSEC MODIS Direct Broadcast site (below) showed that the path of damaged vegetation extended far northeastward across Georgia — Michael was still at Category 3 intensity when its center moved into the southwestern corner of the state.
![Terra MODIS True Color RGB images from 04 October and 18 October [click to enlarge]](https://cimss.ssec.wisc.edu/satellite-blog/wp-content/uploads/sites/5/2018/10/181004_181018_terra_modis_truecolor_Gulf_Coast_anim.gif)
Terra MODIS True Color RGB images from 04 October and 18 October [click to enlarge]
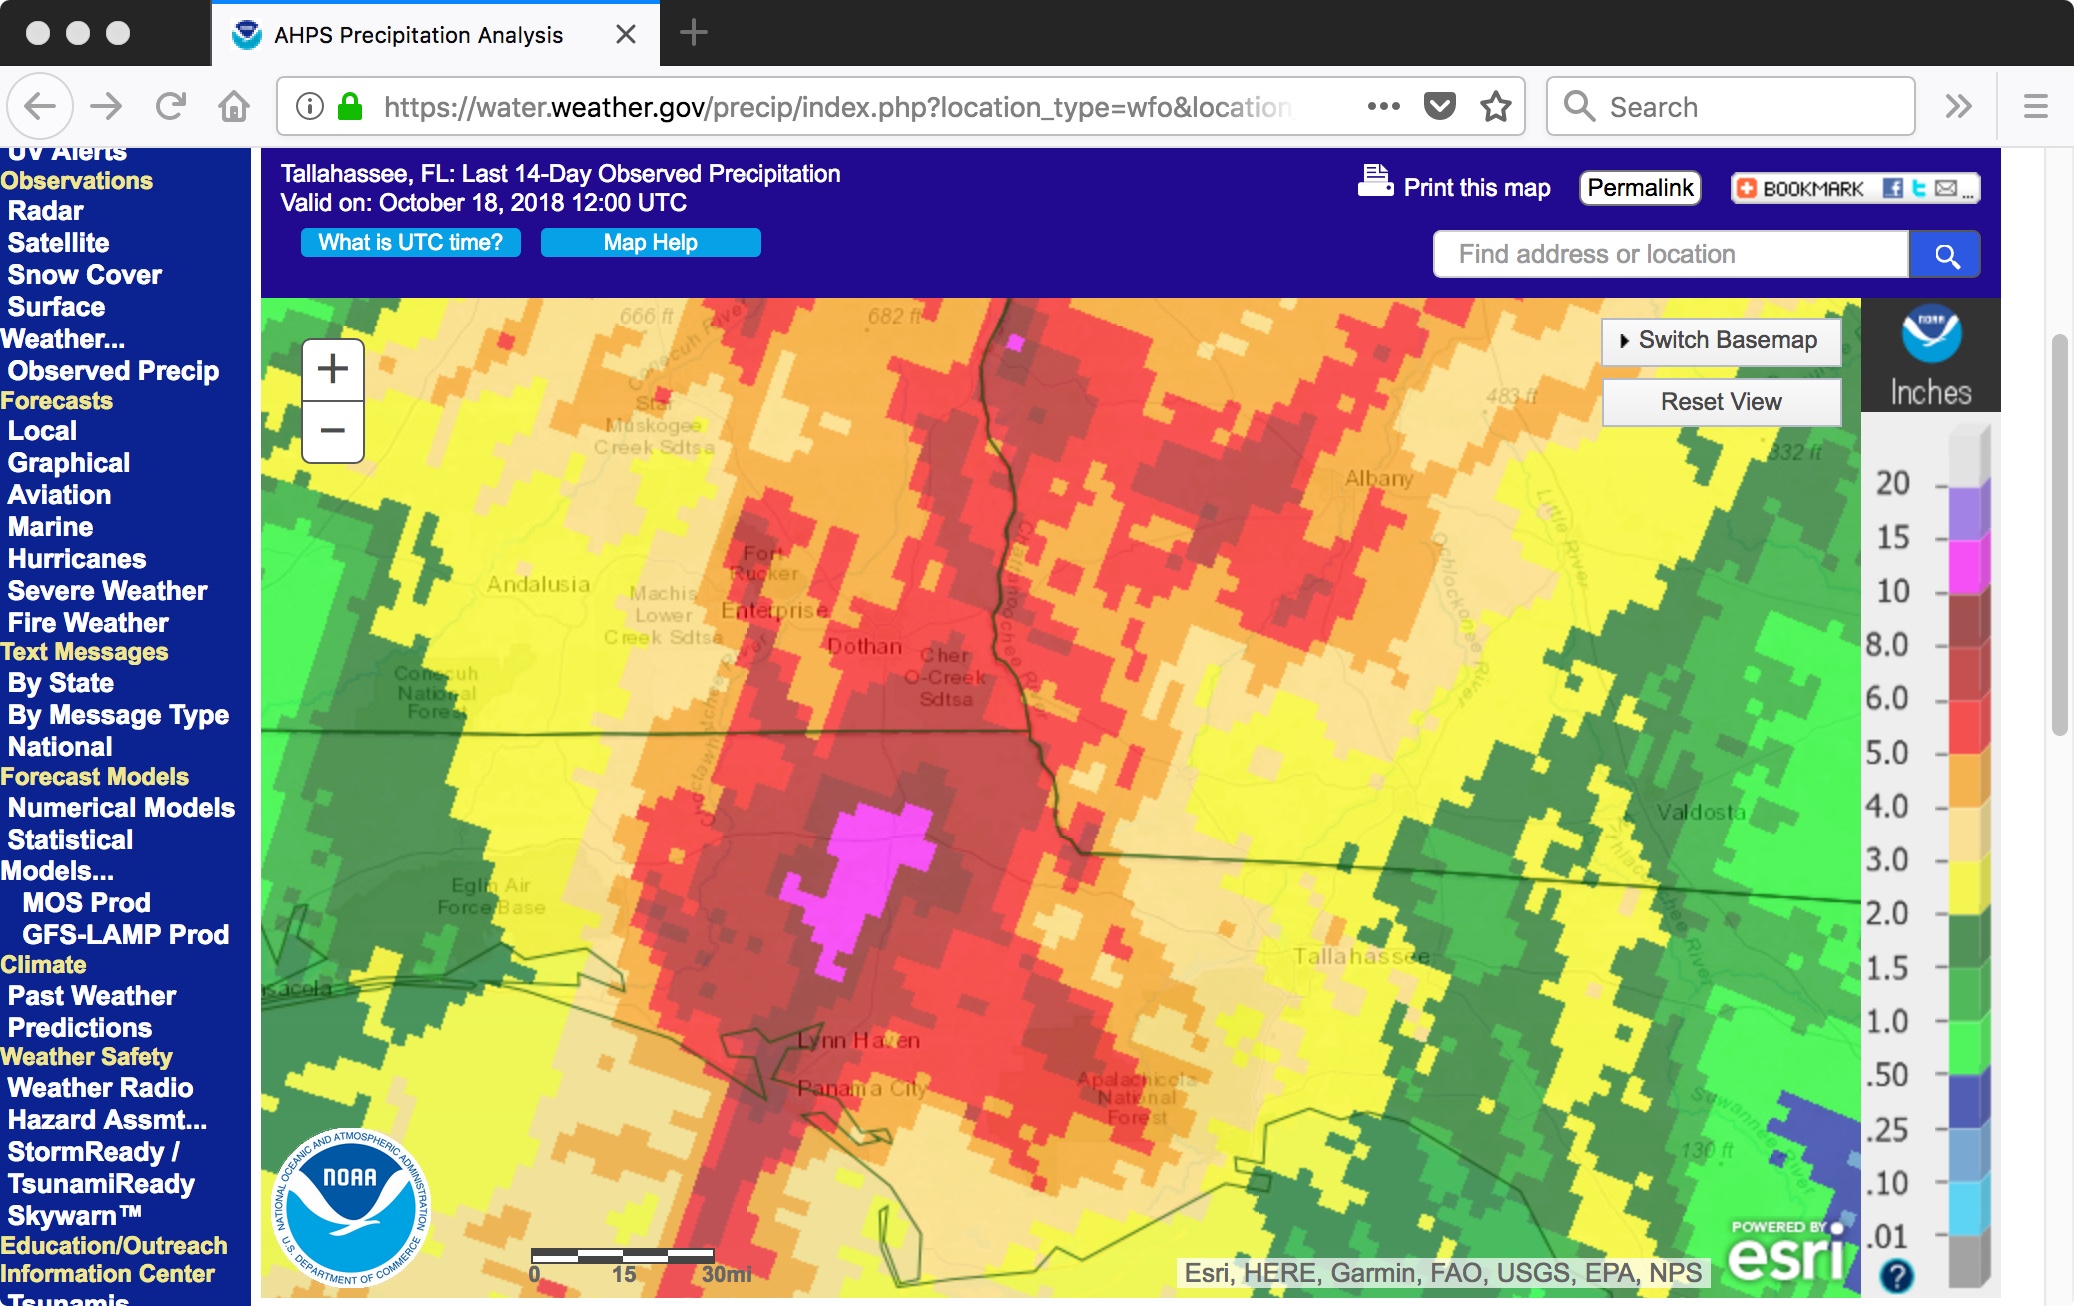
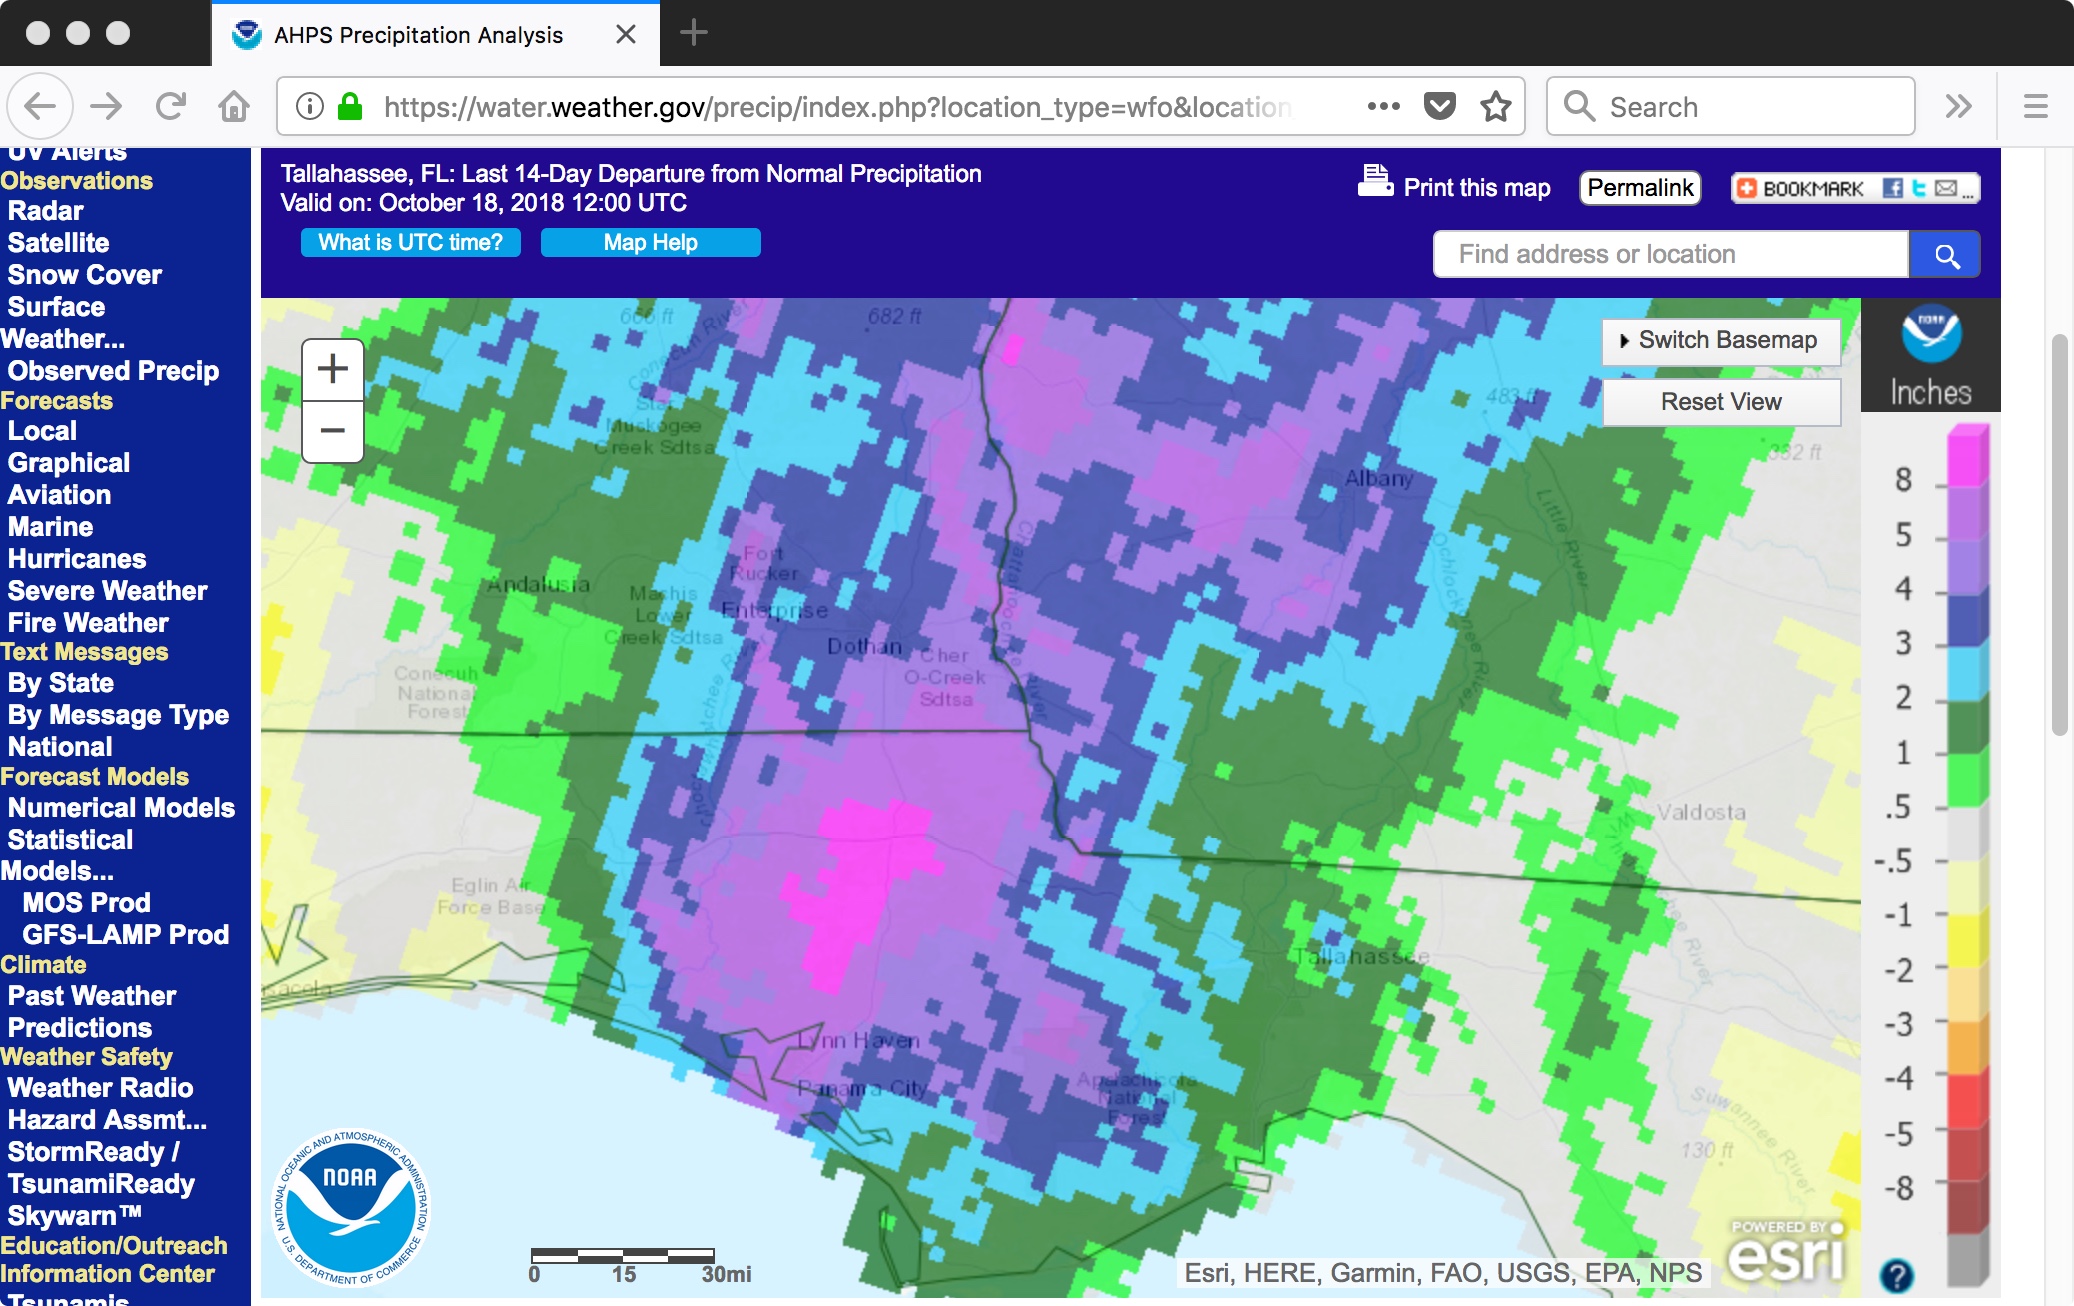
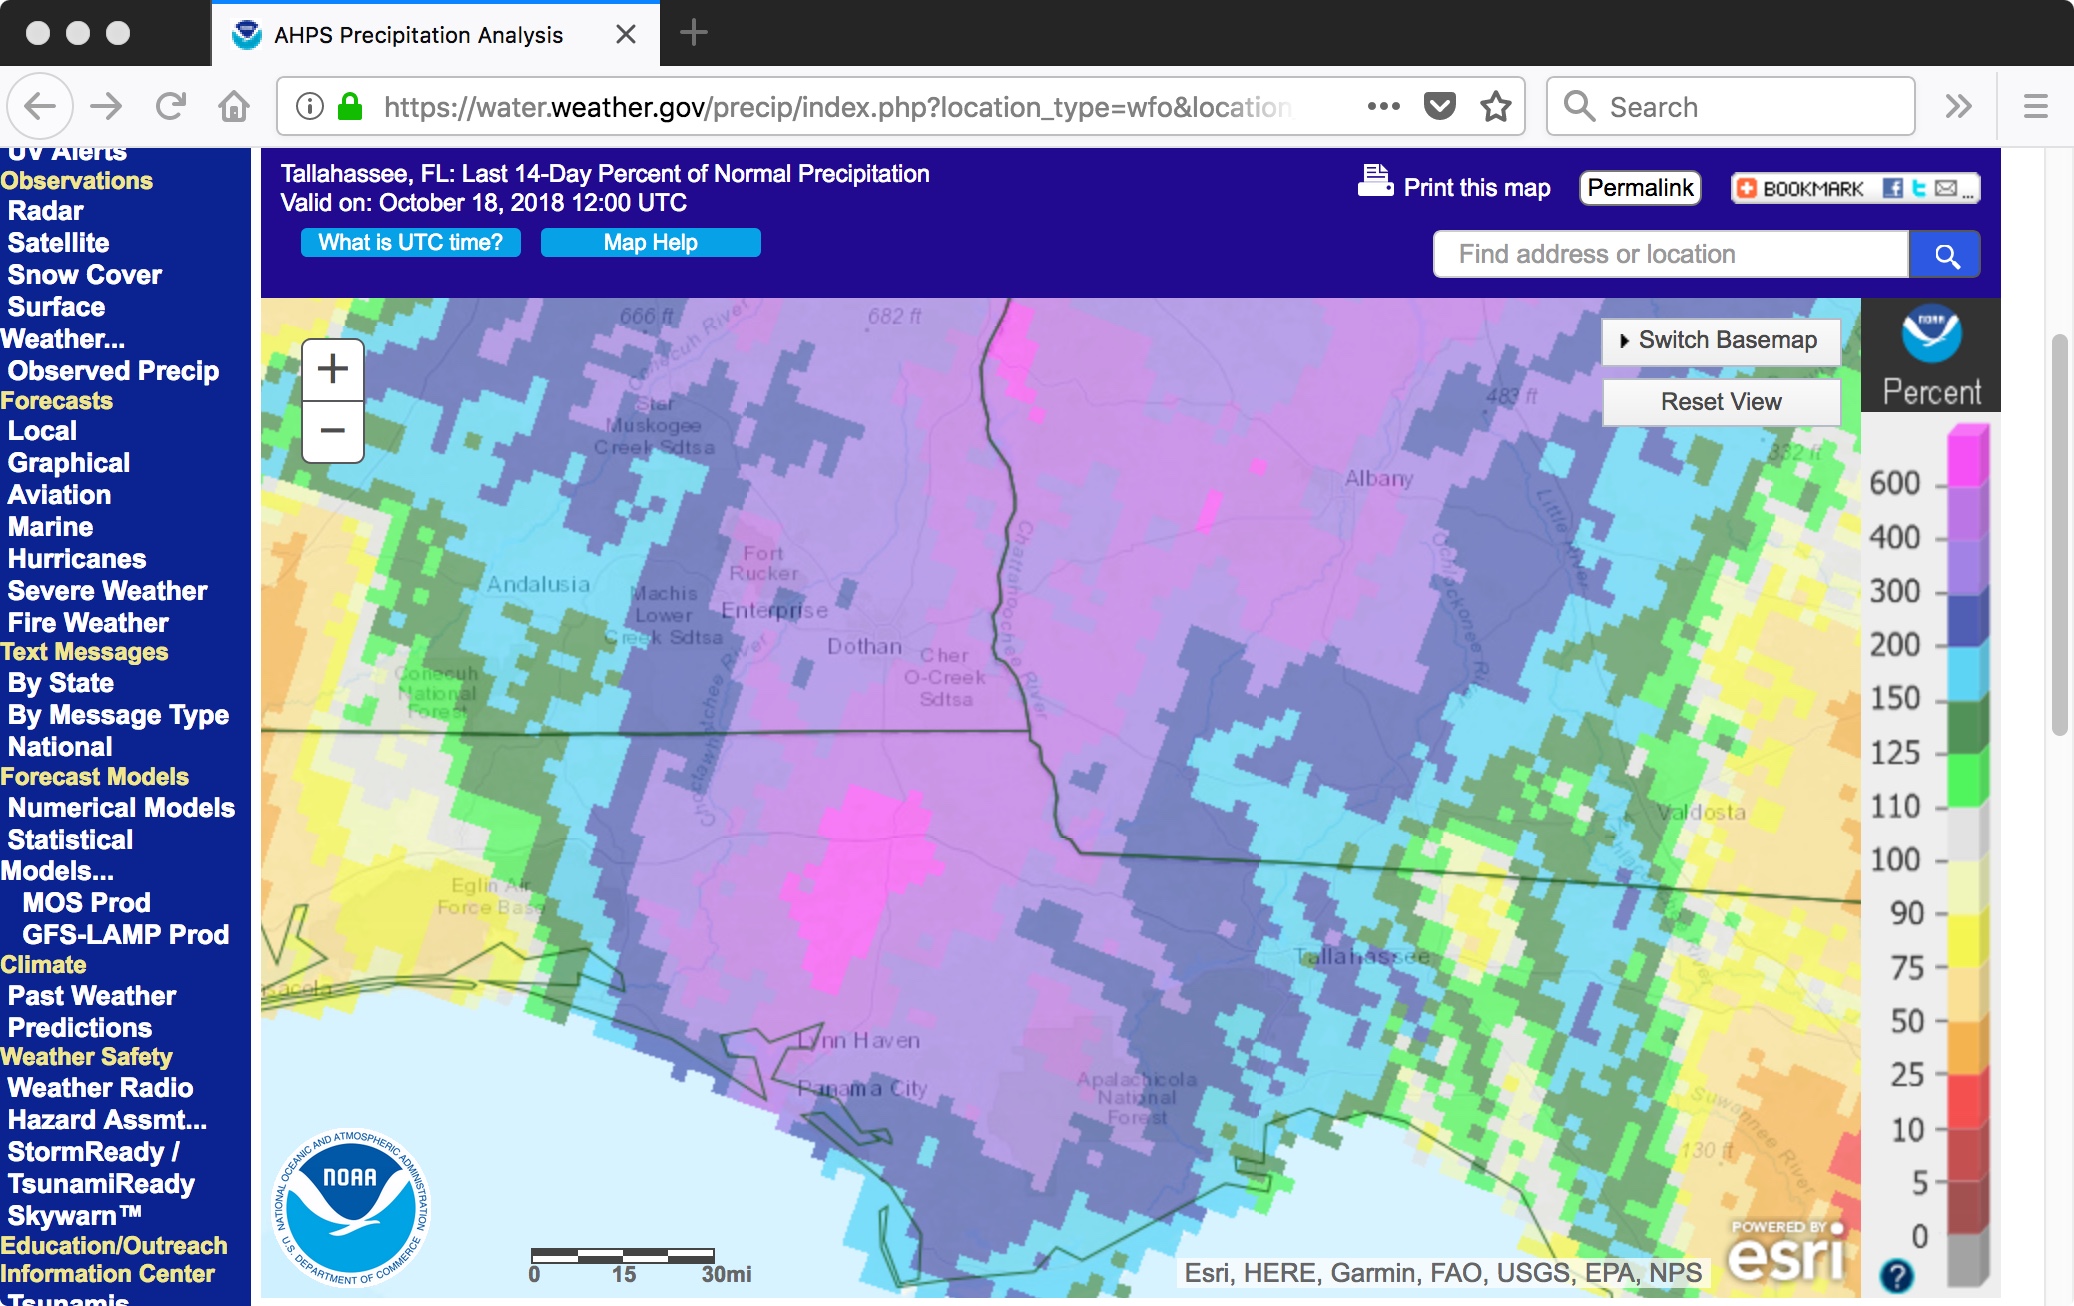
A before/after comparison of Terra MODIS False Color RGB images (using Bands 7-2-1) from 04 October and 12 October
(below) showed the area rivers that were in varying stages of flooding
(darker shades of blue) following the
heavy rainfall from Michael (the
total precipitation was
8 inches above normal or
600% of normal for the 14-day period of 04-18 October). Most obvious was the Chipola River, which was at
Moderate flood stage on 14 October.
![Terra MODIS False Color RGB images from 04 October and 12 October [click to enlarge]](https://cimss.ssec.wisc.edu/satellite-blog/wp-content/uploads/sites/5/2018/10/181004_181012_terra_modis_falsecolor_FL_panhandle_before_after_Michael_anim.gif)
Terra MODIS False Color RGB images from 04 October and 12 October [click to enlarge]
View only this post
Read Less
![Aqua MODIS True Color RGB image [click to enlarge]](https://cimss.ssec.wisc.edu/satellite-blog/wp-content/uploads/sites/5/2018/10/181013_1419utc_aqua_modis_truecolor_Leslie_anim.gif)
![EUMETSAT Meteosat-11 Water Vapor (6.25 µm) images, with hourly plots of surface winds and gusts in knots [click to play animation | MP4]](https://cimss.ssec.wisc.edu/satellite-blog/wp-content/uploads/sites/5/2018/10/181013_meteosat11_waterVapor_b5_Leslie_landfall_anim.gif)
![Meteosat-11 Water Vapor (7.35 µm) images, with hourly splots of surface winds and gusts in knots [click to play animation | MP4]](https://cimss.ssec.wisc.edu/satellite-blog/wp-content/uploads/sites/5/2018/10/181013_meteosat11_waterVapor_band6_sting_jet_anim.gif)
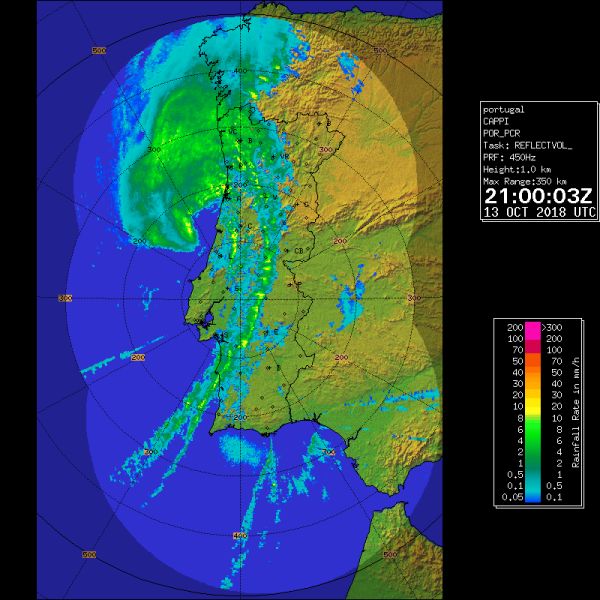
![Radar reflectivity composites [click to play animation]](https://cimss.ssec.wisc.edu/satellite-blog/wp-content/uploads/sites/5/2018/10/181013_Portugal_radar_Leslie_landfall_anim.gif)
![GOES-16 Mid-level Water Vapor (6.9 µm) images, with hourly plots of surface winds and gusts in knots [click to play animation | MP4]](https://cimss.ssec.wisc.edu/satellite-blog/wp-content/uploads/sites/5/2018/10/181013_goes16_waterVapor_Leslie_landfall_anim.gif)
![GOES-16 Mid-level Water Vapor (6.9 µm) images [click to play MP4 animation]](https://cimss.ssec.wisc.edu/satellite-blog/wp-content/uploads/sites/5/2018/10/G16_WV_LESLIE_LIFECYCLE_22SEP_13OCT2018_2018266_150034_GOES-16_0001PANEL.GIF)


![16-panel images of all GOES-16 ABI spectral bands [click to play animation | MP4]](https://cimss.ssec.wisc.edu/satellite-blog/wp-content/uploads/sites/5/2018/10/181010_1547utc_1642utc_goes16_abi_bands_Michael_eye_anim.gif)
![MIMIC Total Precipitable Water images, 07-11 October [click to play animation | MP4]](https://cimss.ssec.wisc.edu/satellite-blog/wp-content/uploads/sites/5/2018/10/181007_181011_mimic_tpw_Michael_anim.gif)
![Suomi NPP VIIRS Day/Night Band (0.7 µm) and Infrared Window (11.45 µm) images [click to enlarge]](https://cimss.ssec.wisc.edu/satellite-blog/wp-content/uploads/sites/5/2018/10/181009_0752utc_suomiNPP_viirs_DayNightBand_InfraredWindow_Hurricane_Michael_anim.gif)

![Ocean Heat Content and Sea Surface Temperature, with a plot of the track of Michael [click to enlarge]](https://cimss.ssec.wisc.edu/satellite-blog/wp-content/uploads/sites/5/2018/10/181009_ohc_sst_Michael_anim.gif)
