Thanks go out to Jason Alumbaugh from NWS Marquette, who sent the following in an email:“Previous shift here at NWS Marquette passed along interesting feature on satellite last night. Origin of the feature is approx. 49.23 N and 91.00 W (just west of CWDV – Upsala in Ontario) but eventually the... Read More
Thanks go out to Jason Alumbaugh from NWS Marquette, who sent the following in an email:
“Previous shift here at NWS Marquette passed along interesting feature on satellite last night. Origin of the feature is approx. 49.23 N and 91.00 W (just west of CWDV – Upsala in Ontario) but eventually the plume spread as far south as south central Upper Michigan and northeast Wisconsin (IMT to MNM). Our meteorologists said it looked like a fire and called Environment Canada overnight but they had not heard of anything reported.”
GOES-16 “Red” Visible (0.64 µm), Near-Infrared “Snow/Ice” (1.61 µm), Near-Infrared “Cloud Particle Size” (2.24 µm) and Shortwave Infrared (3.9 µm) images [click to play animation | MP4]
Taking a look at the initial daytime formation of the plume on
20 October 2018, a very subtle signature could be seen at times in GOES-16
(GOES-East) “Red” Visible (
0.64 µm) images, but the plume was more obvious in the Near-Infrared “Snow/Ice” (
1.61 µm), Near-Infrared “Cloud Particle Size” (
2.24 µm) and Shortwave Infrared (
3.9 µm) imagery
(above). Emissions from an industrial source (likely a power plant, or perhaps the
Domtar paper mill?) acted as cloud condensation nuclei, causing a higher concentration of
smaller supercooled cloud droplets downwind of the plume source — and this plume of smaller particles was more reflective and thus appeared brighter in the 1.61/2.24 µm images and warmer
(darker gray) in the 3.9 µm images.
Color-enhanced 3.9 µm Shortwave Infrared imagery (below) showed the transition from a warmer (darker red) plume during the day — due to enhanced reflection of incoming solar radiation — to a colder (darker blue) plume at night.
![GOES-16 Shortwave Infrared (3.9 µm) images [click to play animation | MP4]](https://cimss.ssec.wisc.edu/satellite-blog/wp-content/uploads/sites/5/2018/10/G16_SWIR_ONTARIO_PLUME_21OCT2018_2018293_210218_GOES-16_0001PANEL.GIF)
GOES-16 Shortwave Infrared (3.9 µm) images [click to play animation | MP4]
The higher spatial resolution of MODIS and VIIRS imagery from the polar-orbiting Terra/Aqua and NOAA-20/Suomi NPP satellites offered alternative views of the plume. A comparison of Suomi NPP VIIRS Visible (0.64 µm), Day/Night Band (0.7 µm), Near-Infrared “Snow/Ice” (1.61 µm), Shortwave Infrared (3.74 µm) and Infrared Window (11.45 µm) images
(below) showed the early stage of the plume during the day on 20 October — as was seen with GOES-16, the plume signature was most obvious in the 1.61 µm Snow/Ice and 3.74 µm Shortwave Infrared imagery.
Suomi NPP VIIRS Visible (0.64 µm), Day/Night Band (0.7 µm), Near-Infrared “Snow/Ice” (1.61 µm), Shortwave Infrared (3.74 µm) and Infrared Window (11.45 µm) images [click to enlarge]
A nighttime comparison of Suomi NPP VIIRS Day/Night Band (0.7 µm), Shortwave Infrared (3.74 µm), Infrared Window (11.45 µm) and Fog/stratus Brightness Temperature Difference (11.45-3.74 µm) images
(below) revealed signatures of the plume at 0716 UTC or 2:16 am CDT on 21 October, after it had traveled nearly 350 miles from the Ontario source to the Green Bay, Wisconsin area. Cloud-top 11.45 µm infrared brightness temperatures of the plume and the surrounding supercooled clouds were generally in the -13º to -16ºC range.
![Suomi NPP VIIRS Day/Night Band (0.7 µm), Shortwave Infrared (3.74 µm), Infrared Window (11.45 µm) and Fog.stratus BTD (11.45-3.74 µm) images [click to enlarge]](https://cimss.ssec.wisc.edu/satellite-blog/wp-content/uploads/sites/5/2018/10/181021_0716utc_suomiNPP_viirs_DayNightBand_shortwaveInfrared_infraredWindow_fogBTD_Ontario_plume_anim.gif)
Suomi NPP VIIRS Day/Night Band (0.7 µm), Shortwave Infrared (3.74 µm), Infrared Window (11.45 µm) and Fog/stratus BTD (11.45-3.74 µm) images [click to enlarge]
A sequence of nighttime Fog/stratus BTD images from Terra/Aqua MODIS and NOAA-20/Suomi NPP VIIRS
(below) showed the plume moving southeastward across the Upper Peninsula of Michigan into northeastern Wisconsin. BTD values associated with the plume were in the 3-5ºC range
(darker shades of red). [Note: the NOAA-20 VIIRS images are incorrectly labeled as Suomi NPP]
![Terra/Aqua MODIS and NOAA-20/Suomi NPP VIIRS Fog/stratus BTD images [click to enlarge]](https://cimss.ssec.wisc.edu/satellite-blog/wp-content/uploads/sites/5/2018/10/181021_modis_viirs_fogBTD_Ontario_plume_anim.gif)
Terra/Aqua MODIS and NOAA-20/Suomi NPP VIIRS Fog/stratus BTD images [click to enlarge]
View only this post
Read Less
![Suomi NPP VIIRS Day/Night Band (0.7 µm) and Infrared Window (11.45 µm) images [click to enlarge]](https://cimss.ssec.wisc.edu/satellite-blog/wp-content/uploads/sites/5/2018/10/181022_0852utc_suomiNPP_viirs_dayNightBand_infraredWindow_Willa_anim.gif)
![GOES-16 "Red" Visible (0.64 µm) and "Clean" Infrared Window (10.3 µm) images [click to play MP4 animation]](https://cimss.ssec.wisc.edu/satellite-blog/wp-content/uploads/sites/5/2018/10/G16_VIS_IR_WILLA_22OCT2018_2018295_161827_GOES-16_0002PANELS.GIF)
![GOES-16 "Red" Visible (0.64 µm) and "Clean" Infrared Window (10.3 µm) images [click to play MP4 animation]](https://cimss.ssec.wisc.edu/satellite-blog/wp-content/uploads/sites/5/2018/10/willa_stereo.jpeg)

![GOES-16 Shortwave Infrared (3.9 µm) images [click to play animation | MP4]](https://cimss.ssec.wisc.edu/satellite-blog/wp-content/uploads/sites/5/2018/10/181020_181021_goes16_shortwaveInfrared_Ontario_plume_anim.gif)
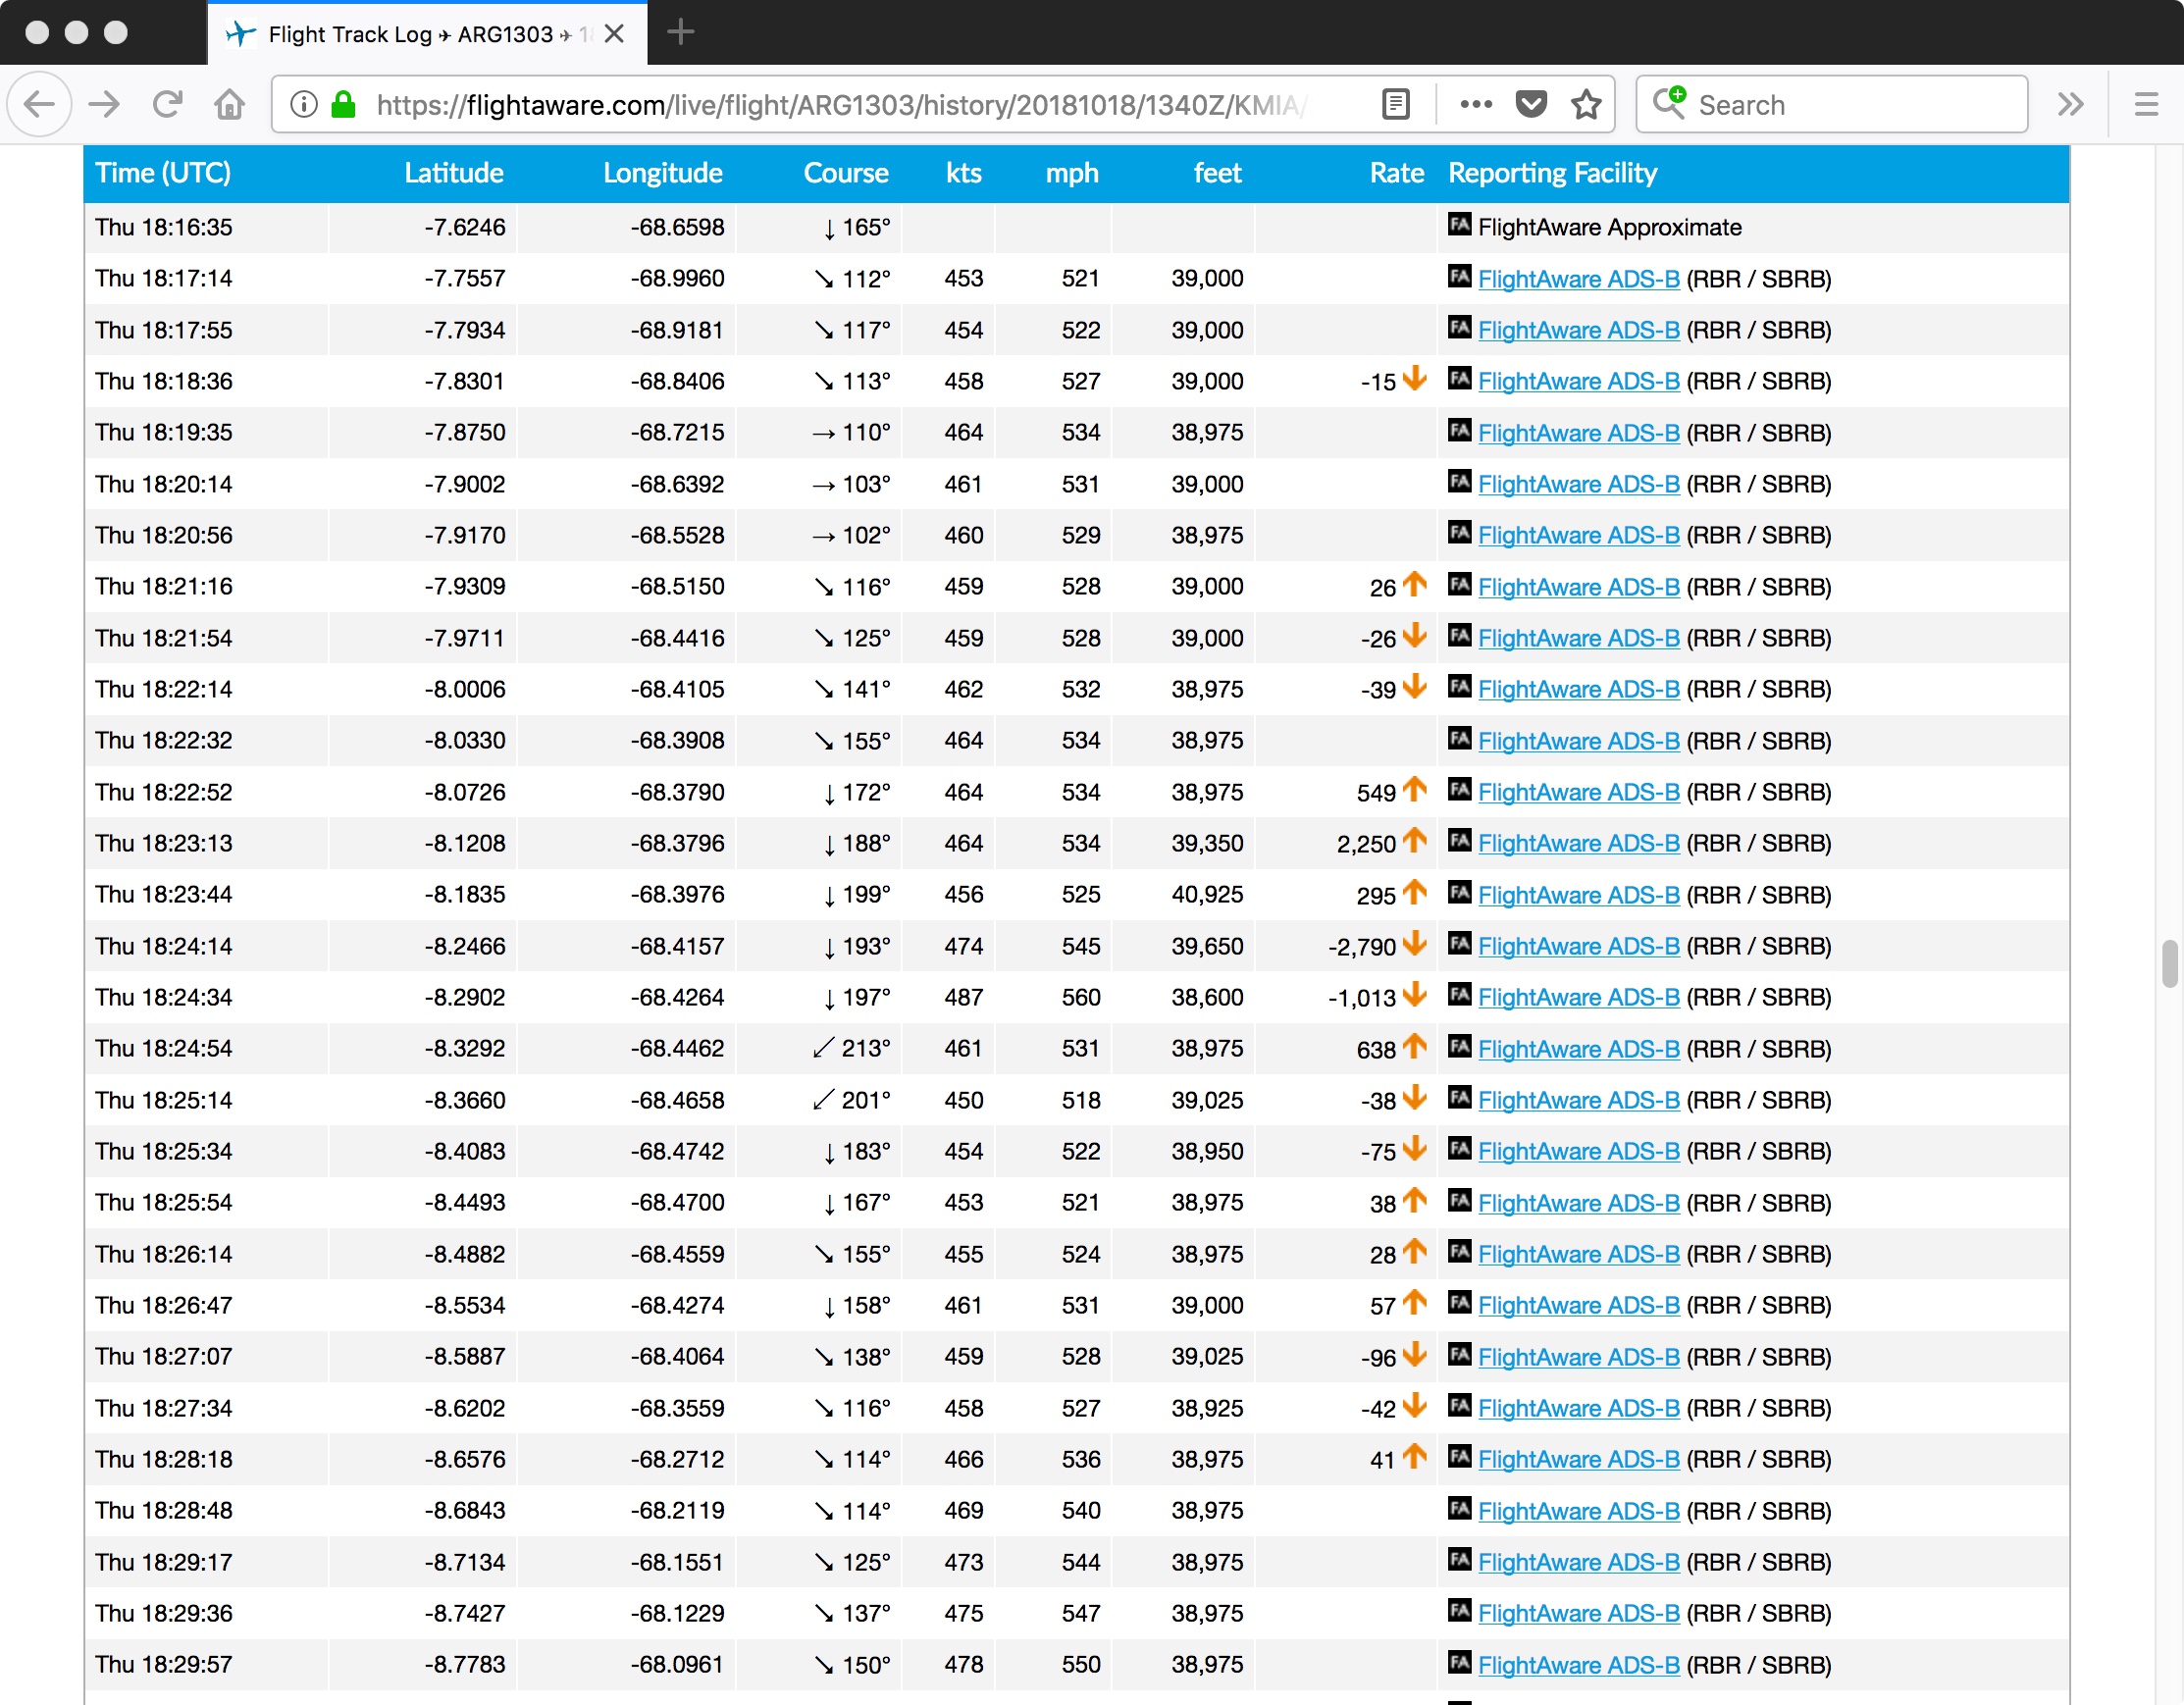
![ARG-1303 flight path (from FlightAware.com) [click to enlarge]](https://cimss.ssec.wisc.edu/satellite-blog/wp-content/uploads/sites/5/2018/10/181018_ARG1303_flight_path.jpeg)
![GOES-16 "Clean" Infrared Window (10.3 µm) images [click to play animation | MP4]](https://cimss.ssec.wisc.edu/satellite-blog/wp-content/uploads/sites/5/2018/10/181018_goes16_infrared_ARG1303_turbulence_anim.gif)
![Topography background with surface pressure analyses at 03, 06 and 09 UTC [click to enlarge]](https://cimss.ssec.wisc.edu/satellite-blog/wp-content/uploads/sites/5/2018/10/181018_topo_surface_pressure_anim.gif)
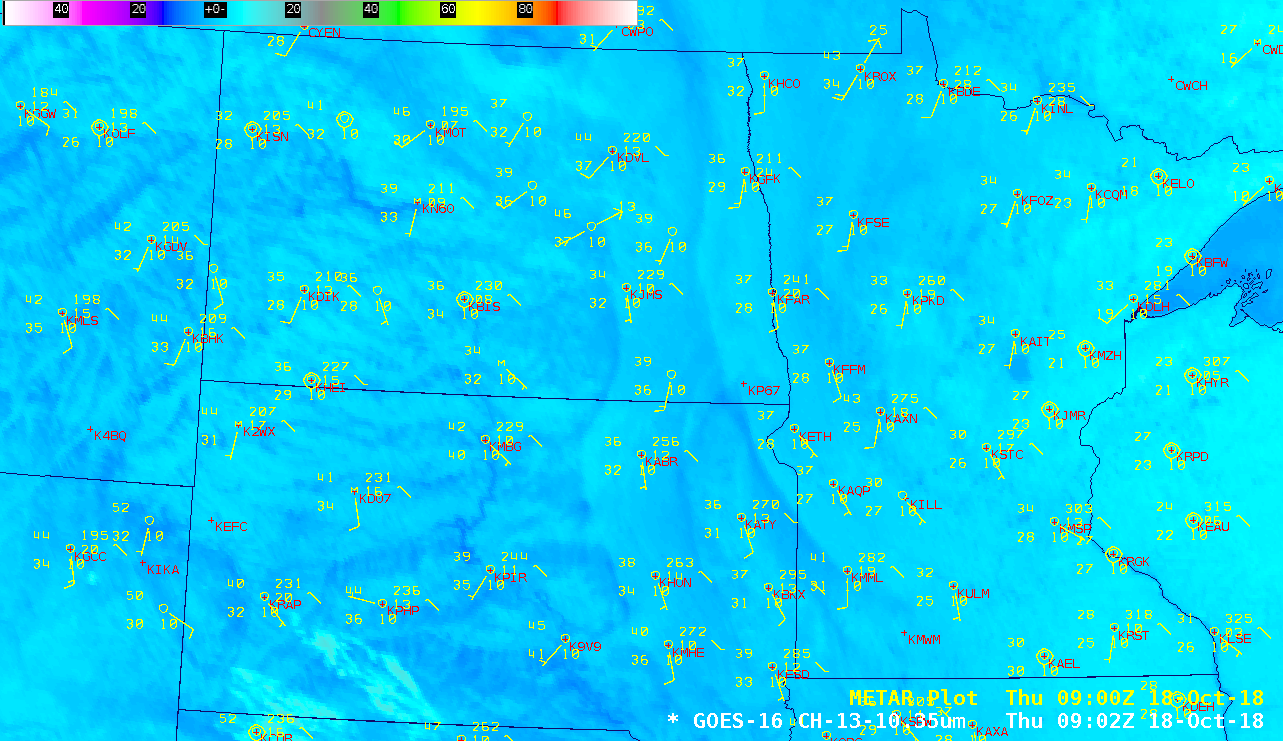
![GOES-16 Land Surface Temperature product + topography, with hourly plots of surface reports [click to play animation | MP4]](https://cimss.ssec.wisc.edu/satellite-blog/wp-content/uploads/sites/5/2018/10/181018_goes16_landSurfaceTemperature_Upper_Midwest_anim.gif)
![Infrared Window images from Terra/Aqua MODIS (11.0 µm) and NOAA-20/Suomi NPP VIIRS (11.45 µm), with topography and plots of surface reports [click to enlarge]](https://cimss.ssec.wisc.edu/satellite-blog/wp-content/uploads/sites/5/2018/10/181018_modis_viirs_infrared_topo_Upper_Midwest_anim.gif)
![Plot of 12 UTC rawinsonde data from Bismarck, North Dakota [click to enlarge]](https://cimss.ssec.wisc.edu/satellite-blog/wp-content/uploads/sites/5/2018/10/181018_12utc_kbis_raob.png)
![Plot of 12 UTC rawinsonde data from Aberdeen, South Dakota [click to enlarge]](https://cimss.ssec.wisc.edu/satellite-blog/wp-content/uploads/sites/5/2018/10/181018_12utc_kabr_raob.png)
