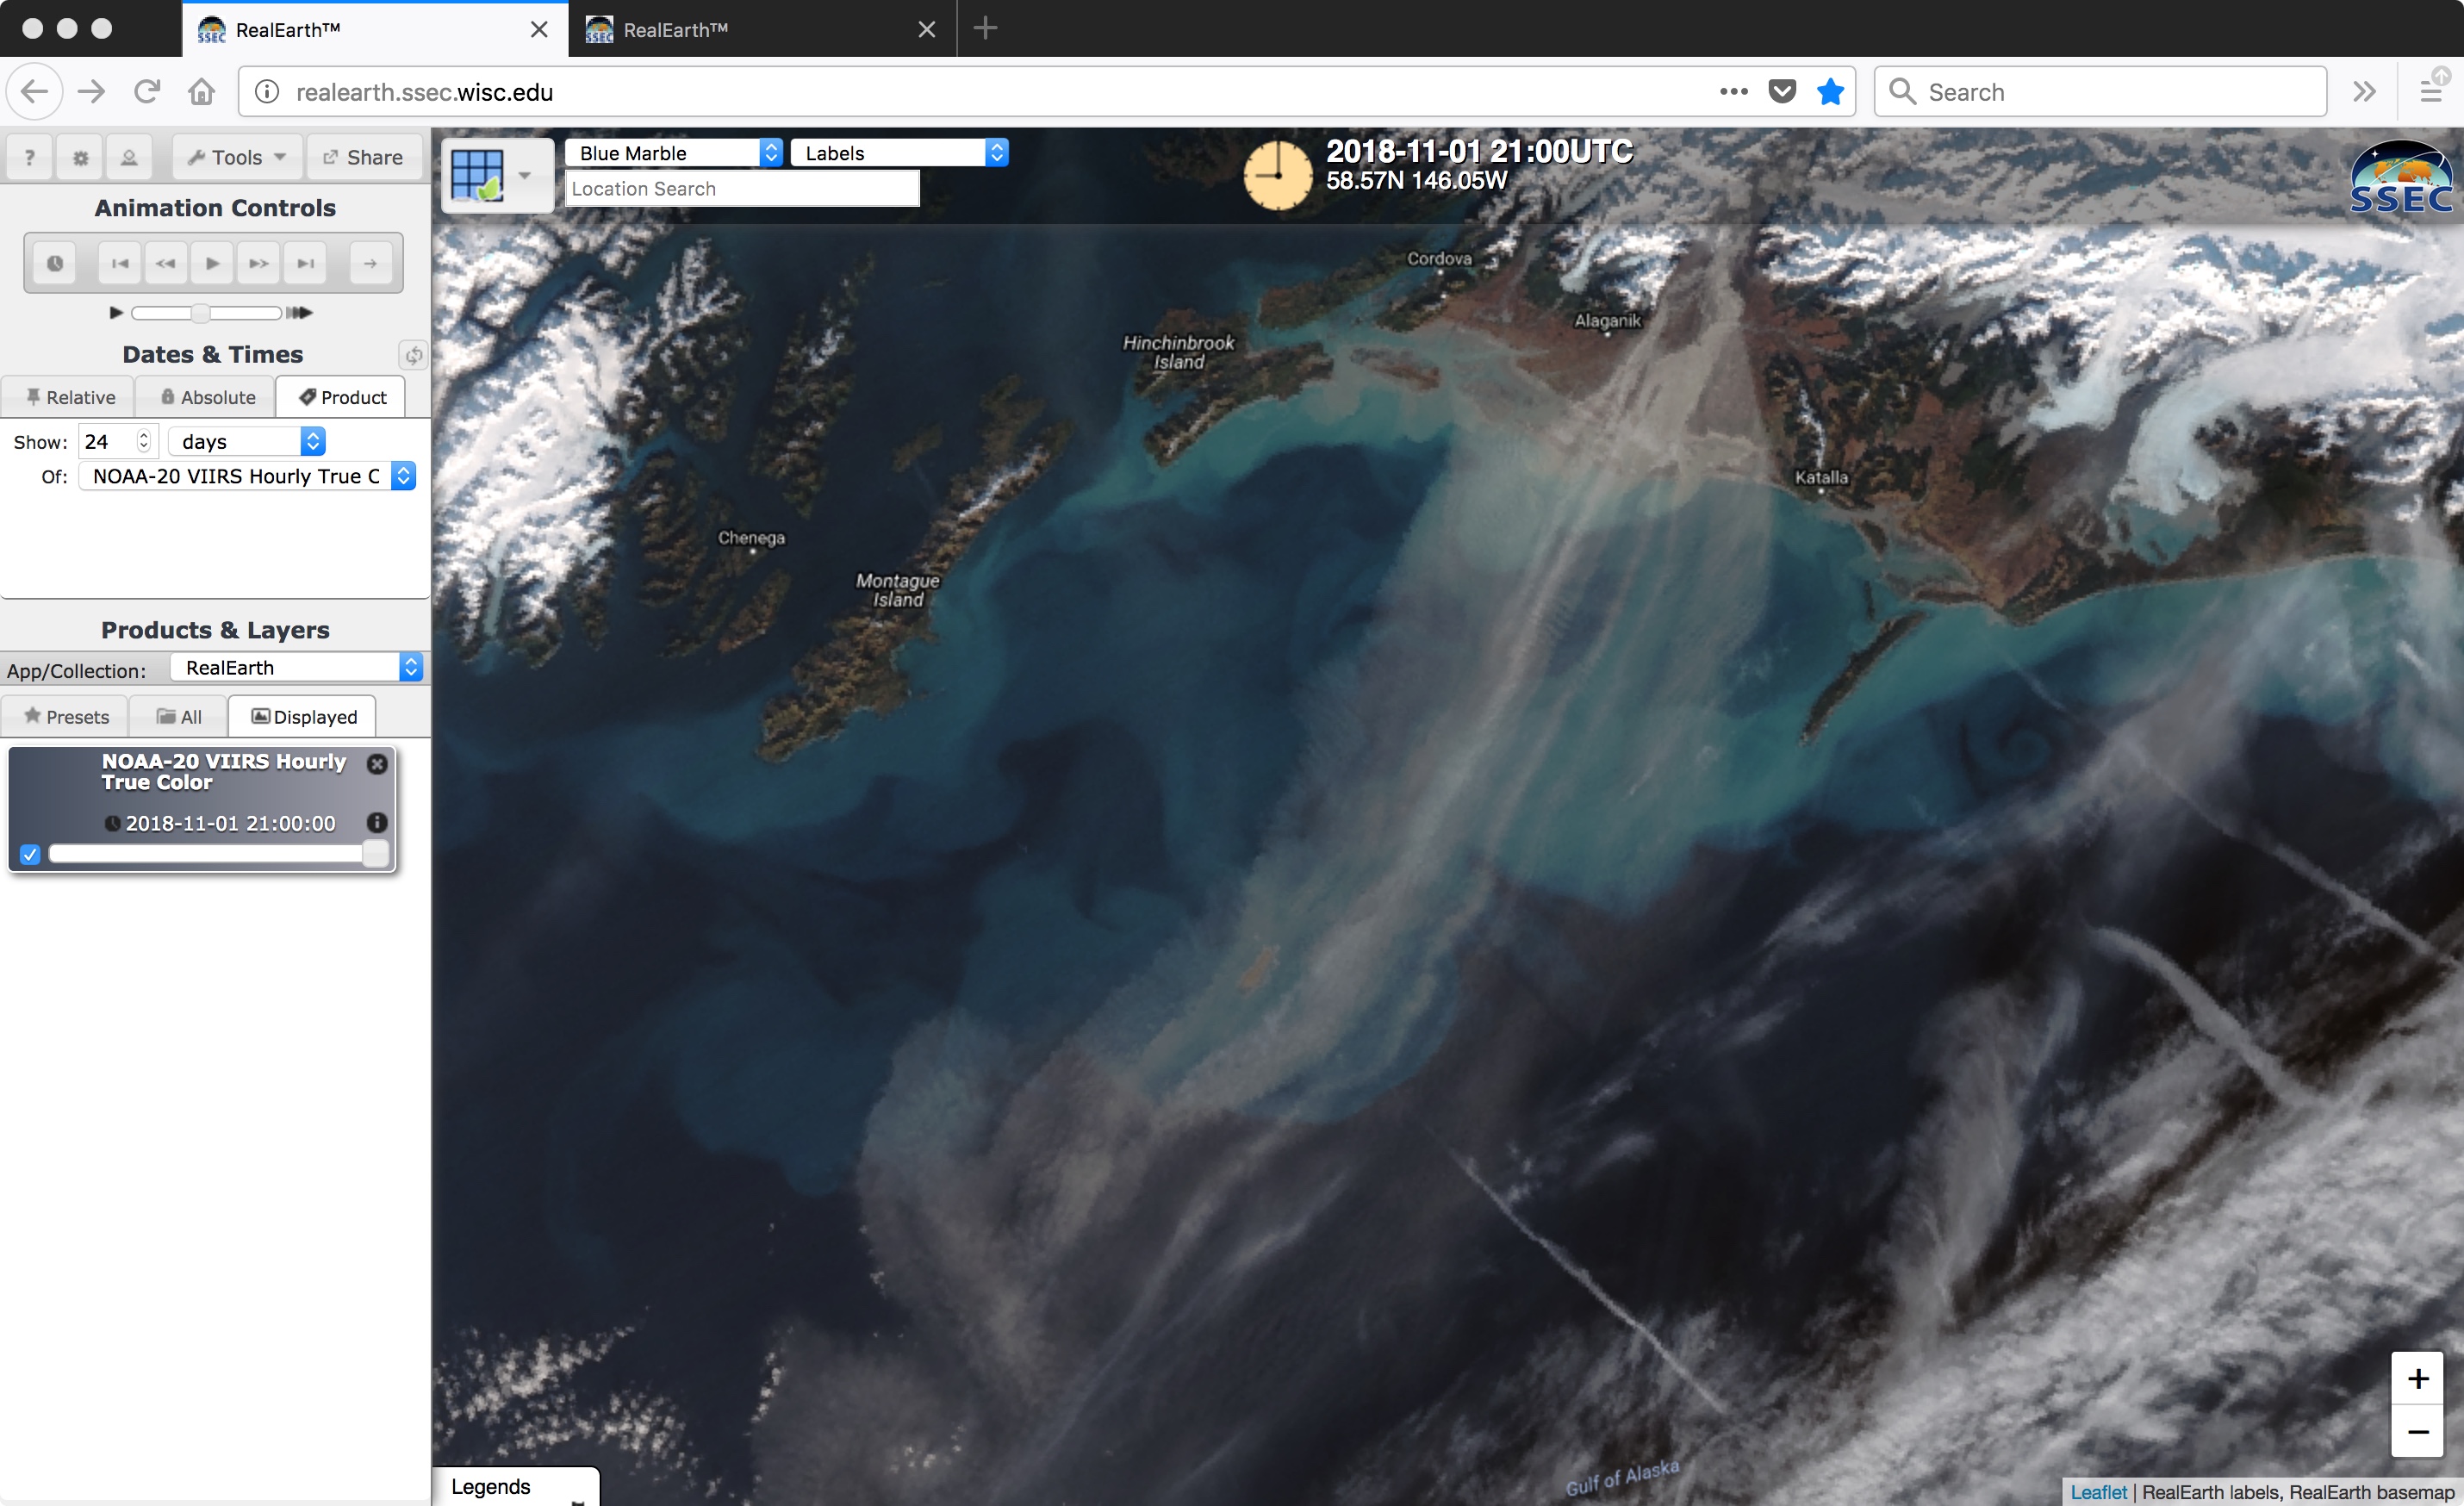
Strong gap winds accelerating out of the Copper River Valley along the southern coast of Alaska were lofting fine particles of glacial silt/sand and transporting those aerosols southwestward across the Gulf of Alaska on 31 October and 01 November 2018. A sequence of NOAA-20 VIIRS True Color Red-Green-Blue (RGB) images viewed... Read More
![NOAA-20 VIIRS True Color RGB images [click to enlarge]](https://cimss.ssec.wisc.edu/satellite-blog/wp-content/uploads/sites/5/2018/10/181031_181101_noaa20_viirs_truecolor_AK_dust_anim.gif)
NOAA-20 VIIRS True Color RGB images [click to enlarge]
Strong gap winds accelerating out of the
Copper River Valley along the southern coast of Alaska were lofting fine particles of glacial silt/sand and transporting those aerosols southwestward across the Gulf of Alaska on 31 October and 01 November 2018. A sequence of NOAA-20 VIIRS True Color Red-Green-Blue (RGB) images viewed using
RealEarth (above) showed that the plume was more widespread on 01 November.
A comparison of Suomi NPP VIIRS Visible (0.64 µm), Shortwave Infrared (3.74 µm) and Infrared Window (11.45 µm) images (below) showed the plume at 2022 UTC on 01 November. The map overlay has been removed from one set of images, to better reveal the dust plume source region. Note that the plume appeared much warmer (darker shades of red) in the Shortwave Infrared image — this is due to enhanced solar reflectance off the small dust particles. Since airborne dust is generally transparent at longer infrared wavelengths, only the thickest portion of the plume exhibited a subtle signature on the 11.45 µm image.
![Suomi NPP VIIRS Visible (0.64 µm), Shortwave Infrared (3.74 µm) and Infrared Window (11.45 µm) images [click to enlarge]](https://cimss.ssec.wisc.edu/satellite-blog/wp-content/uploads/sites/5/2018/10/181101_2022utc_suomi_npp_viirs_visible_shortwaveInfrared_infraredWindow_AK_dust_anim.gif)
Suomi NPP VIIRS Visible (0.64 µm), Shortwave Infrared (3.74 µm) and Infrared Window (11.45 µm) images [click to enlarge]
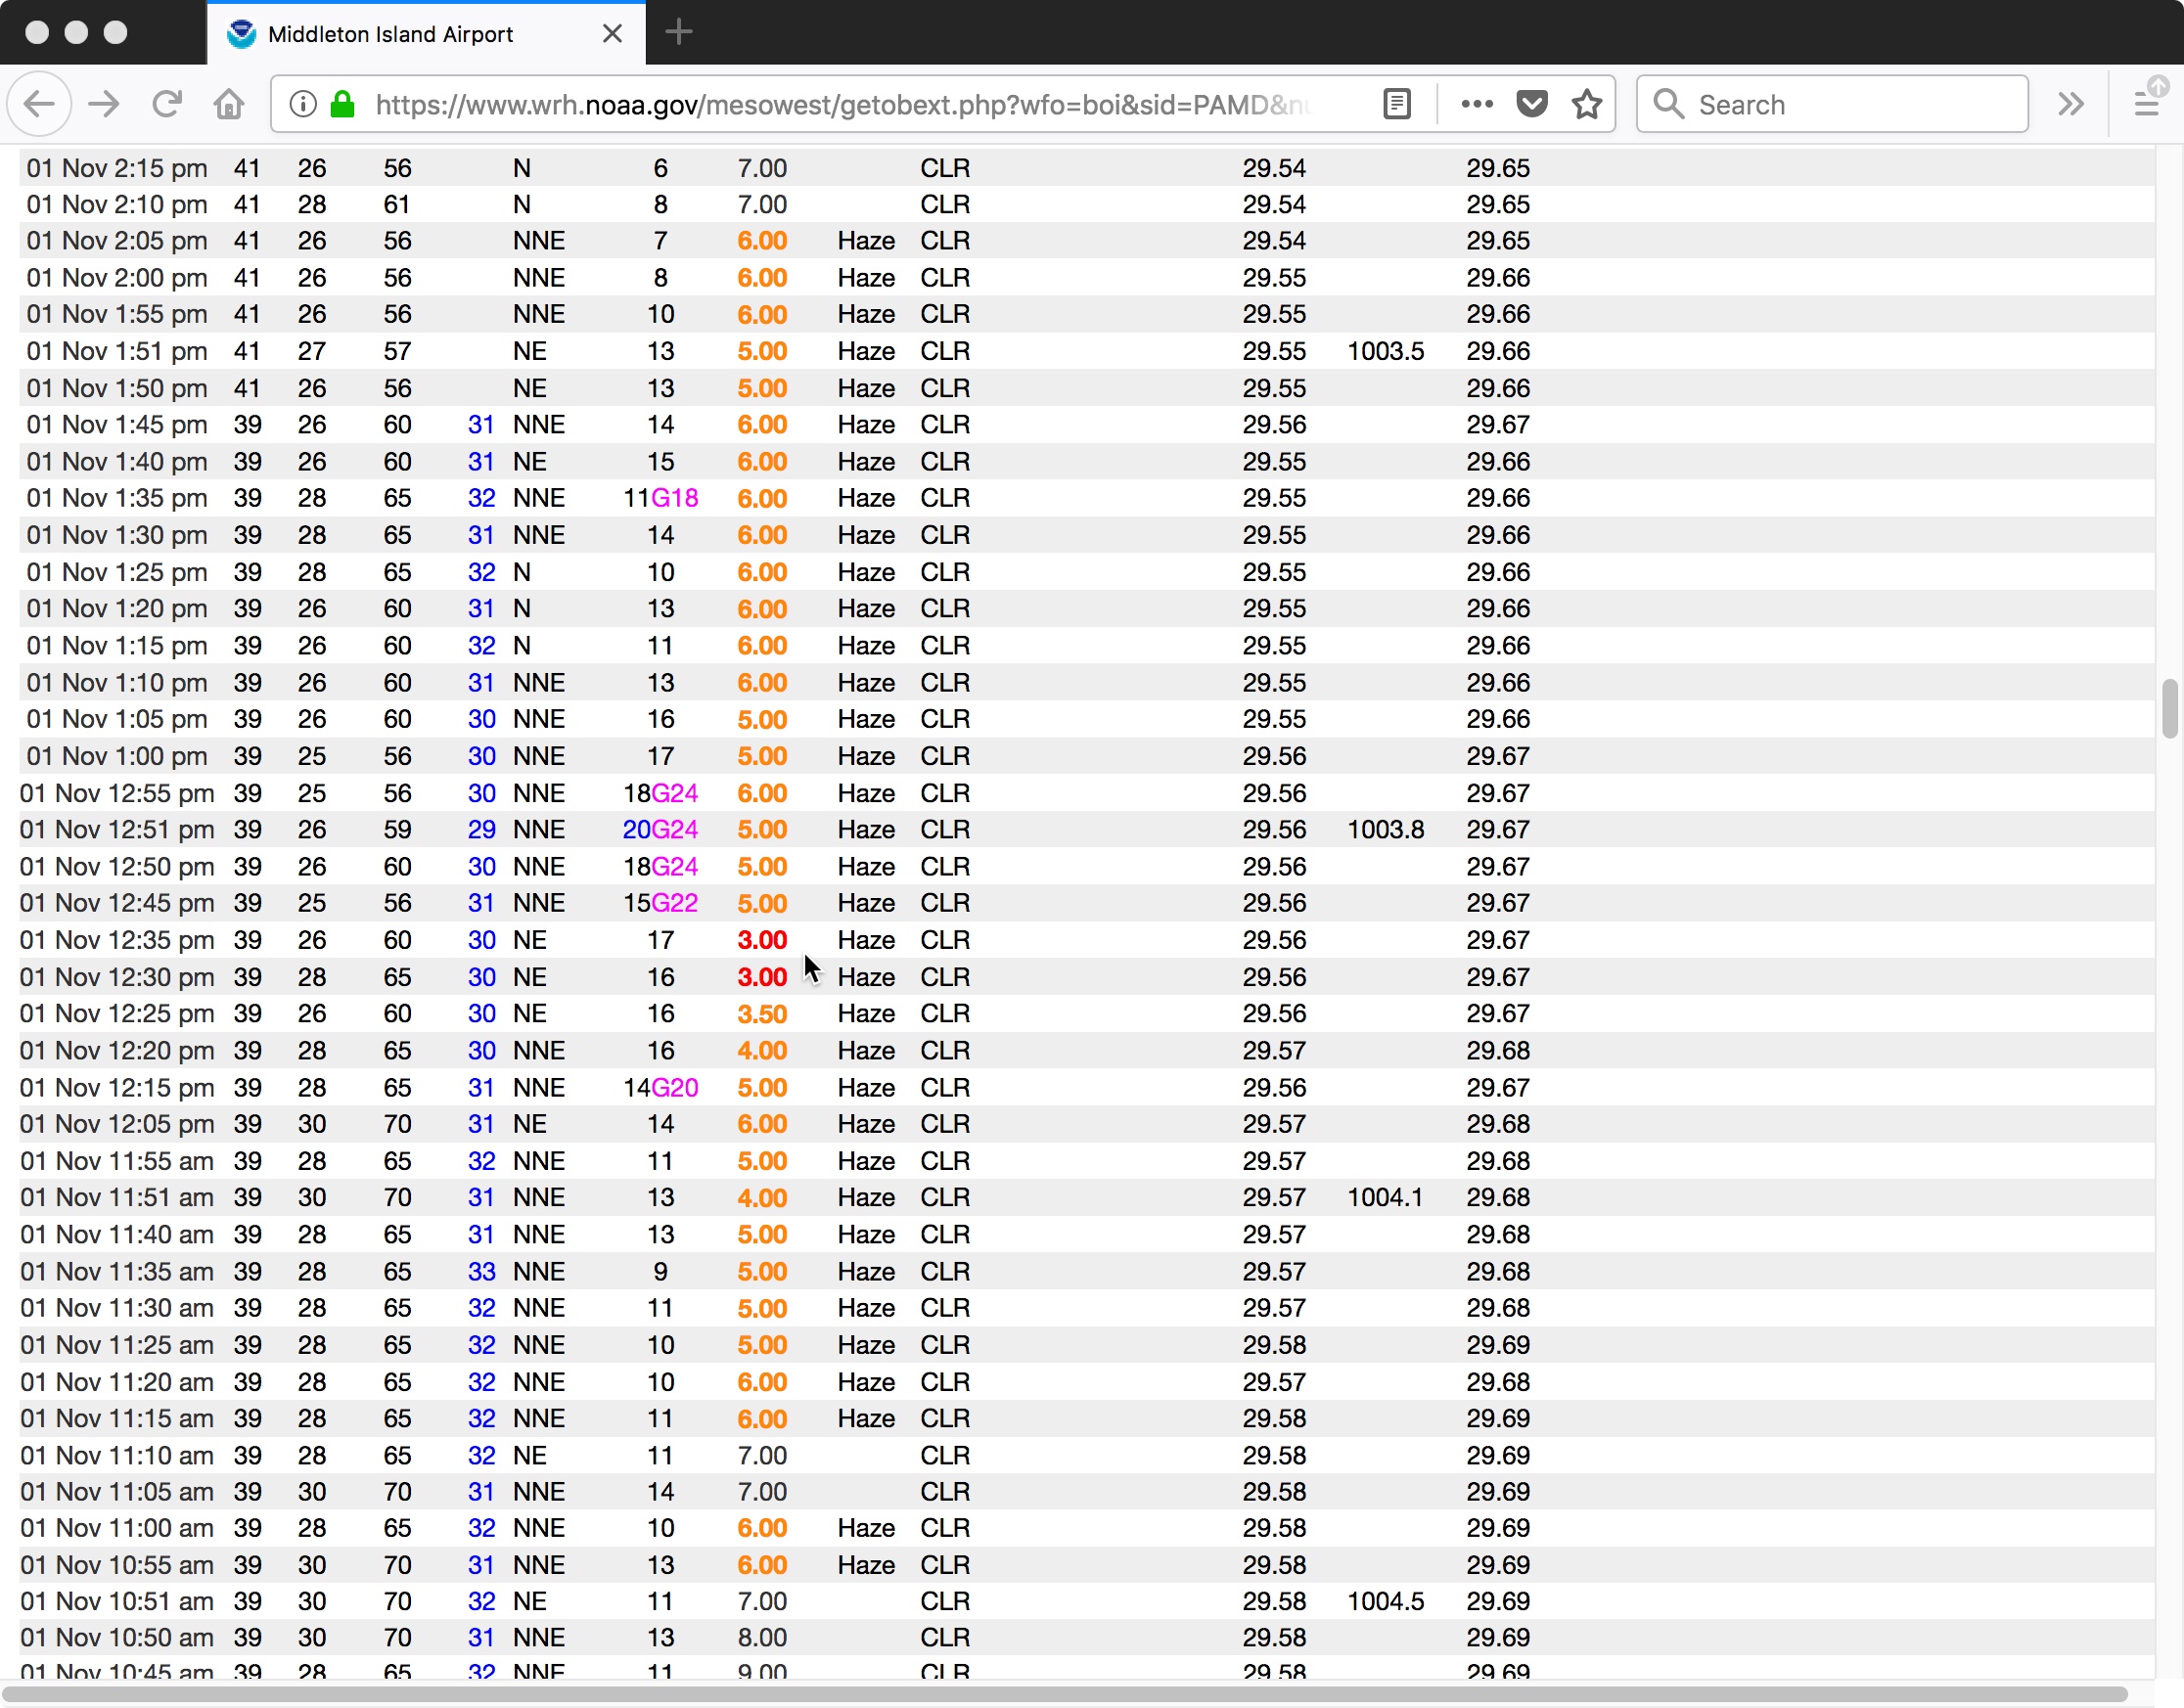
The surface visibility briefly dropped to
3 miles at Middleton Island (PAMD) around the time of the Suomi NPP VIIRS images. as gusty north-northeasterly winds carried the plume over that location
(below). Although Cordova (station identifier
PACV) is only about 20 miles northwest of the Copper River Delta, the localized gap winds did not affect that site (where wind speeds were 3 knots or less the entire day).
![Time series plot of surface observations at Middleton Island [click to enlarge]](https://cimss.ssec.wisc.edu/satellite-blog/wp-content/uploads/sites/5/2018/10/181101_PAMD_SFCMG.GIF)
Time series of surface observations at Middleton Island [click to enlarge]
ASCAT surface scatterometer winds (
source) from Metop-A and Metop-B
(below) showed speeds in the 25-30 knot range where the gap winds were exiting the Copper River Delta.
![Metop-A and Metop-B ASCAT surface scatterometer winds [click to enlarge]](https://cimss.ssec.wisc.edu/satellite-blog/wp-content/uploads/sites/5/2018/11/181101_meteop_ascat_AK_dust_anim.gif)
Metop-A and Metop-B ASCAT surface scatterometer winds [click to enlarge]
A toggle between Suomi NPP VIIRS Visible (0.64 µm) and Infrared Brightness Temperature Difference (11-12 µm) images (
source) at 2204 UTC on 01 November
(below) showed a subtle BTD signal within the more dense center portion of the plume, due to the silicate composition of some of the airborne particulate matter.
![Suomi NPP VIIRS Visible (0.64 µm) and Infrared Brightness Temperature Difference (11-12 µm) images [click to enlarge]](https://cimss.ssec.wisc.edu/satellite-blog/wp-content/uploads/sites/5/2018/10/181101_2204utc_suomi_npp_viirs_visible_infraredBTD_AK_dust_anim.gif)
Suomi NPP VIIRS Visible (0.64 µm) and Infrared Brightness Temperature Difference (11-12 µm) images [click to enlarge]
VIIRS Aerosol Optical Thickness (
AOT) products from the
eIDEA site
(below) revealed larger AOT values on 01 November.
![VIIRS Aerosol Optical Thickness product [click to enlarge]](https://cimss.ssec.wisc.edu/satellite-blog/wp-content/uploads/sites/5/2018/10/181031_181101_viirs_aerosolOpticalThickness_AK_anim.gif)
VIIRS Aerosol Optical Thickness product [click to enlarge]
The gap winds were caused by a strong gradient between cold high pressure over Interior Alaska/Yukon and an occluding gale force low pressure system in the Gulf of Alaska (surface analyses:
WPC)|
OPC). GOES-15
(GOES-West) Visible (0.63 µm) images
(below) showed the circulation of the low, and surface observations highlighted the cold air over snow-covered inland areas. While the dust plume was faintly apparent, it did not show up as well with the lower spatial resolution and large viewing angle of GOES-15.
![GOES-15 Visible (0.63 µm) images [click to play animation]](https://cimss.ssec.wisc.edu/satellite-blog/wp-content/uploads/sites/5/2018/10/G15_VIS_AK_01NOV2018_2018305_223000_GOES-15_0001PANEL.GIF)
GOES-15 Visible (0.63 µm) images [click to play animation]
A similar — though more prolonged and intense — event was noted in
October 2016.
View only this post
Read Less
![GOES-16 "Red" Visible (0.64 µm), Near-Infrared "Snow/Ice" (1.61 µm) and "Clean" Infrared Window (10.3 µm) images [click to enlarge]](https://cimss.ssec.wisc.edu/satellite-blog/wp-content/uploads/sites/5/2018/11/181103_1430utc_goes16_visible_nearInfrared_infraredWindow_SACO_AACP_anim.gif)
![GOES-16 "Red" Visible (0.64 µm), Near-Infrared "Snow/Ice" (1.61 µm) images [click to play animation | MP4]](https://cimss.ssec.wisc.edu/satellite-blog/wp-content/uploads/sites/5/2018/11/181103_goes16_visible_snowIce_Argentina_AACP_anim.gif)
![GOES-16 "Red" Visible (0.64 µm) and "Clean" Infrared Window (10.3 µm) images [click to play animation | MP4]](https://cimss.ssec.wisc.edu/satellite-blog/wp-content/uploads/sites/5/2018/11/181103_goes16_visible_infrared_Argentina_AACP_anim.gif)
![True Color RGB images from Terra MODIS (1457 UTC), Aqua MODIS (1736 UTC), Suomi NPP VIIRS (1742 UTC) and NOAA-20 VIIRS (1832 UTC) [click to enlarge]](https://cimss.ssec.wisc.edu/satellite-blog/wp-content/uploads/sites/5/2018/11/181103_modis_viirs_truecolor_SACO_anim.gif)
![GOES-15 Visible (0.63 µm) images [click to play animation]](https://cimss.ssec.wisc.edu/satellite-blog/wp-content/uploads/sites/5/2018/10/181101_goes15_visible_AK_anim.gif)
![Sequence of GOES-16 Low-level (7.3 µm), Mid-level (6.9 µm) and Upper-level (6.2 µm) Water Vapor images [click to play MP4 animation]](https://cimss.ssec.wisc.edu/satellite-blog/wp-content/uploads/sites/5/2018/10/G16_WV9_ATLANIC_31OCT2018_2018304_190036_GOES-16_0001PANEL.GIF)
![Sequence of GOES-16 Low-level (7.3 µm), Mid-level (6.9 µm) and Upper-level (6.2 µm) Water Vapor images [click to play MP4 animation]](https://cimss.ssec.wisc.edu/satellite-blog/wp-content/uploads/sites/5/2018/10/oscar_wv9_2-20181031_190036.png)
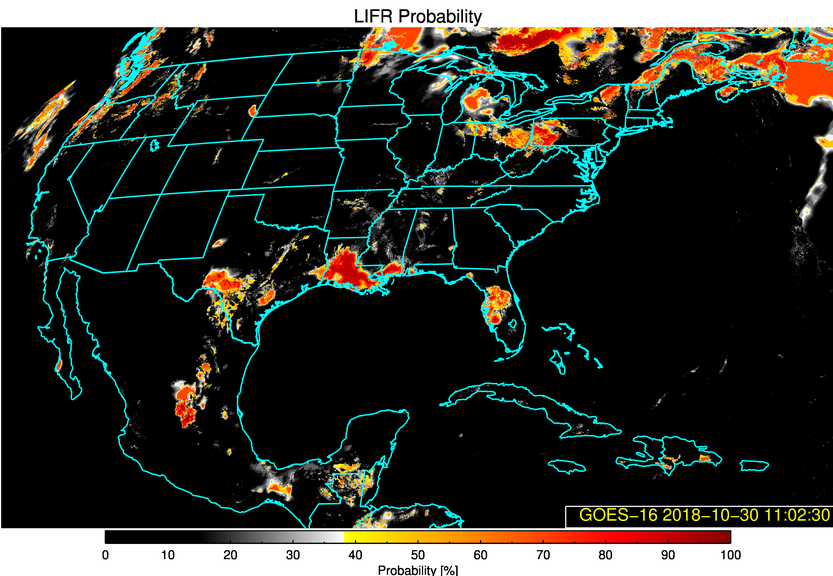
![GOES-16 Low Instrument Flight Rules (IFR) Probability [click to play animation | MP4]](https://cimss.ssec.wisc.edu/satellite-blog/wp-content/uploads/sites/5/2018/10/181030_goes16_lowIFR_probability_anim.gif)
![GOES-16 Fog/Low Stratus Depth product [click to play animation | MP4]](https://cimss.ssec.wisc.edu/satellite-blog/wp-content/uploads/sites/5/2018/10/181030_goes16_fogLowStratusDepth_anim.gif)
![Aqua MODIS Shortwave Infrared (3.7 µm) image [click to enlarge]](https://cimss.ssec.wisc.edu/satellite-blog/wp-content/uploads/sites/5/2018/10/MODIS_4_MICRON_20181029_1906.png)
![GOES-16 Shortwave Infrared (3.9 µm) images [click to play animation | MP4]](https://cimss.ssec.wisc.edu/satellite-blog/wp-content/uploads/sites/5/2018/10/181029_goes16_shortwaveInfrared_LA_v2_anim.gif)
