Now that skies have cleared up across South Texas, an interesting feature can now be seen on #GOES16 satellite. A flood wave from the heavy rainfall over the past few weeks can be seen flowing down the Nueces River. Check it! #txwx #stxwx pic.twitter.com/74n9penwKn
— NWS Corpus Christi (@NWSCorpus) October 27, 2018
As pointed out by NWS Corpus Christi (above), GOES-16 (GOES-East) Near-Infrared “Vegetation” (0.86 µm) images revealed an interesting flood wave moving along the Nueces River on 27 October 2018 (following a recent period of heavy rainfall).
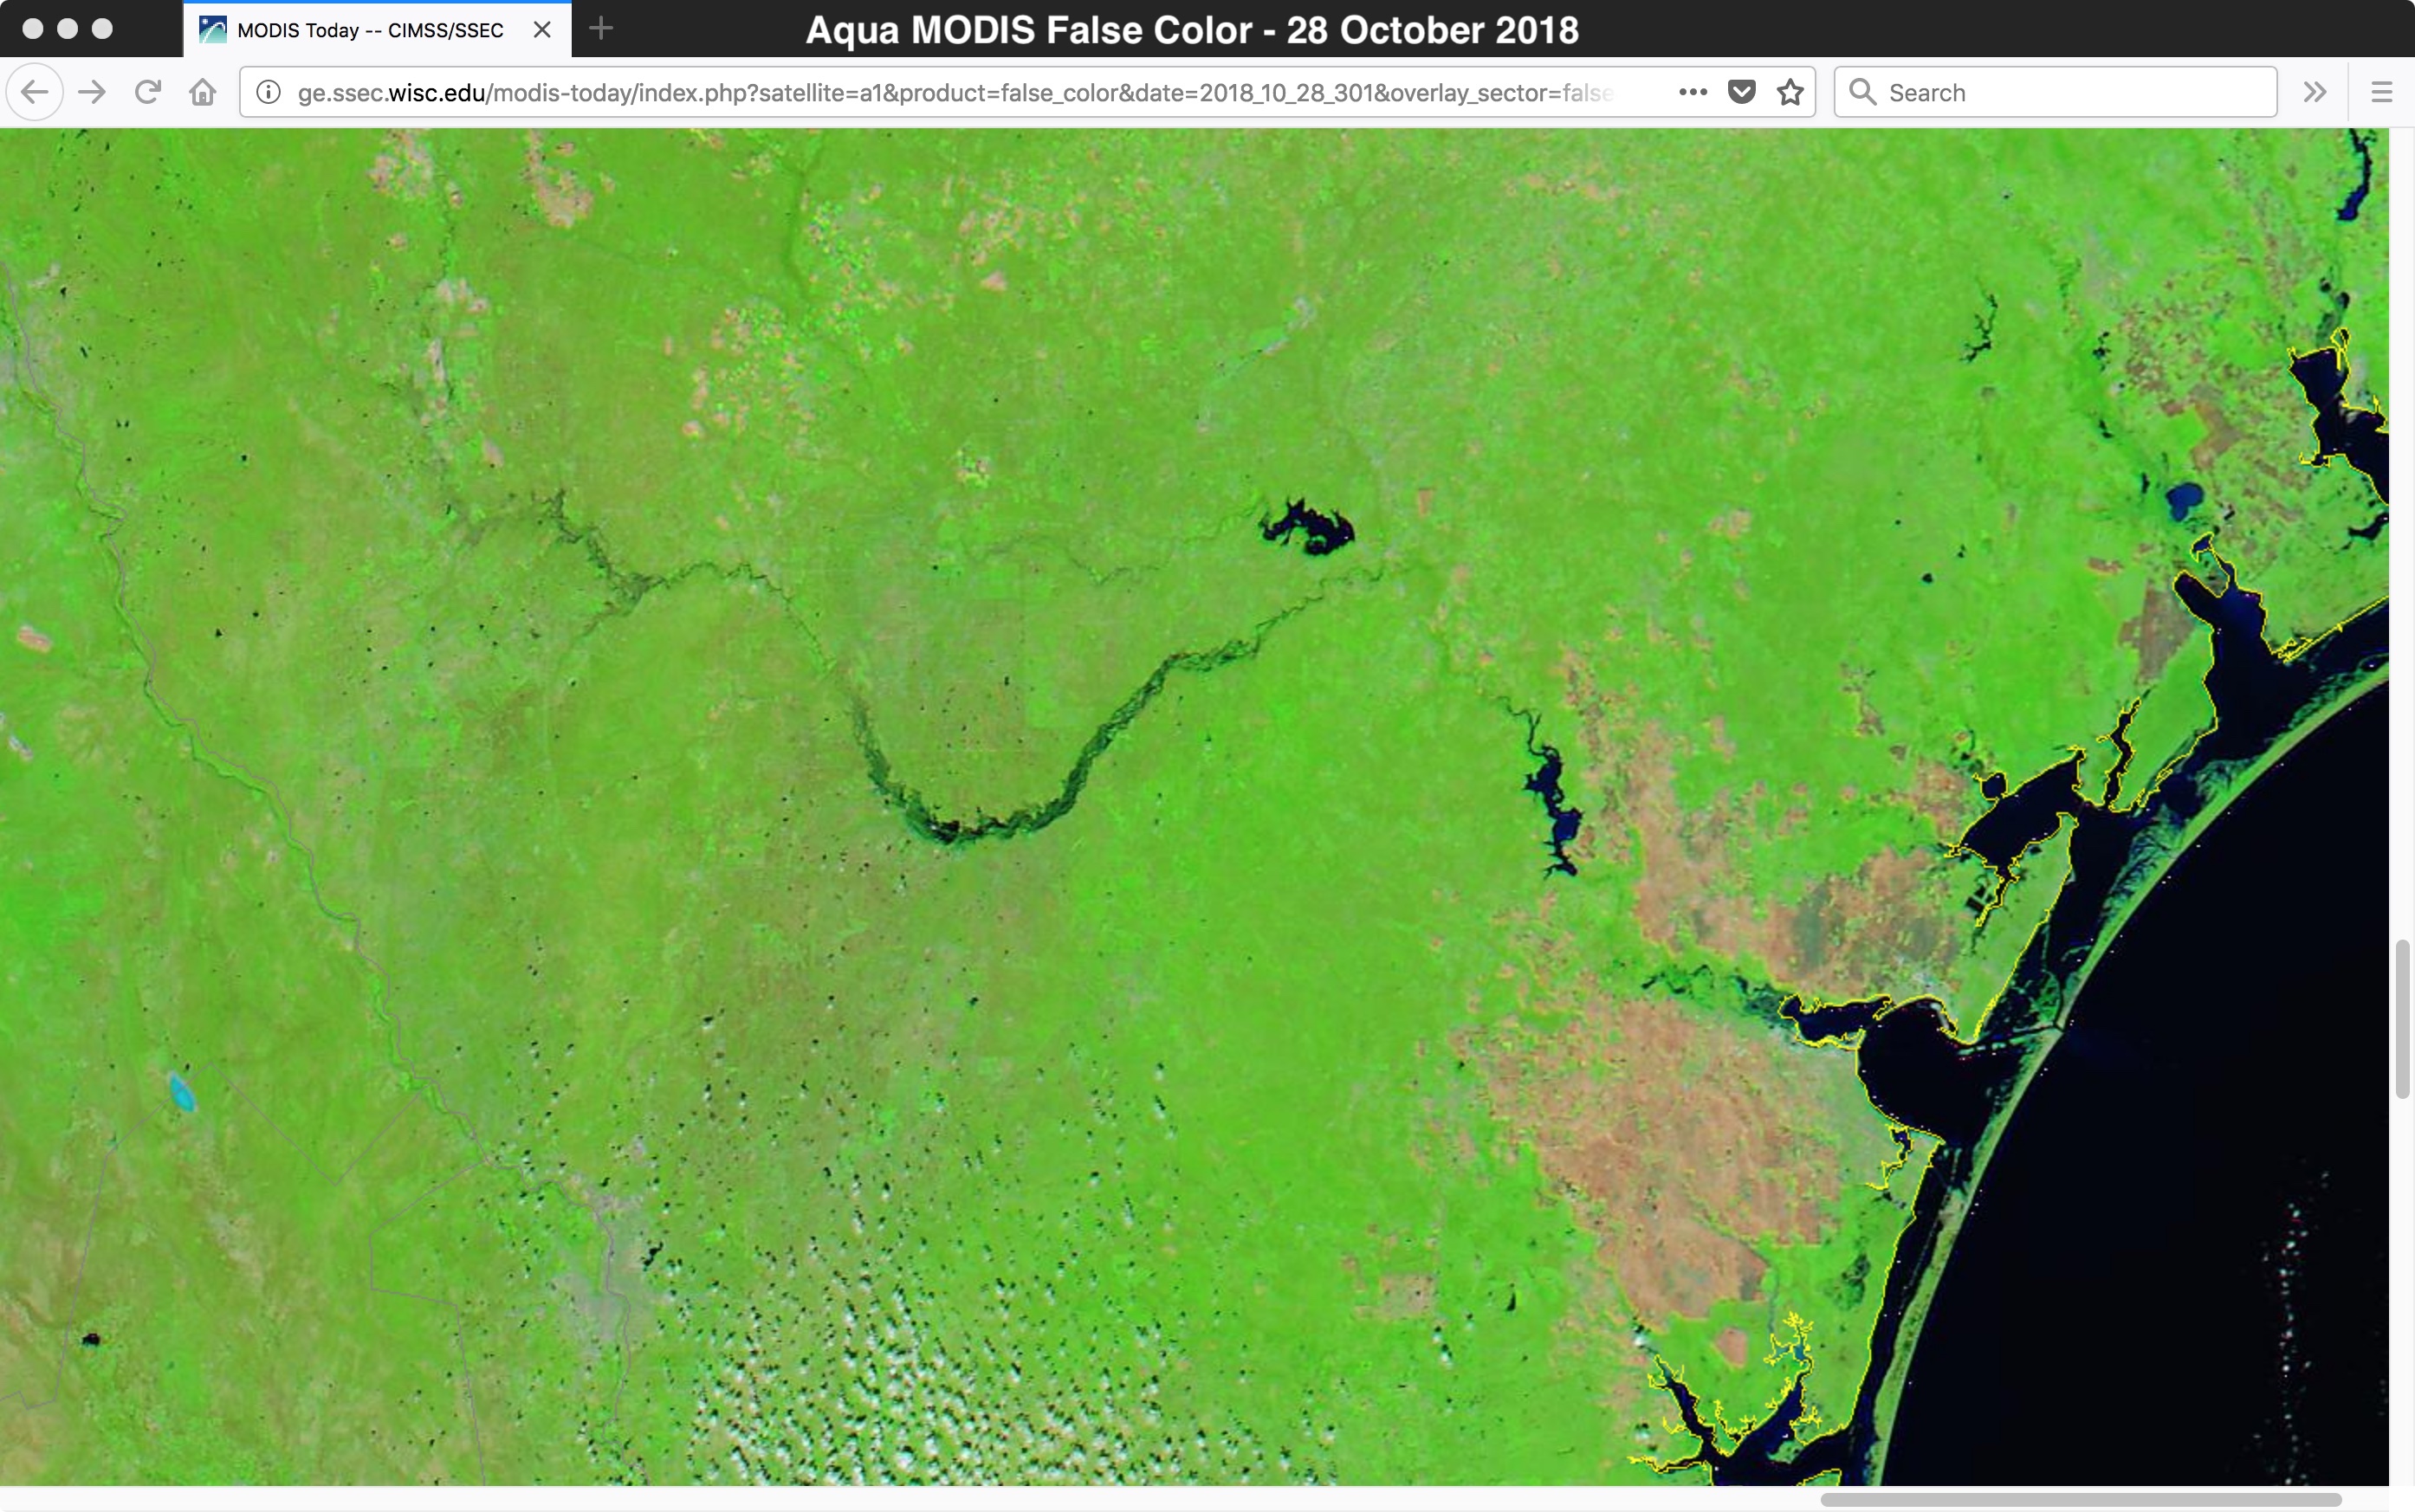
A toggle between before (10 October) and after (27 October) Aqua MODIS False Color Red-Green-Blue (RGB) images from the MODIS Today site (below) showed dramatic differences between the amount of water (darker shades of blue) flowing along portions of the Nueces River on those 2 days.
![Before (10 October) and after (27 October) Aqua MODIS False Color RGB images [click to enlarge]](https://cimss.ssec.wisc.edu/satellite-blog/wp-content/uploads/sites/5/2018/10/181010_181027_aqua_modis_truecolor_Nueces_River_TX_anim.gif)
Before (10 October) and after (27 October) Aqua MODIS False Color RGB images [click to enlarge]
![Suomi NPP VIIRS Visible (0.64 µm), Near-Infrared Vegetation (0.86 µm) and Near-Infrared Snow/Ice (1.61 µm) images [click to enlarge]](https://cimss.ssec.wisc.edu/satellite-blog/wp-content/uploads/sites/5/2018/10/181027_1918utc_suomiNPP_viirs_visible_nearInfraredVegetation_nearInfraredSnowIce_Nueces_River_TX_anim.gif)
Suomi NPP VIIRS Visible (0.64 µm), Near-Infrared Vegetation (0.86 µm) and Near-Infrared Snow/Ice (1.61 µm) images [click to enlarge]
===== 28 October Update =====
GOES-16 Near-Infrared “Vegetation” (0.86 µm) images at 1552 UTC on 27 and 28 October [click to enlarge]
A comparison of Suomi NPP VIIRS Near-Infrared “Vegetation (0.86 µm) and “Snow/Ice” (1.61 µm) images from the early afternoon hours on 27 and 28 October (below) displayed these 24-hour changes at a higher spatial resolution (375 meters, vs 1 km at satellite subpoint with GOES-16). The rear edge of the flood wave (located about 25 miles southeast of Cotulla) appeared to show up a bit better in the 0.86 µm images than the 1.61 µm.
Suomi NPP VIIRS Near-Infrared “Vegetation (0.86 µm) and “Snow/Ice” (1.61 µm) images from 27 and 28 October [click to enlarge]
![Aqua MODIS False Color RGB images from 27 and 28 October [click to enlarge]](https://cimss.ssec.wisc.edu/satellite-blog/wp-content/uploads/sites/5/2018/10/181027_181028_aqua_modis_falsecolor_Nueces_River_TX_flood_wave_anim.gif)
Aqua MODIS False Color RGB images from 27 and 28 October [click to enlarge]
===== 29 October Update =====

GOES-16 Near-Infrared “Vegetation” (0.86 µm) images from 1552 UTC on 27, 28 and 29 October [click to enlarge]
View only this post Read Less
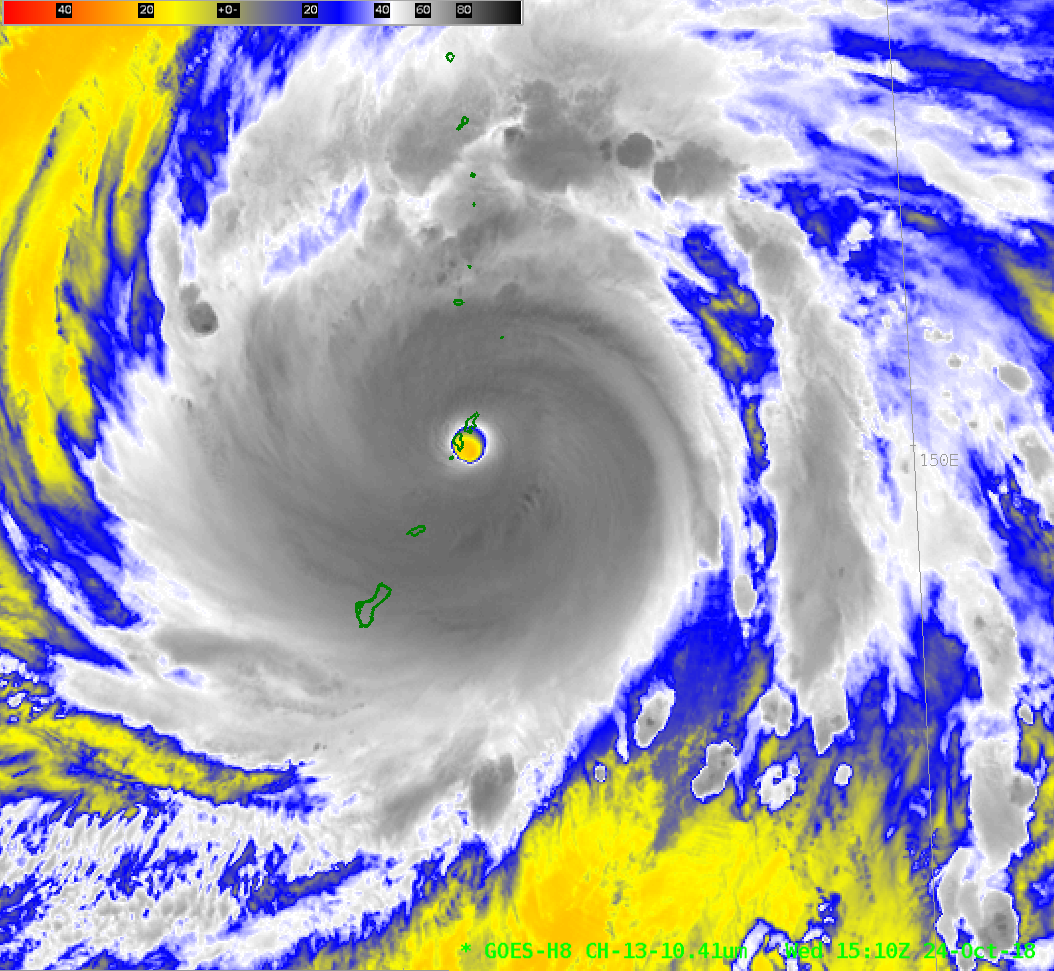
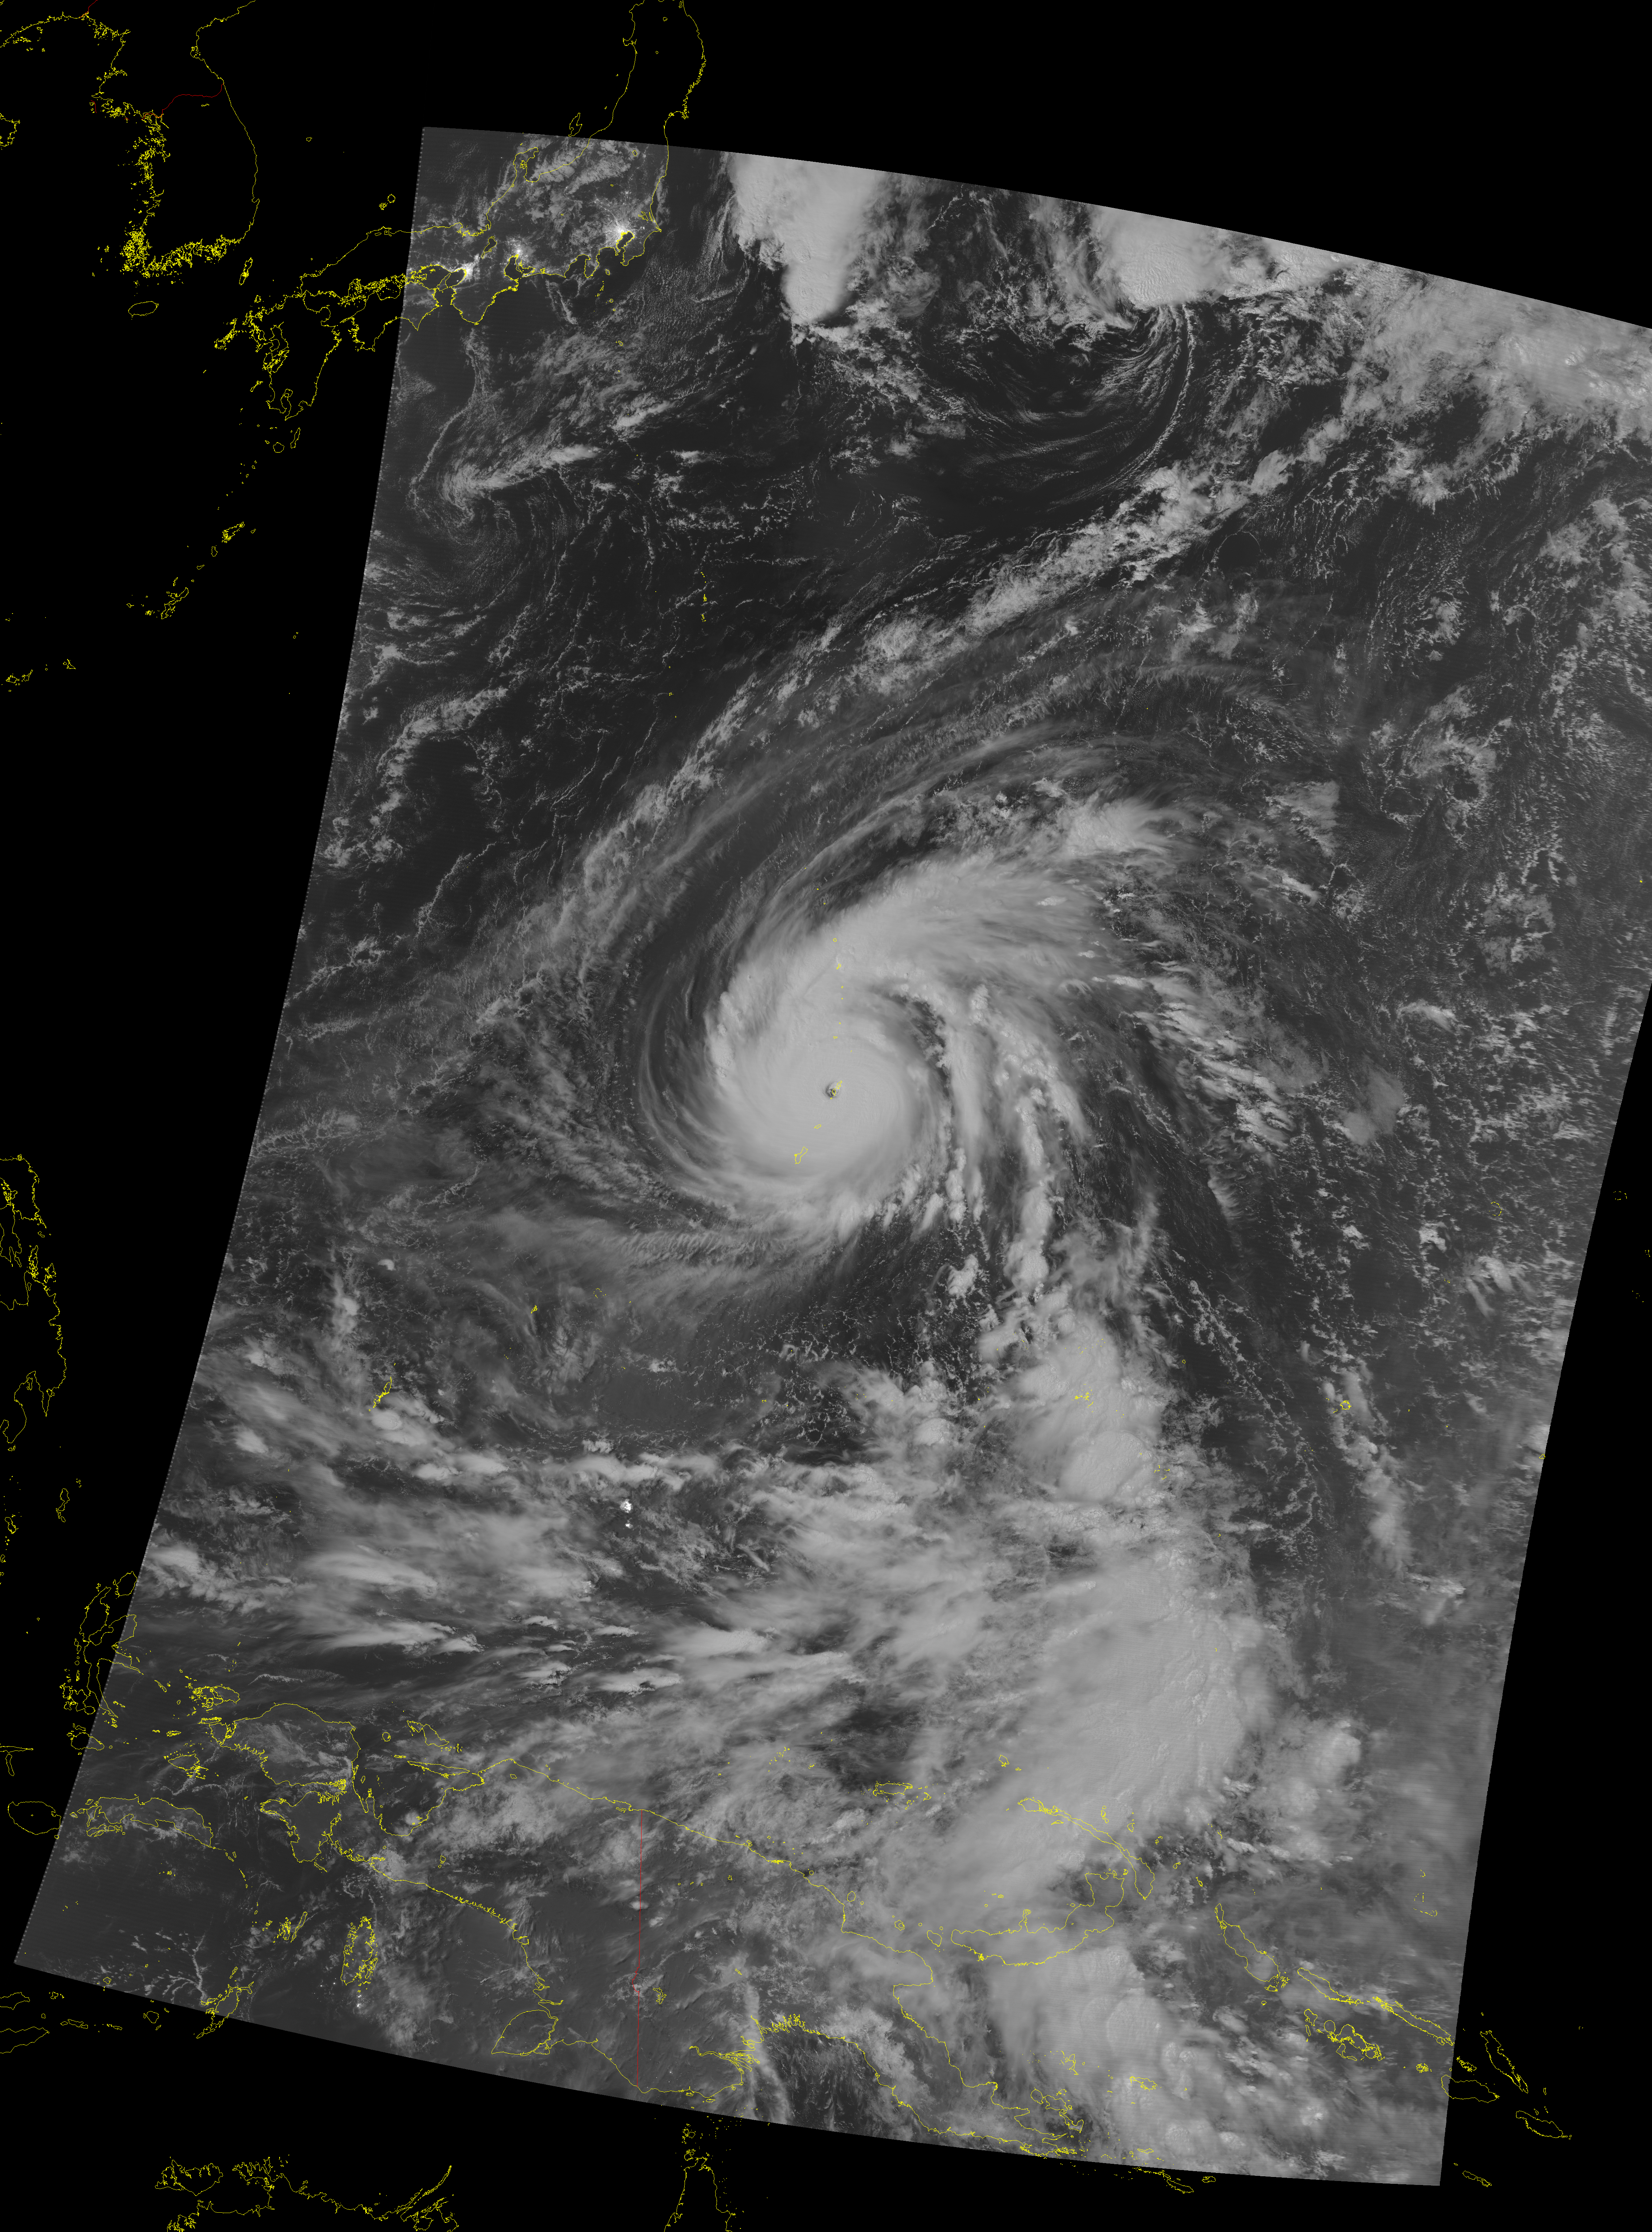
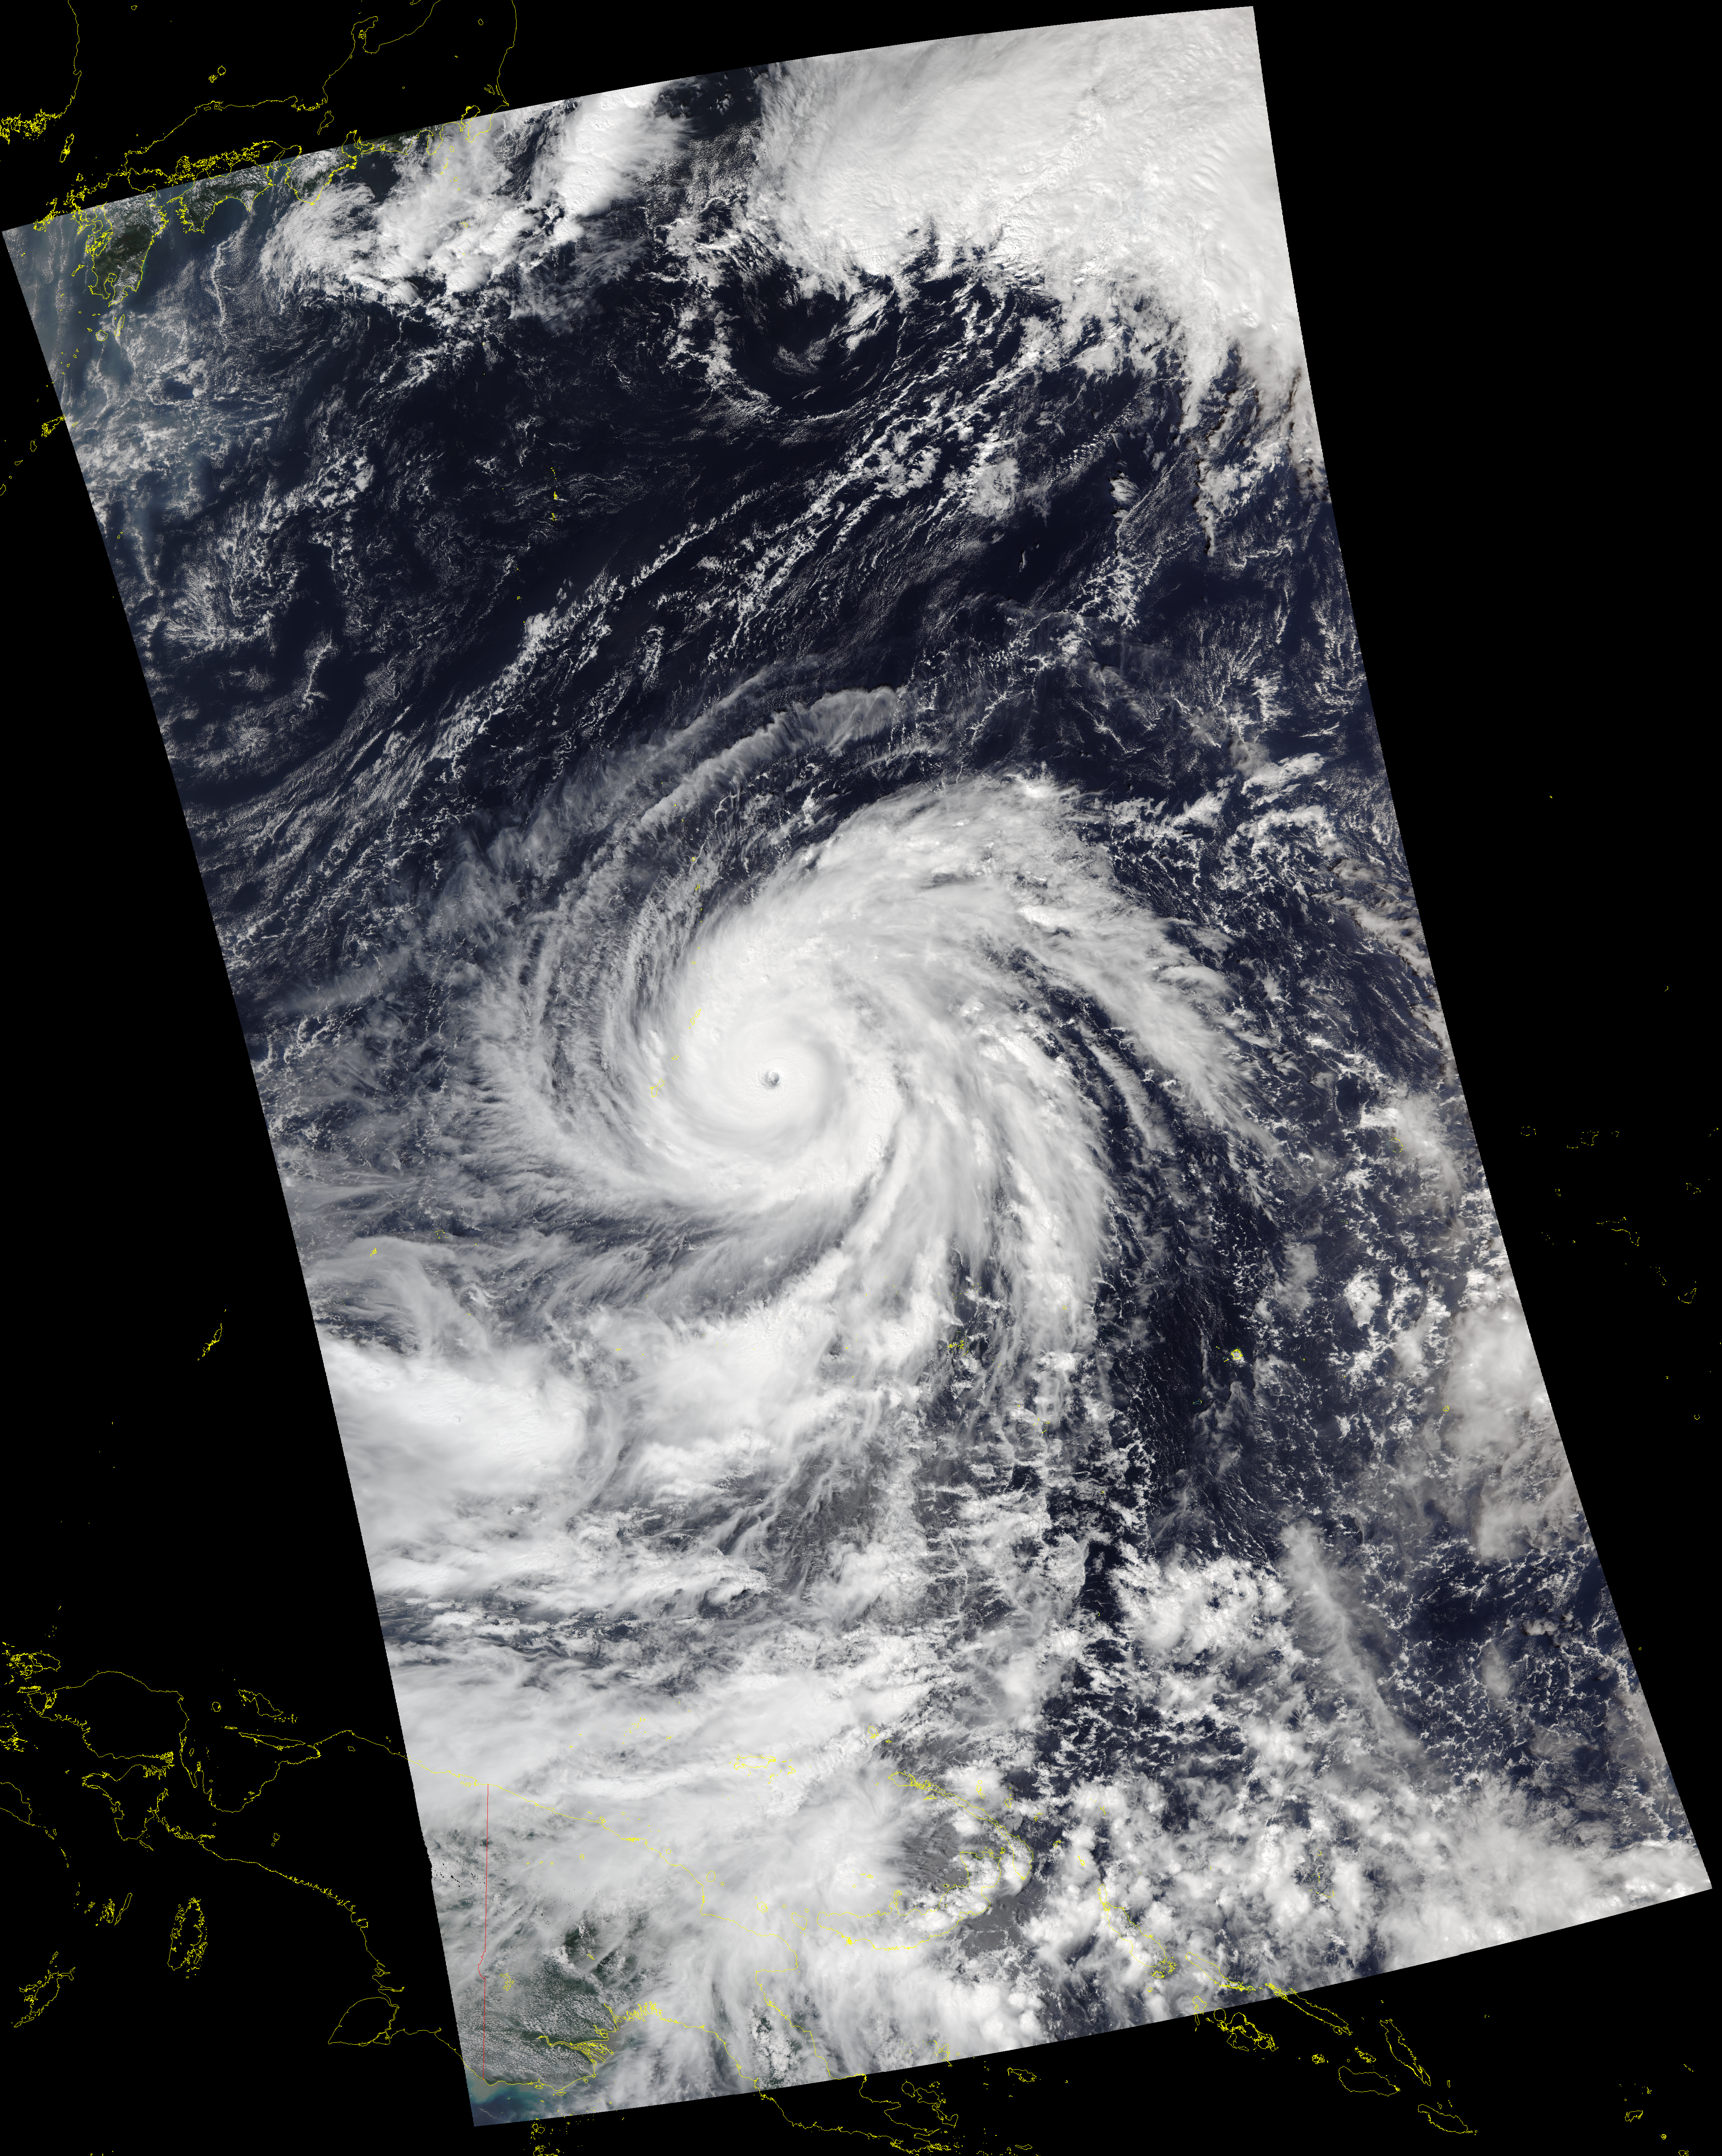
![Himawari-8 "Red" Visible (0.64 µm, left) and "Clean" Infrared Window (10.4 µm, right) images [click to play MP4 animation]](https://cimss.ssec.wisc.edu/satellite-blog/wp-content/uploads/sites/5/2018/10/HIM08_VIS_IR_YUTU_26OCT2018_2018300_002944_HIMAWARI-8_0002PANELS.GIF)
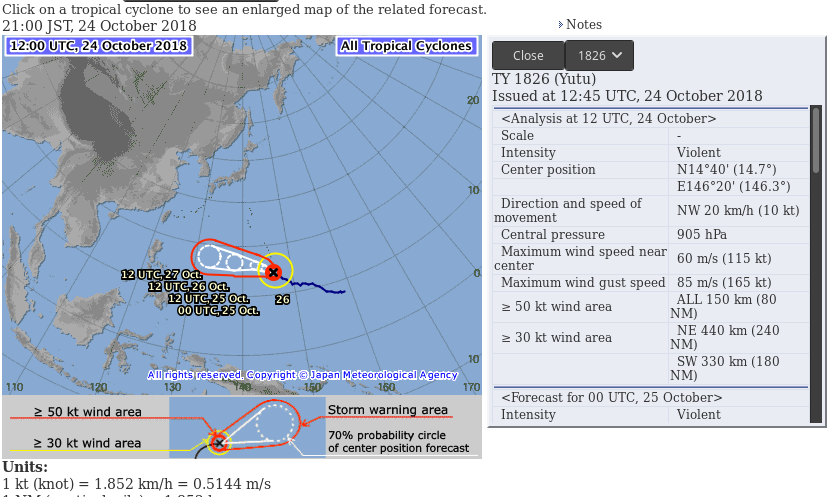
![DMSP-17 SSMIS Microwave (85 GHz) and Himawari-8 Infrared Window (10.4 µm) images [click to enlarge]](https://cimss.ssec.wisc.edu/satellite-blog/wp-content/uploads/sites/5/2018/10/181026__2123utc_dmsp17_microwave_2130utc_himawari8_infrared_Yutu_anim.gif)
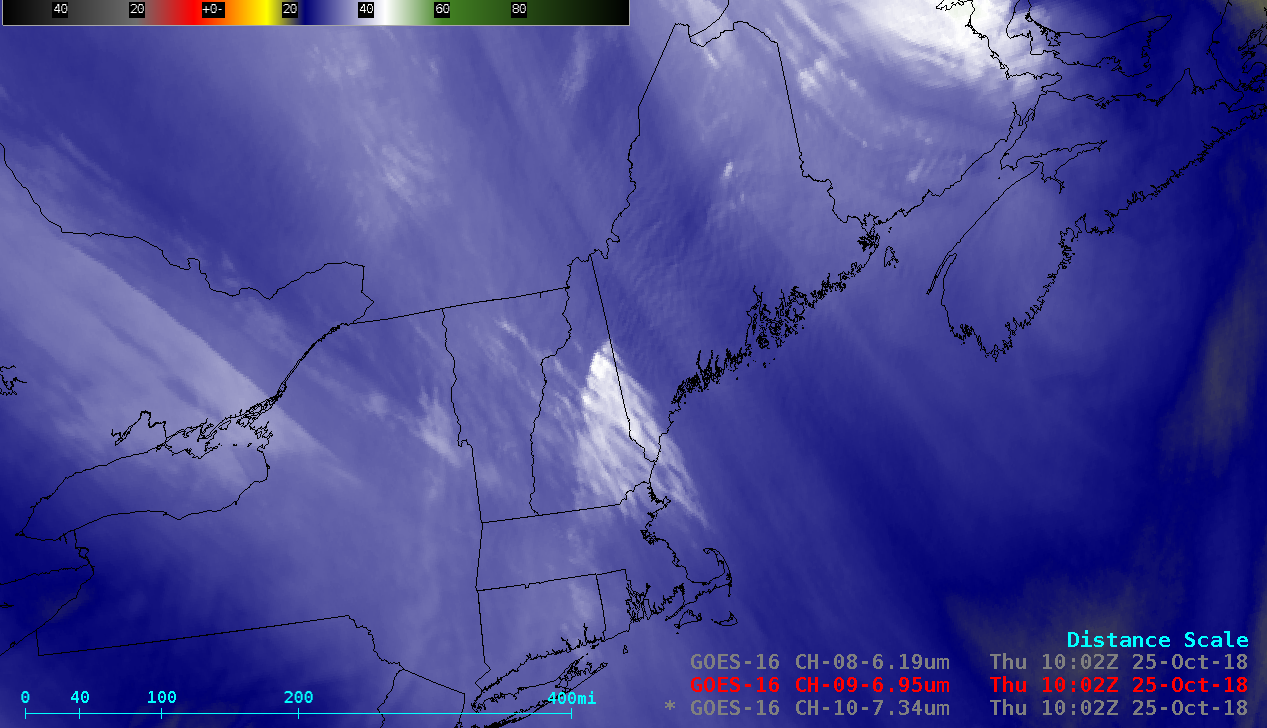
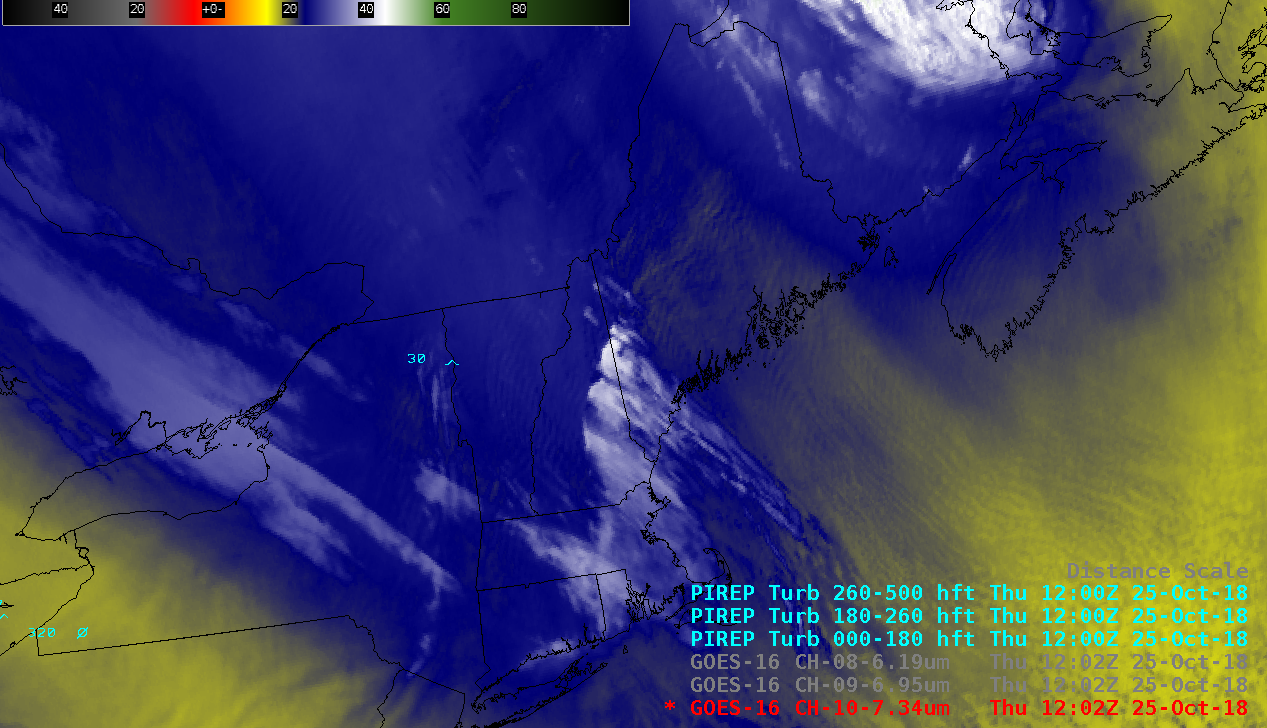
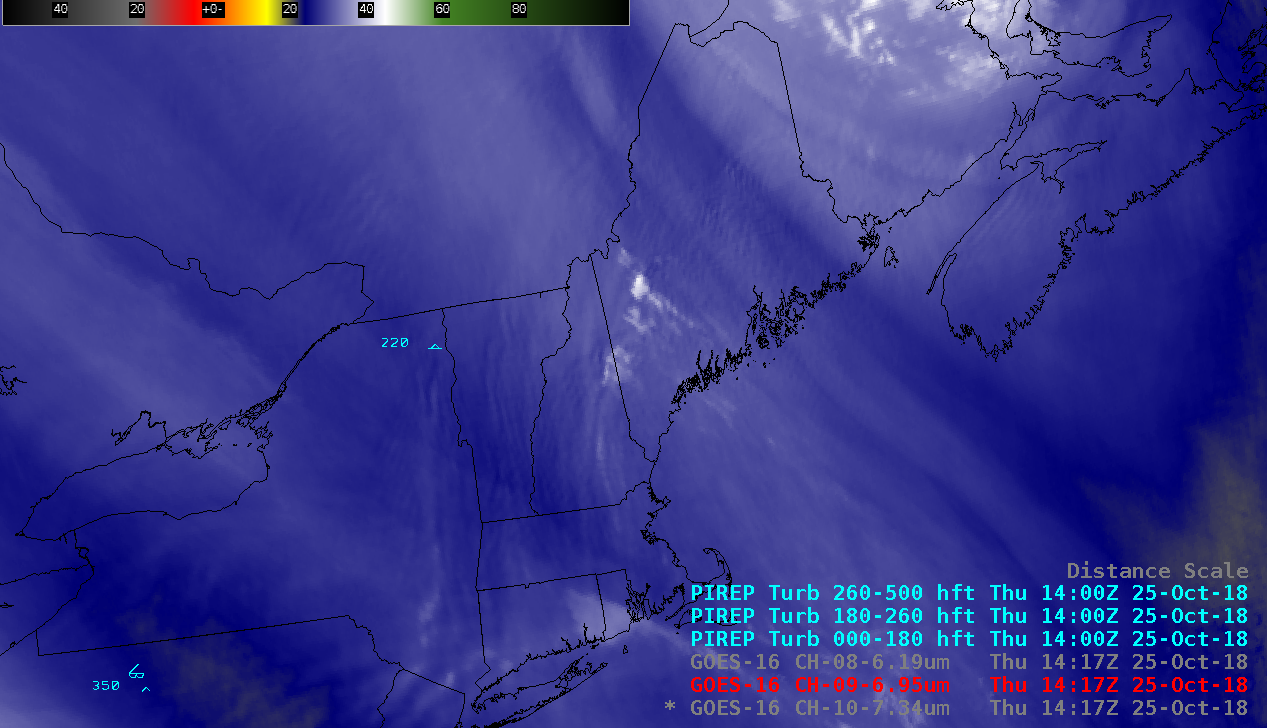
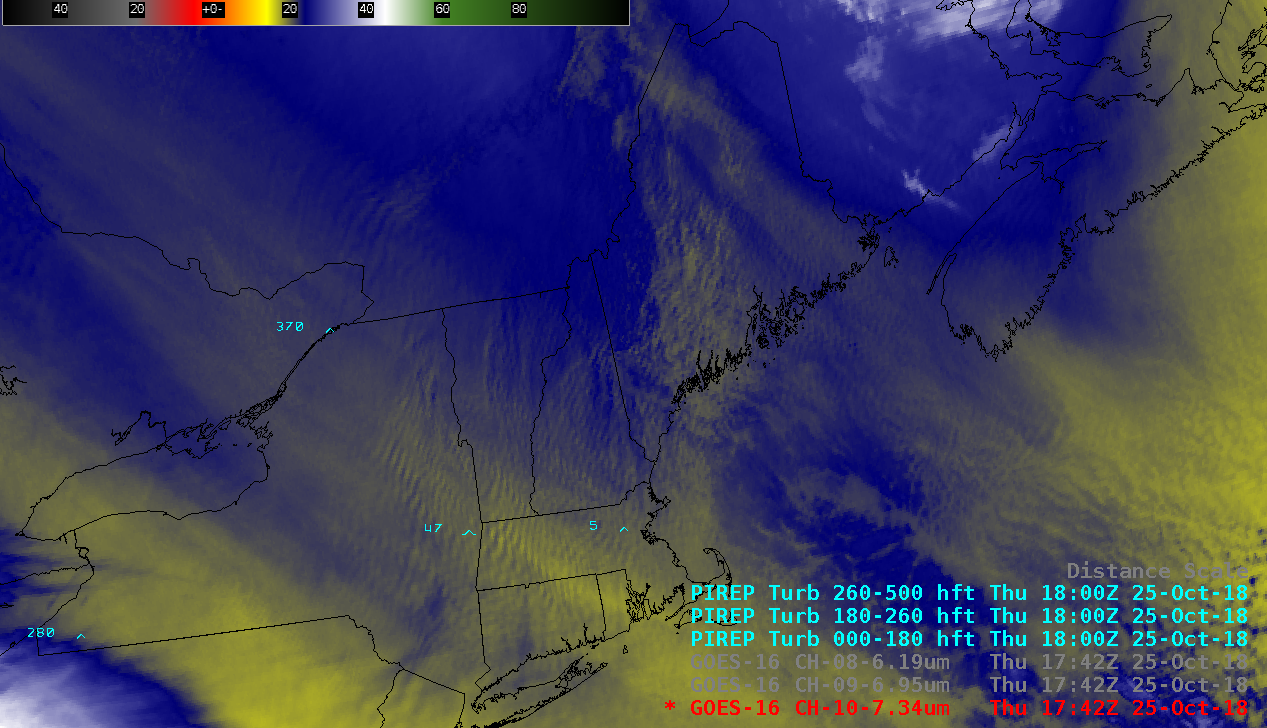
![GOES-16 Low-level (7.3 µm), Mid=level (6.9 µm) and Upper-level (6.2 µm) Water Vapor images [click to play MP4 animation]](https://cimss.ssec.wisc.edu/satellite-blog/wp-content/uploads/sites/5/2018/10/neus_wv9-20181025_100219.png)
![GOES-16 Mid-level Water Vapor (6.9 µm) image + Topography [click to enlarge]](https://cimss.ssec.wisc.edu/satellite-blog/wp-content/uploads/sites/5/2018/10/181025_goes16_waterVapor_topography_anim.gif)
![GOES-16 Mid-level (6.9 µm) Water Vapor images, with RAP40 wind isotachs at 300 hPa [click to play animation | MP4]](https://cimss.ssec.wisc.edu/satellite-blog/wp-content/uploads/sites/5/2018/10/181026_goes16_waterVapor_300hPa_winds_Northeast_US_anim.gif)
![Aqua MODIS Water Vapor (6.7 µm) and Infrared Window (11.0 µm) images [click to enlarge]](https://cimss.ssec.wisc.edu/satellite-blog/wp-content/uploads/sites/5/2018/10/181025_0648utc_aqua_modis_waterVapor_infrared_Northeast_US_anim.gif)
![Suomi NPP (0603 UTC) and NOAA-20 (0650 UTC) VIIRS Day/Night Band (0.7 µm) images [click to enlarge]](https://cimss.ssec.wisc.edu/satellite-blog/wp-content/uploads/sites/5/2018/10/181025_06utc_suomiNPP_noaa20_viirs_dayNightBand_Northeast_US_anim.gif)
![GOES-16 Cloud Top Height product [click to play animation | MP4]](https://cimss.ssec.wisc.edu/satellite-blog/wp-content/uploads/sites/5/2018/10/181026_goes16_cloudTopHeight_Northeast_US_anim.gif)
![GOES-16 Cloud Top Phase product [click to play animation | MP4]](https://cimss.ssec.wisc.edu/satellite-blog/wp-content/uploads/sites/5/2018/10/181026_goes16_cloudTopPhase_Northeast_US_anim.gif)
