GOES-16 “Red” Visible (0.64 µm, top left), Shortwave Infrared (3.9 µm, top right), “Clean” Infrared Window (10.3 µm, bottom left) and Fire Temperature (bottom right) [click to play animation | MP4]
A GOES-16 Mesoscale Domain Sector was positioned over California beginning at 2115 UTC, providing imagery at 1-minute intervals — a comparison of Visible and Shortwave Infrared images (below) showed how quickly the hot thermal signature of the fire (yellow to red enhancement) advanced southwestward during the remaining 3 hours of daylight. Just northwest of the fire, Chico (station identifier KCIC) reported very low relative humidity values (6% at 21 UTC), as seen by the large spread between temperature and dewpoint late in the day.
GOES-16 “Red” Visible (0.64 µm, left) and Shortwave Infrared (3.9 µm, right) images [click to play MP4 animation]
![NOAA-18 AVHRR Visible (0.64 µm), Near-Infrared "Vegetation" (0.86 µm), Shortwave Infrared (3.7 µm) and Infrared Window (10.8 µµ) images [click to enlarge]](https://cimss.ssec.wisc.edu/satellite-blog/wp-content/uploads/sites/5/2018/11/181108_1712utc_noaa18_visible_vegetation_shortwaveInfrared_infraredWindow_Camp_Fire_CA_anim.gif)
NOAA-18 AVHRR Visible (0.64 µm), Near-Infrared “Vegetation” (0.86 µm), Shortwave Infrared (3.7 µm) and Infrared Window (10.8 µm) images [click to enlarge]
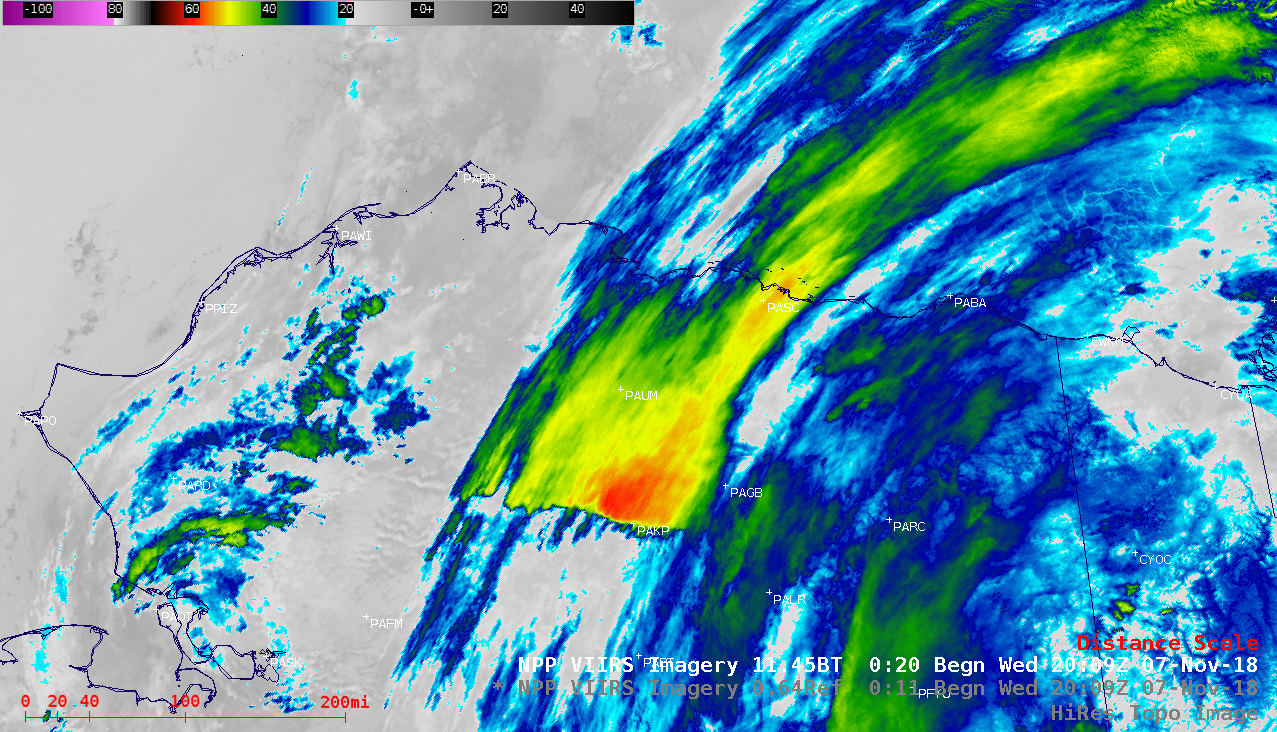
NOAA-20 VIIRS Visible (0.64 µm), Near-Infrared “Snow/Ice” (1.61 µm) and Infrared Window (11.45 µm) images [click to enlarge]
Aqua MODIS Visible (0.65 µm), Near-Infrared “Snow/Ice” (1.61 µm) and Infrared Window (11.0 µm) images [click to enlarge]
![NOAA-20 Visible (0.64 µm), Day/Night Band (0.7 µm), Near-Infrared "Snow/Ice" (1.61 µm), Shortwave Infrared (3.74 µm) and Infrared Window (11.45 µm) images [click to enlarge]](https://cimss.ssec.wisc.edu/satellite-blog/wp-content/uploads/sites/5/2018/11/181108_2037utc_noaa20_viirs_visible_dayNightBand_snowIce_shortwaveInfrared_infraredWindow_Camp_Fire_CA_anim.gif)
NOAA-20 Visible (0.64 µm), Day/Night Band (0.7 µm), Near-Infrared “Snow/Ice” (1.61 µm), Shortwave Infrared (3.74 µm) and Infrared Window (11.45 µm) images [click to enlarge]
![Aqua MODIS Visible (0.65 µm), Near-Infrared "Cirrus" (1.37 µm), Near-Infrared "Snow/Ice" (1.61 µm), Shortwave Infrared (3.7 µm) and Infrared Window (11.0 µm) images [click to enlarge]](https://cimss.ssec.wisc.edu/satellite-blog/wp-content/uploads/sites/5/2018/11/181108_2123utc_aqua_modis_visible_cirrus_snowIce_shortwaveInfrared_infraredWindow_Camp_Fire_CA_anim.gif)
Aqua MODIS Visible (0.65 µm), Near-Infrared “Cirrus” (1.37 µm), Near-Infrared “Snow/Ice” (1.61 µm), Shortwave Infrared (3.7 µm) and Infrared Window (11.0 µm) images [click to enlarge]
Record dry airmass over our region today. The 00Z Oakland Sounding from this afternoon reported a precipitable water value of only 0.12″. This is well below the record for the date of 0.24″ and one of the all-time driest soundings at Oakland in more than 60 years. #CAwx pic.twitter.com/Ohtg5mvsQO
— NWS Bay Area (@NWSBayArea) November 9, 2018
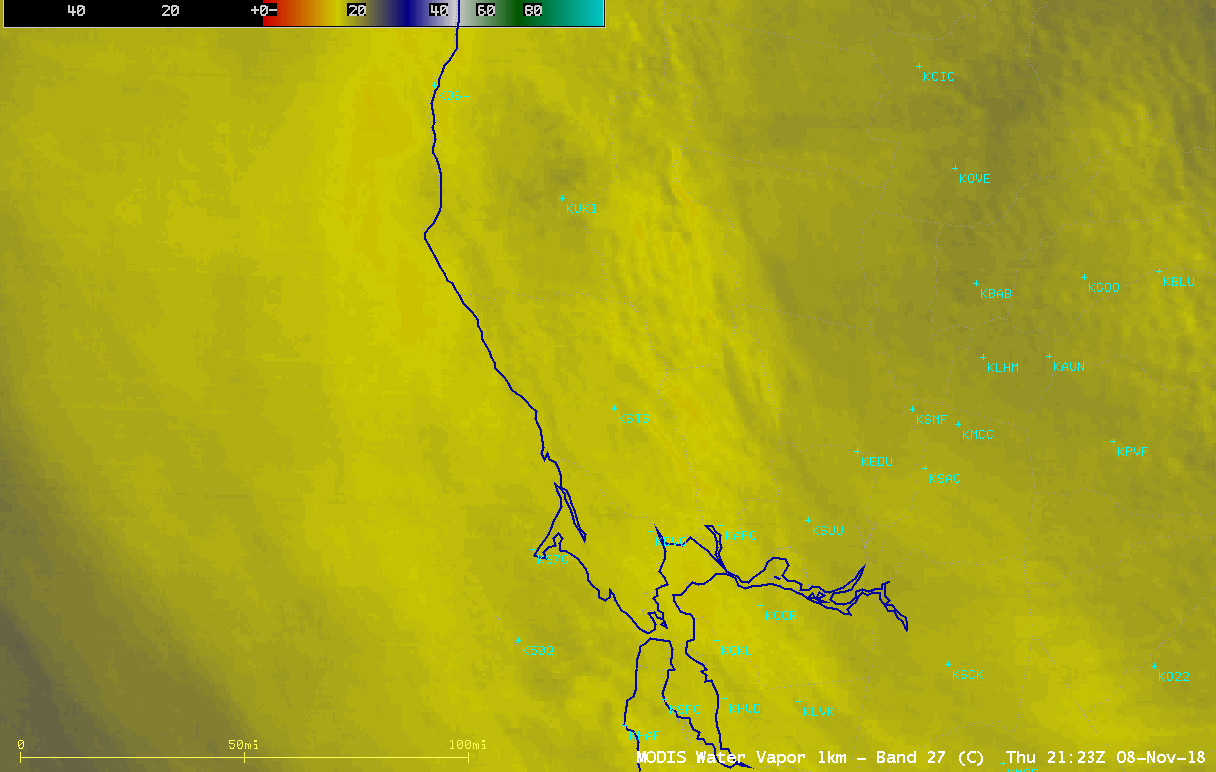
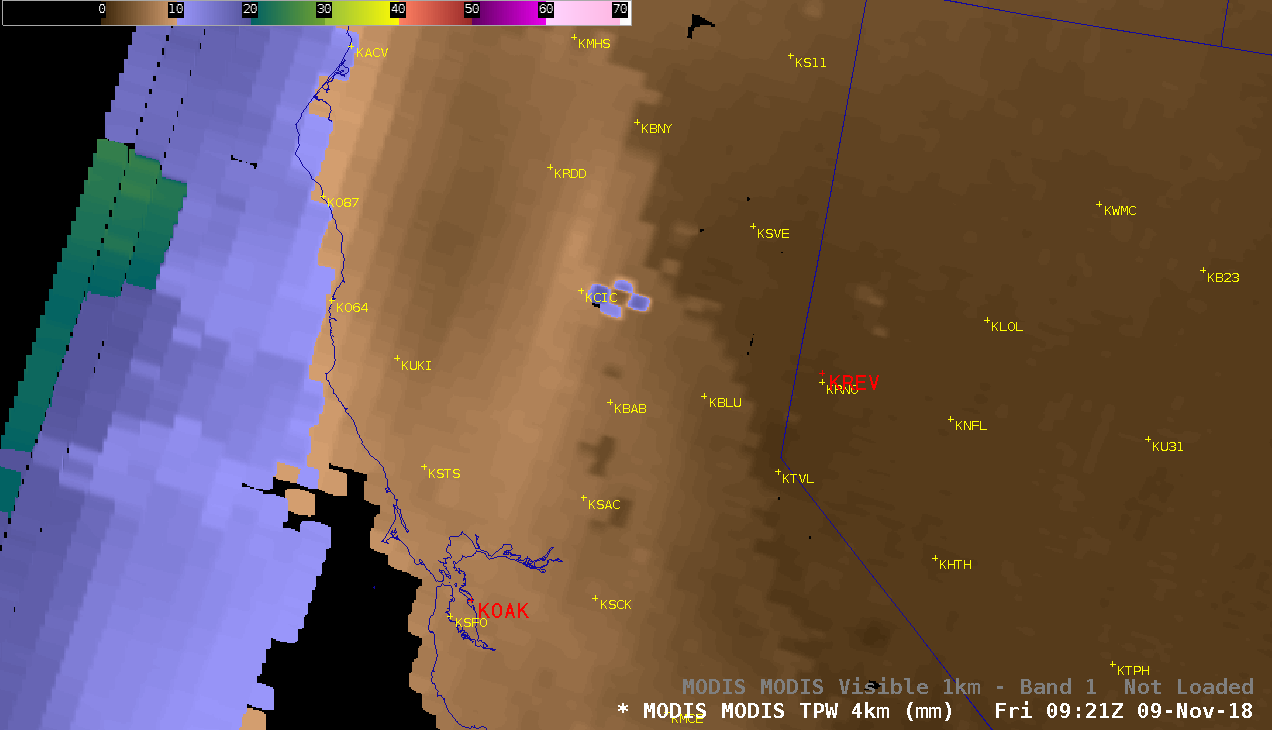
The Aqua MODIS Total Precipitable Water product at 2123 UTC (below) showed widespread values in the 3-5 mm range (darker shades of brown) over much or northern California. 12 hours later, the TPW value from the 12 UTC Oakland sounding was slightly lower (2.9 mm or 0.11 inch) — and the MODIS TPW product at 0921 UTC continued to show widespread dry air over California.
![Aqua MODIS Total Precipitable Water product and Visible (0.65 µm) image at 2123 UTC [click to enlarge]](https://cimss.ssec.wisc.edu/satellite-blog/wp-content/uploads/sites/5/2018/11/181108_2123utc_modis_totalPrecipitableWater_visible_NorCal_anim.gif)
Aqua MODIS Total Precipitable Water product and Visible (0.65 µm) image at 2123 UTC [click to enlarge]
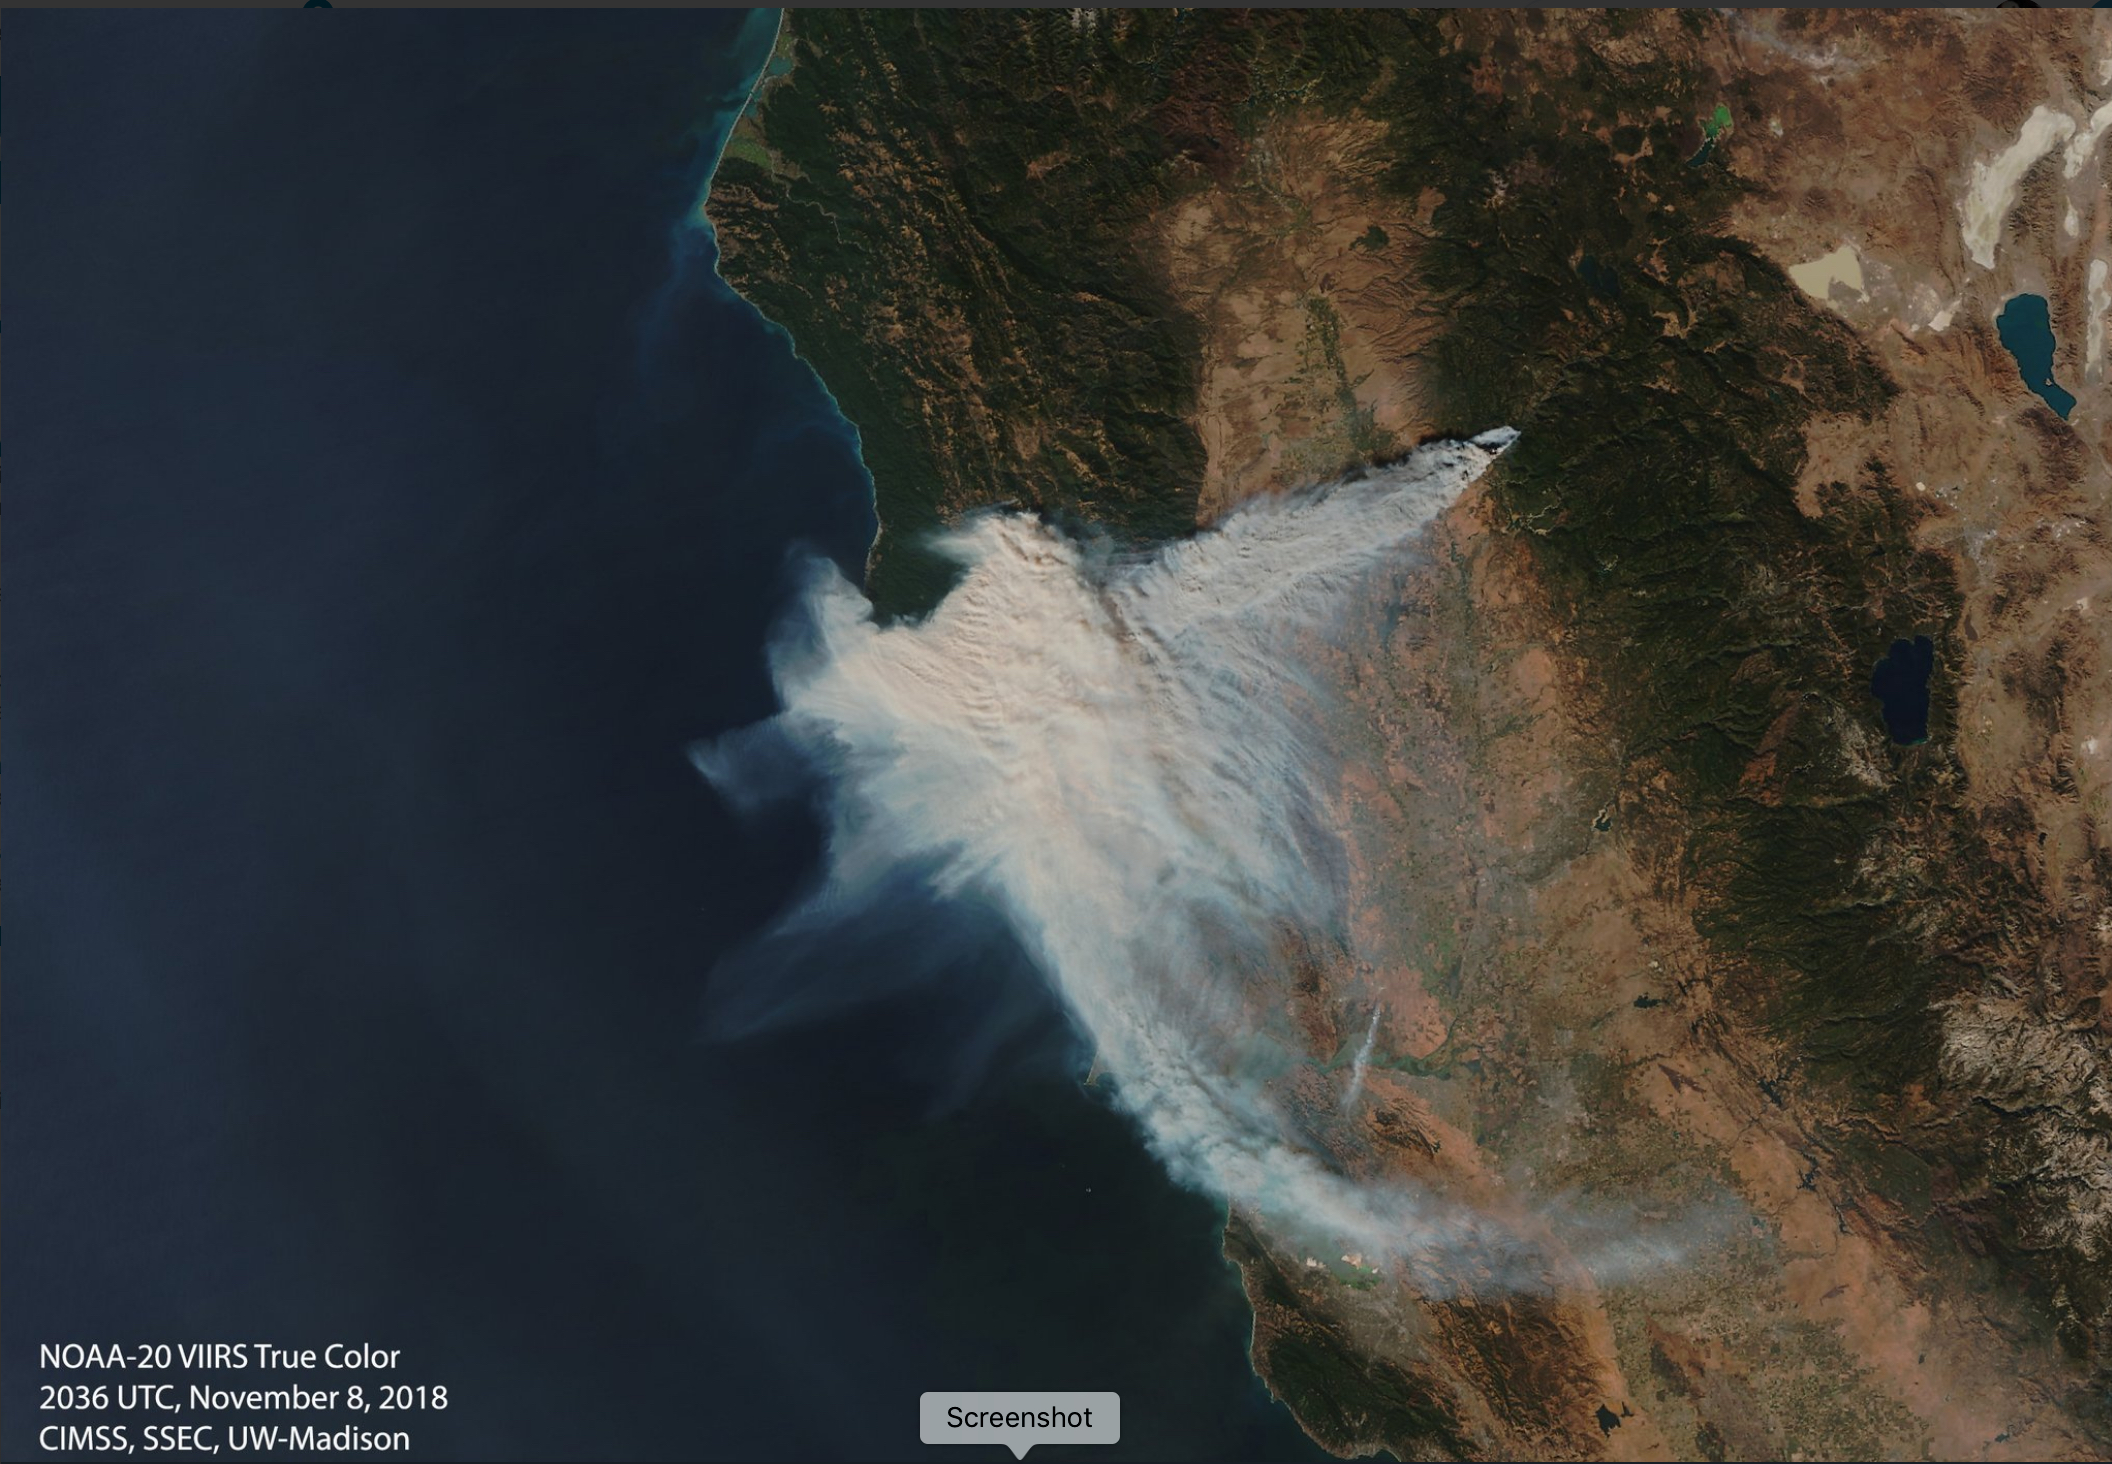
![NOAA-20 VIIRS True Color RGB image [click to enlarge]](https://cimss.ssec.wisc.edu/satellite-blog/wp-content/uploads/sites/5/2018/11/181108_2036utc_noaa20_viirs_truecolor_Camp_Fire_CA.jpg)
NOAA-20 VIIRS True Color RGB image [click to enlarge]
![NOAA-15 AVHRR Shortwave Infrared (3.7 µm) image; major highways are plotted in cyan, with Interstate highways plotted in red [click to enlarge]](https://cimss.ssec.wisc.edu/satellite-blog/wp-content/uploads/sites/5/2018/11/181109_0225UTC_NOAA15_SWIR_CA.GIF)
NOAA-15 AVHRR Shortwave Infrared (3.7 µm) image; major highways are plotted in cyan, with Interstate highways plotted in red [click to enlarge]
![Time series of surface observations for Santa Rosa [click to enlarge]](https://cimss.ssec.wisc.edu/satellite-blog/wp-content/uploads/sites/5/2018/11/181108_KSTS_SFCMG.GIF)
Time series of surface observations from Santa Rosa [click to enlarge]
![Time series of surface observations from San Francisco International Airport [click to enlarge]](https://cimss.ssec.wisc.edu/satellite-blog/wp-content/uploads/sites/5/2018/11/181108_KSFO_SFCMG.GIF)
Time series of surface observations from San Francisco International Airport [click to enlarge]
===== 09 November Update =====
![NOAA-20 VIIRS Day/Night Band (0.7 µm) and Shortwave Infrared (3.74 µm) images [click to enlarge]](https://cimss.ssec.wisc.edu/satellite-blog/wp-content/uploads/sites/5/2018/11/181109_0849utc_noaa20_viirs_dayNightBand_shortwaveInfrared_Camp_Fire_CA_anim.gif)
NOAA-20 VIIRS Day/Night Band (0.7 µm) and Shortwave Infrared (3.74 µm) images [click to enlarge]
![Suomi NPP VIIRS Day/Night Band (0.7 µm) and Shortwave Infrared (3.74 µm) images [click to enlarge]](https://cimss.ssec.wisc.edu/satellite-blog/wp-content/uploads/sites/5/2018/11/181109_0942utc_suomiNPP_viirs_dayNightBand_shortwaveInfrared_Camp_Fire_CA_anim.gif)
Suomi NPP VIIRS Day/Night Band (0.7 µm) and Shortwave Infrared (3.74 µm) images [click to enlarge]
![Suomi NPP VIIRS True Color RGB image at 2104 UTC [click to enlarge]](https://cimss.ssec.wisc.edu/satellite-blog/wp-content/uploads/sites/5/2018/11/181109_2104utc_suomiNPP_viirs_truecolor_CalFires_smoke.jpg)
Suomi NPP VIIRS True Color RGB image at 2104 UTC [click to enlarge]
![NOAA-20 VIIRS True Color RGB image at 2154 UTC [click to enlarge]](https://cimss.ssec.wisc.edu/satellite-blog/wp-content/uploads/sites/5/2018/11/181109_2154utc_noaa20_viirs_truecolor_CalFires_smoke.jpg)
NOAA-20 VIIRS True Color RGB image at 2154 UTC [click to enlarge]
![GOES-16 "Red" Visible (0.64 µm, left) and Shortwave Infrared (3.9 µm, right) images [click to play MP4 animation]](https://cimss.ssec.wisc.edu/satellite-blog/wp-content/uploads/sites/5/2018/11/G16_VIS_SWIR_NORCAL_FIRES_09NOV2018_2018313_190125_GOES-16_0002PANELS.GIF)
GOES-16 “Red” Visible (0.64 µm, left) and Shortwave Infrared (3.9 µm, right) images [click to play MP4 animation]
![US Drought Monitor conditions as of 06 November [click to enlarge]](https://cimss.ssec.wisc.edu/satellite-blog/wp-content/uploads/sites/5/2018/11/181106_CA_drought_monitor.png)
US Drought Monitor conditions as of 06 November [click to enlarge]
Paradise, CA has only seen 0.88″ of rain since May 1st. The Average rainfall between May 1st & Oct 31st is 7.13″! This is the conditions that have lead to a absolutely horrific fire known as the #CampFire #CAwx #CalFire #CaliforniaFires pic.twitter.com/CcvsMeogNq
— James Sinko (@JamesSinko) November 9, 2018
====== 11 November Update =====
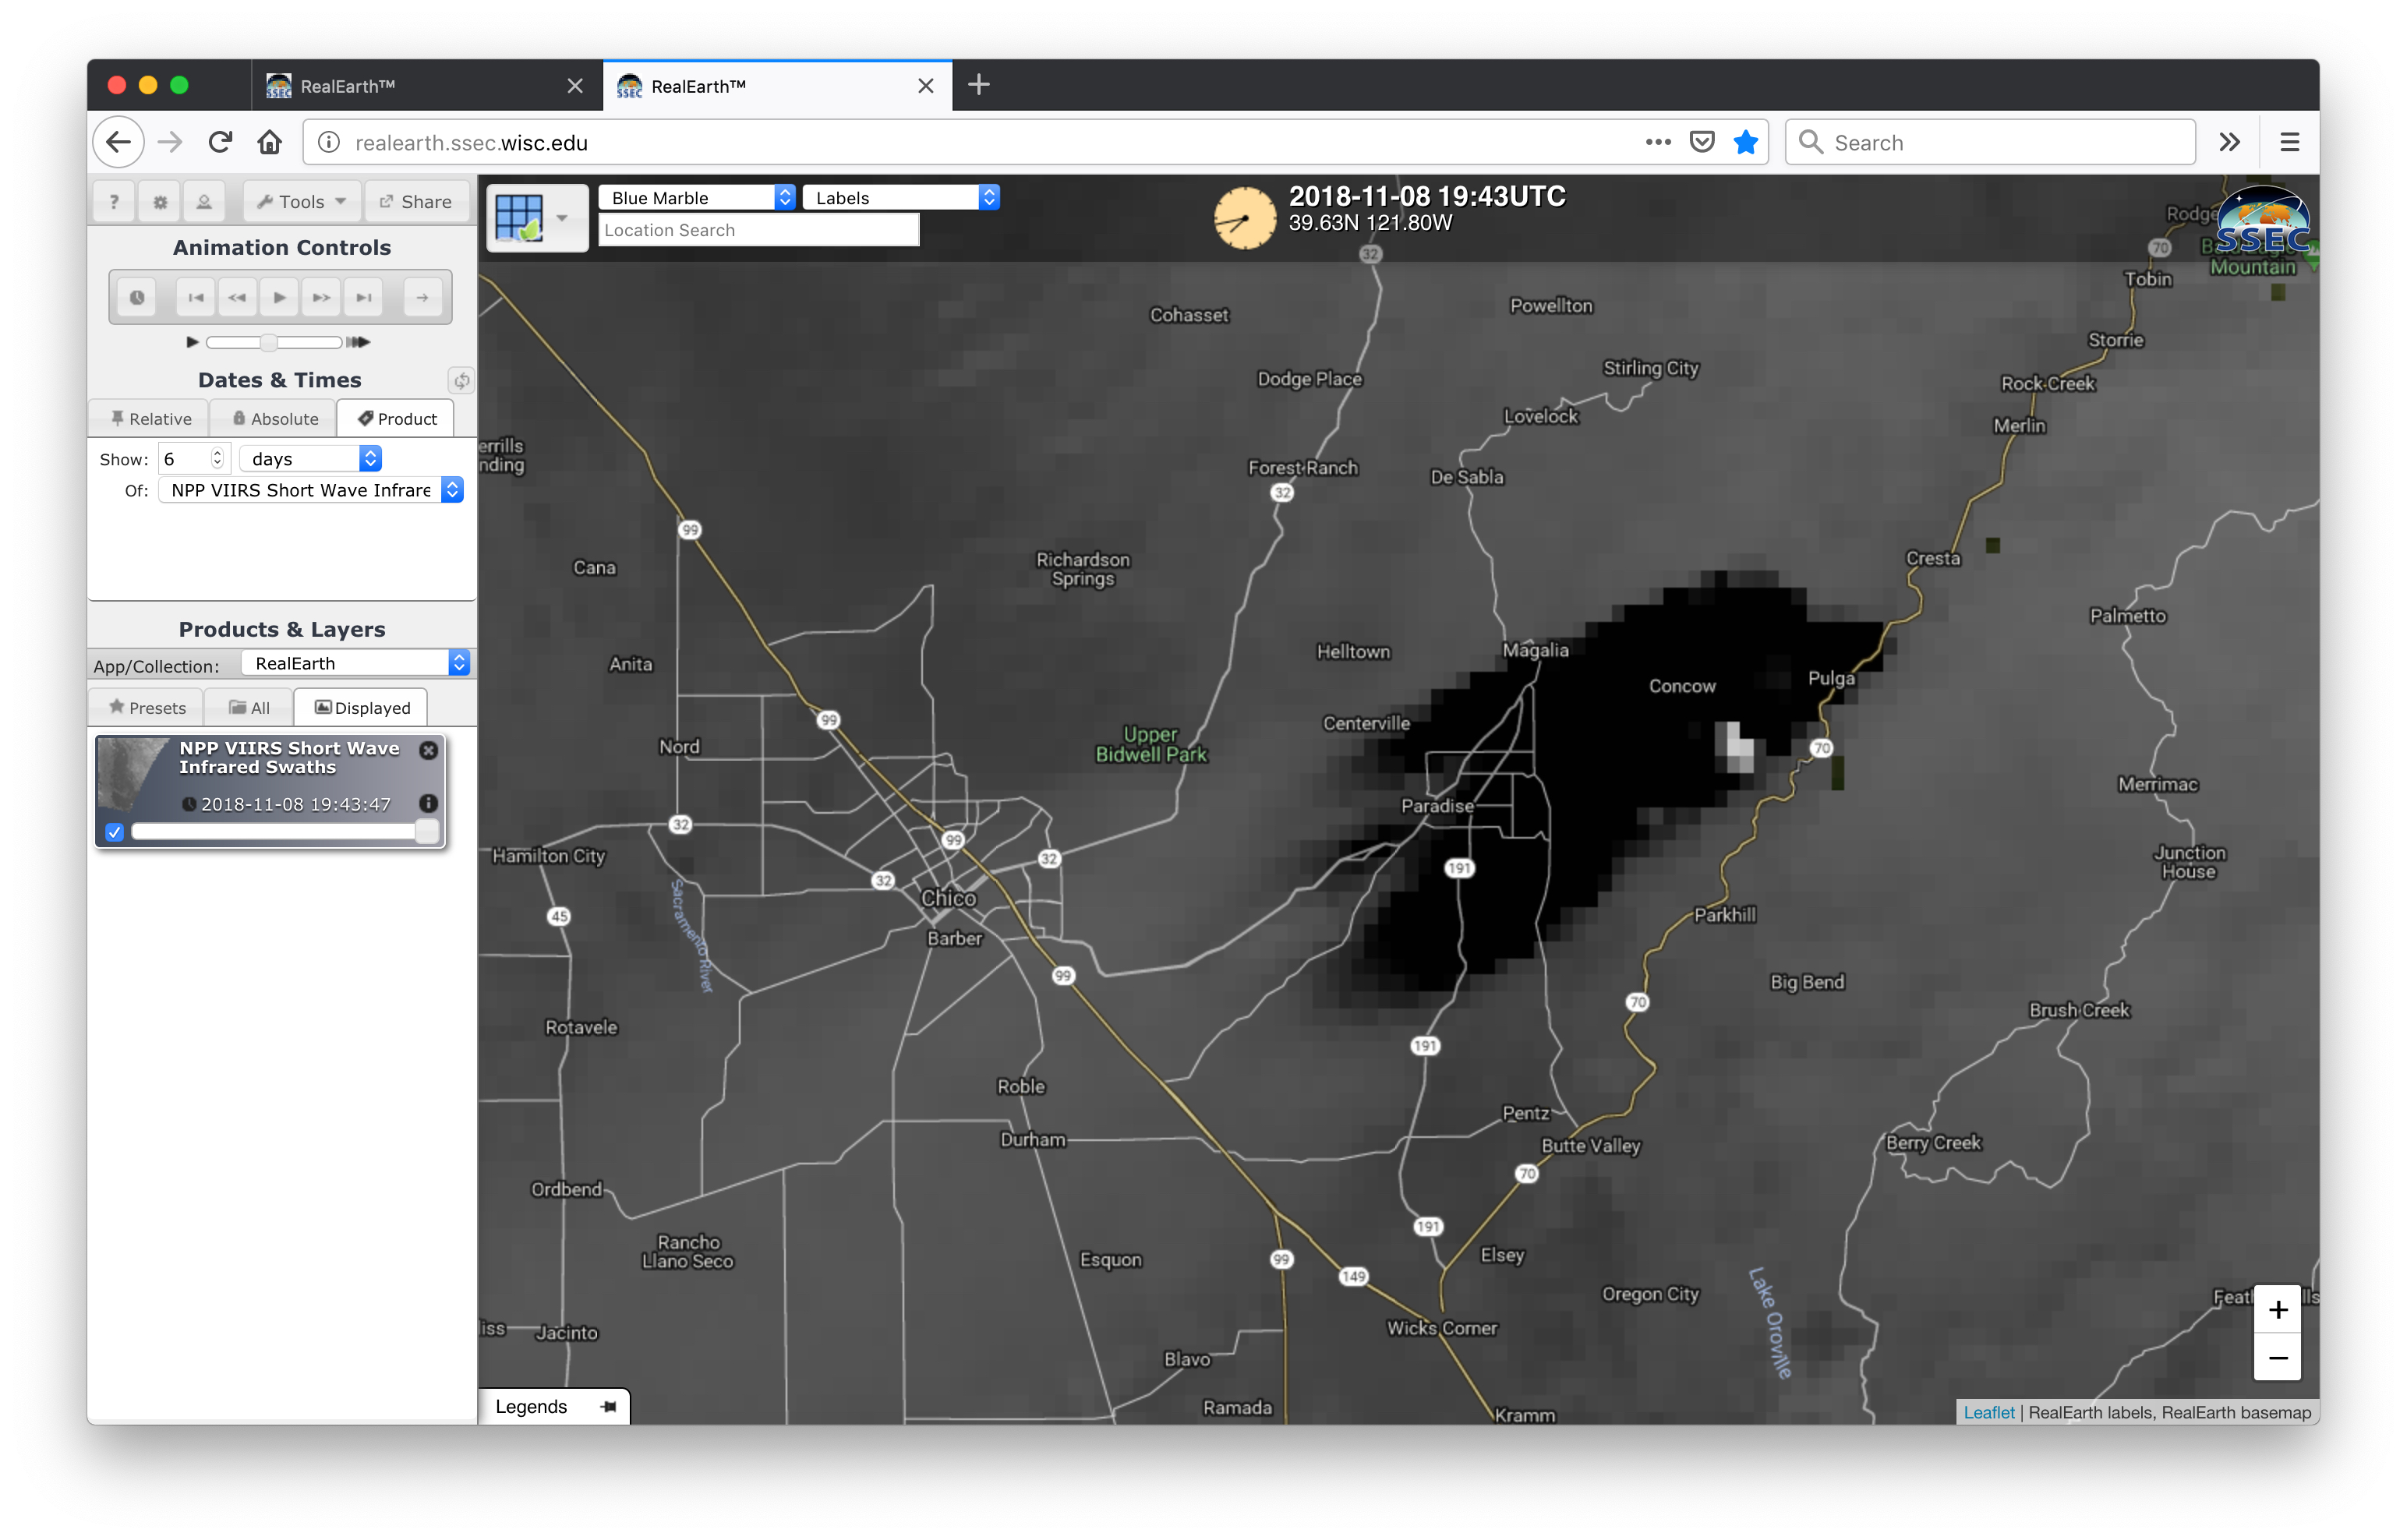
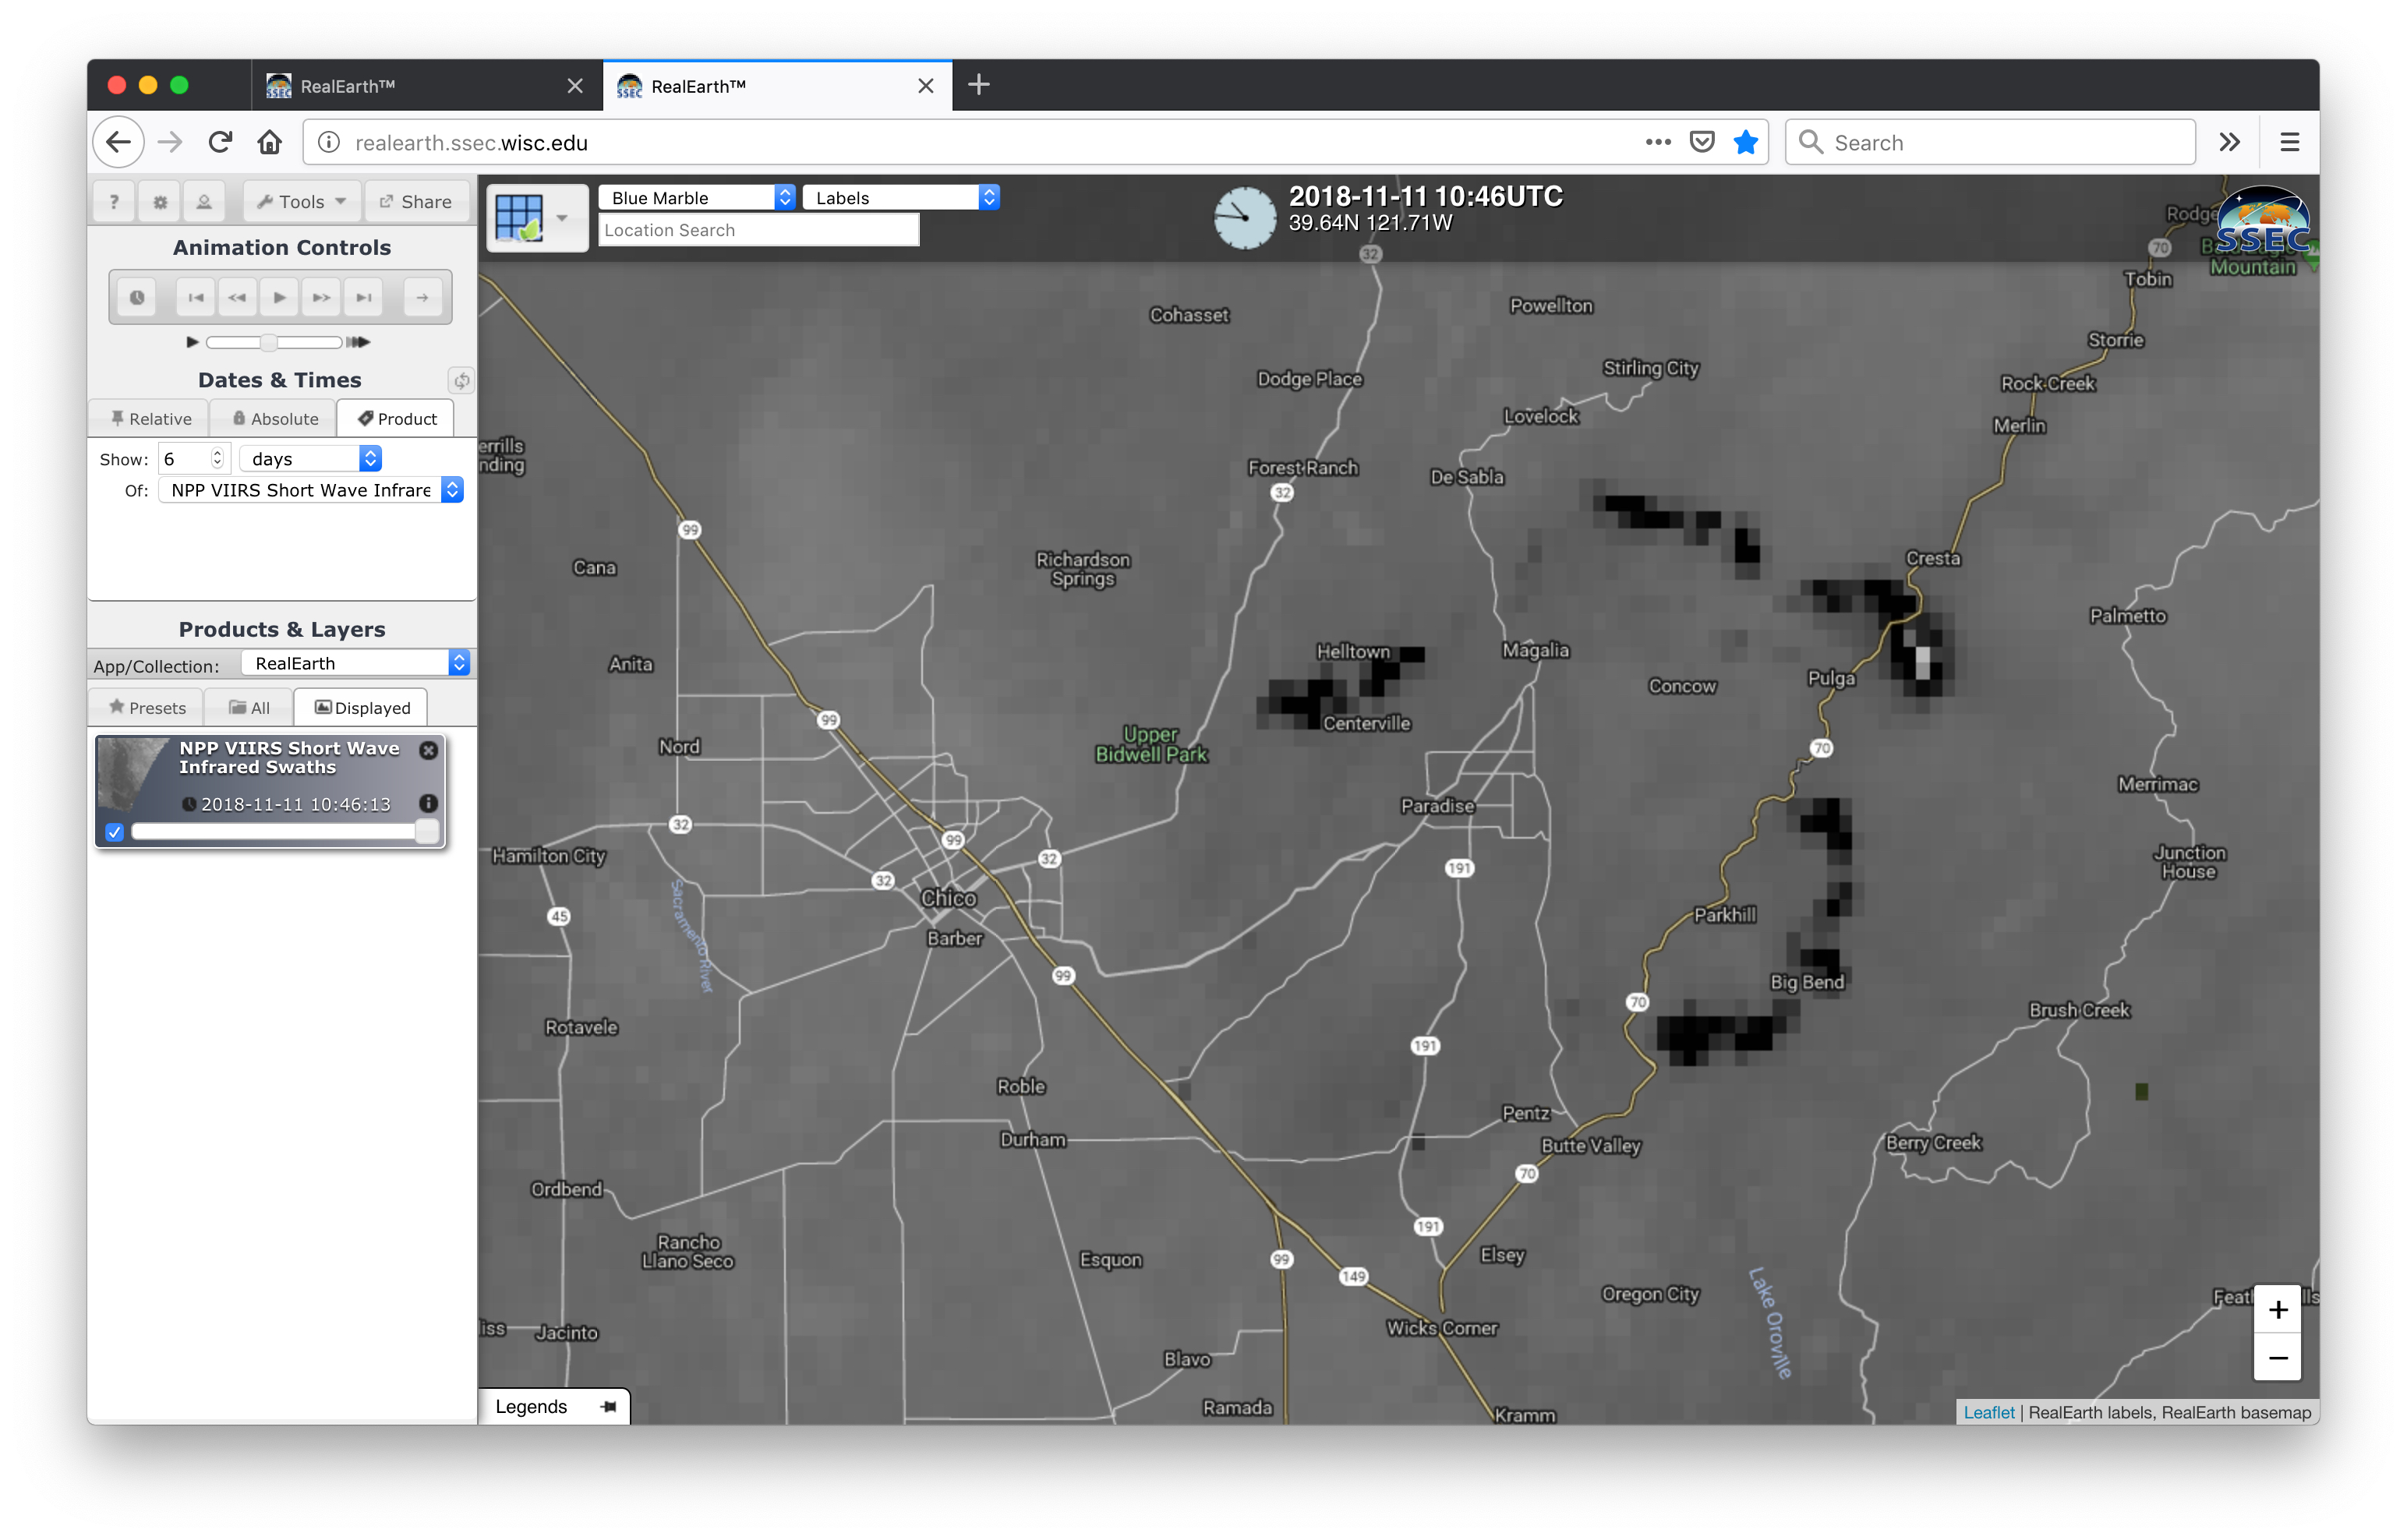
![Suomi NPP VIIRS Shortwave Infrared (3.74 µm) images [click to play animation]](https://cimss.ssec.wisc.edu/satellite-blog/wp-content/uploads/sites/5/2018/11/181108_181111_viirs_shortwaveInfrared_Camp_Fire_CA_anim.gif)
Suomi NPP VIIRS Shortwave Infrared (3.74 µm) images [click to play animation]
1-minute GOES-16 Visible and Shortwave Infrared images (below) showed the development of new smoke plume and hot thermal signatures around the periphery of the ongoing Camp Fire during the day on 11 November. As of 1849 UTC (10:49 AM local time), the fire had burned 109,000 acres and was listed as 25% contained.
![GOES-16 “Red” Visible (0.64 µm, left) and Shortwave Infrared (3.9 µm, right) images [click to play MP4 animation]](https://cimss.ssec.wisc.edu/satellite-blog/wp-content/uploads/sites/5/2018/11/G16_VIS_SWIR_NORCAL_FIRES_11NOV2018_2018315_220125_GOES-16_0002PANELS.GIF)
GOES-16 “Red” Visible (0.64 µm, left) and Shortwave Infrared (3.9 µm, right) images [click to play MP4 animation]
![Suomi NPP VIIRS True Color RGB image at 2029 UTC [click to enlarge]](https://cimss.ssec.wisc.edu/satellite-blog/wp-content/uploads/sites/5/2018/11/181111_2029utc_suomiNPP_viirs_truecolor_NorCal.jpg)
Suomi NPP VIIRS True Color RGB image at 2029 UTC [click to enlarge]
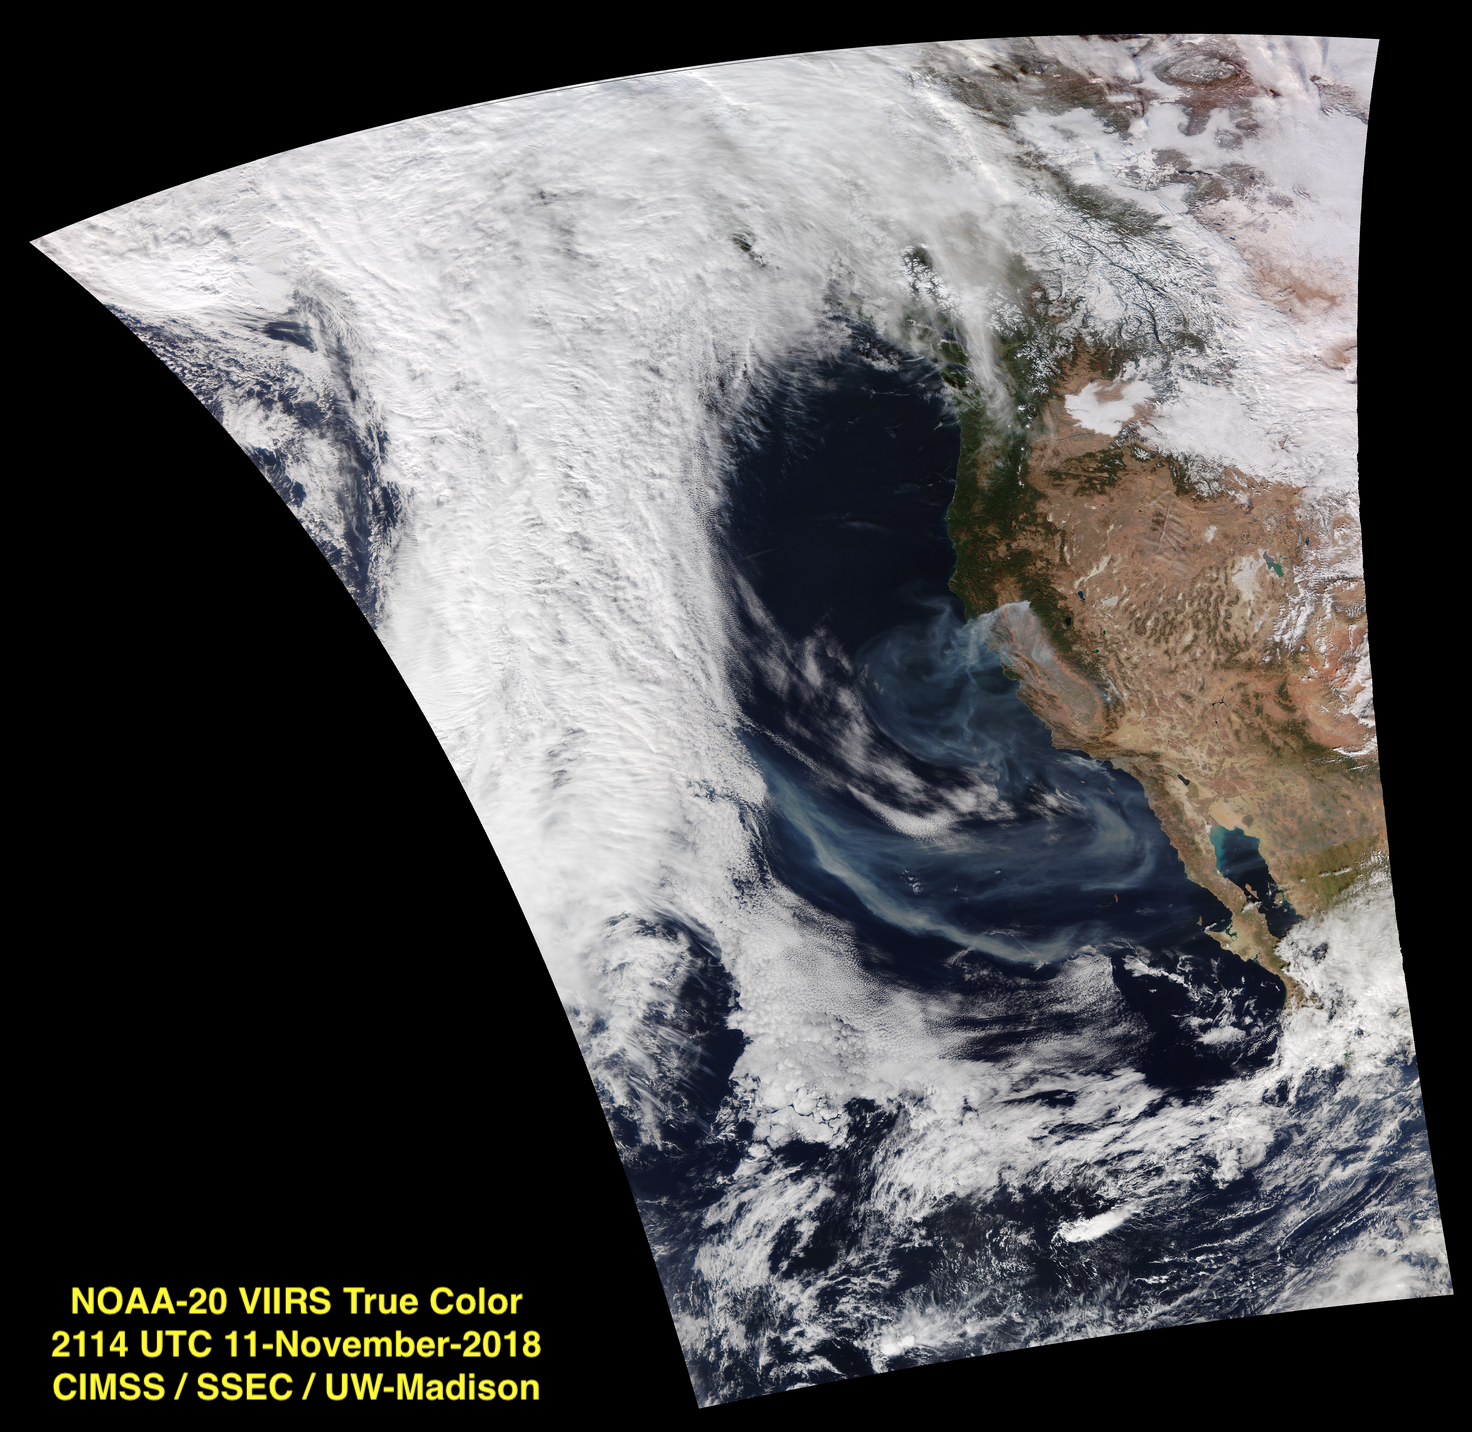
![NOAA-20 VIIRS True Color RGB image at 2114 UTC [click to enlarge]](https://cimss.ssec.wisc.edu/satellite-blog/wp-content/uploads/sites/5/2018/11/181111_2114utc_noaa20_viirs_truecolor_NorCal.jpg)
NOAA-20 VIIRS True Color RGB image at 2114 UTC [click to enlarge]
View only this post Read Less
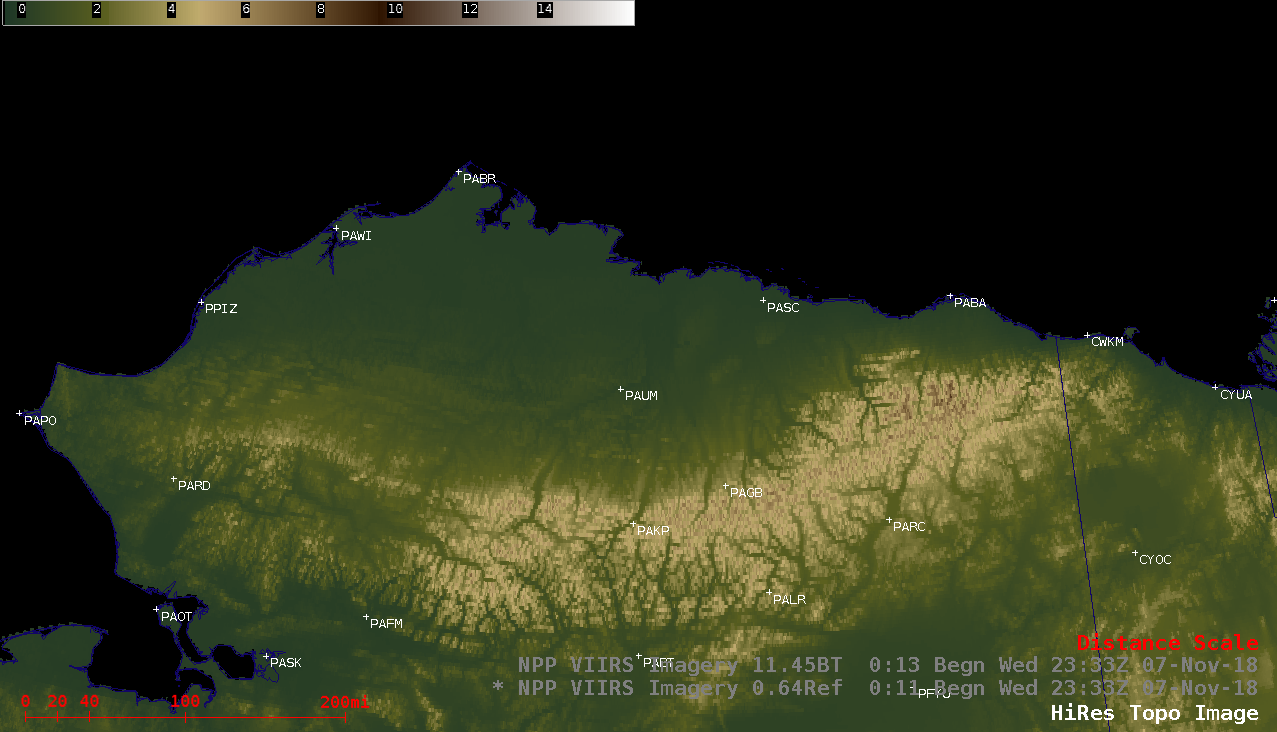
![Topography + Suomi NPP VIIRS Infrared Window (11.45 µm) images, with/without overlays of NAM12 250 hPa winds [click to play animation | MP4]](https://cimss.ssec.wisc.edu/satellite-blog/wp-content/uploads/sites/5/2018/11/181107_suomiNPP_viirs_infraredWindow_250winds_AK_banner_cloud_anim.gif)
![Suomi NPP VIIRS Shortwave Infrared (3.74 µm) and Infrared Window (11.45 µm) images [click to play animation | MP4]](https://cimss.ssec.wisc.edu/satellite-blog/wp-content/uploads/sites/5/2018/11/181107_suomiNPP_viirs_shortwaveInfrared_infraredWindow__AK_banner_cloud_anim.gif)
![GOES-15 Water Vapor (6.5 µm, top) and Infrared Window (10.7 µm, bottom) images [click to play animation | MP4]](https://cimss.ssec.wisc.edu/satellite-blog/wp-content/uploads/sites/5/2018/11/181107_goes15_waterVapor_infraredWindow_AK_banner_cloud_anim.gif)
![16-panel comparison of GOES-16 ABI spectral bands [click to play animation | MP4]](https://cimss.ssec.wisc.edu/satellite-blog/wp-content/uploads/sites/5/2018/11/181106_goes16_16panel_ND_vortex_anim.gif)

![Fog/sratus infrared Brightness Temperature Difference images from Terra/Aqua MODIS and NOAA-20/Suomi NPP VIIRS [click to enlarge | MP4]](https://cimss.ssec.wisc.edu/satellite-blog/wp-content/uploads/sites/5/2018/11/181106_modis_viirs_fogBTD_ND_vortex_anim.gif)
![GOES-16 Split Cloud Top Phase (11.2 - 8.4 µm) product [click to play animation | MP4]](https://cimss.ssec.wisc.edu/satellite-blog/wp-content/uploads/sites/5/2018/11/181106_goes16_split_phase_ND_anim.gif)
![GOES-16 Cloud Particle Size Distribution product [click to play animation | MP4]](https://cimss.ssec.wisc.edu/satellite-blog/wp-content/uploads/sites/5/2018/11/181106_goes16_cloud_particle_size_distribution_ND_anim.gif)
![GOES-16 Cloud Top Phase product [click to play animation | MP4]](https://cimss.ssec.wisc.edu/satellite-blog/wp-content/uploads/sites/5/2018/11/181106_goes16_cloud_top_phase_ND_anim.gif)
![GOES-16 Cloud Top Height product [click to play animation | MP4]](https://cimss.ssec.wisc.edu/satellite-blog/wp-content/uploads/sites/5/2018/11/181106_goes16_cloud_top_height_ND_anim.gif)
![Terra and Aqua MODIS Visible (0.65 µm), Cirrus (1.37 µm), Snow/Ice (1.61 µm) and Infrared Window (11.0 µm) at 1816 UTC and 1955 UTC [click to enlarge | MP4]](https://cimss.ssec.wisc.edu/satellite-blog/wp-content/uploads/sites/5/2018/11/181106_modis_visible_cirrus_snowIce_infraredWindow_ND_anim.gif)
![Suomi NPP VIIRS Visible (0.64 µm), Snow/Ice (1.61 µm) and Infrared Window (11.45 µm) images at 1841 UTC, 1941 UTC and 2020 UTC [click to enlarge | MP4]](https://cimss.ssec.wisc.edu/satellite-blog/wp-content/uploads/sites/5/2018/11/181106_viirs_visible_snowIce_infraredWindow_ND_anim.gif)
![True Color and False Color RGB images from Terra/Aqua MODIS and Suomi NPP VIIRS [click to play animation]](https://cimss.ssec.wisc.edu/satellite-blog/wp-content/uploads/sites/5/2018/11/181106_modis_viirs_truecolor_falsecolor_ND_vortex_anim.gif)
![Terra MODIS Visible (0.65 µm) image with aurface analysis of pressure and fronts [click to enlarge]](https://cimss.ssec.wisc.edu/satellite-blog/wp-content/uploads/sites/5/2018/11/nd_modis_vis_front-20181106_181600.png)
![GOES-16 Split Cloud Top Phase (11.2 - 8.4 µm) product at 1202 and 1802 UTC, with overlays of NAM12 700 hPa vorticity [click to enlarge]](https://cimss.ssec.wisc.edu/satellite-blog/wp-content/uploads/sites/5/2018/11/181106_goes16_cloud_top_phase_700hPa_vorticity_ND_anim.gif)
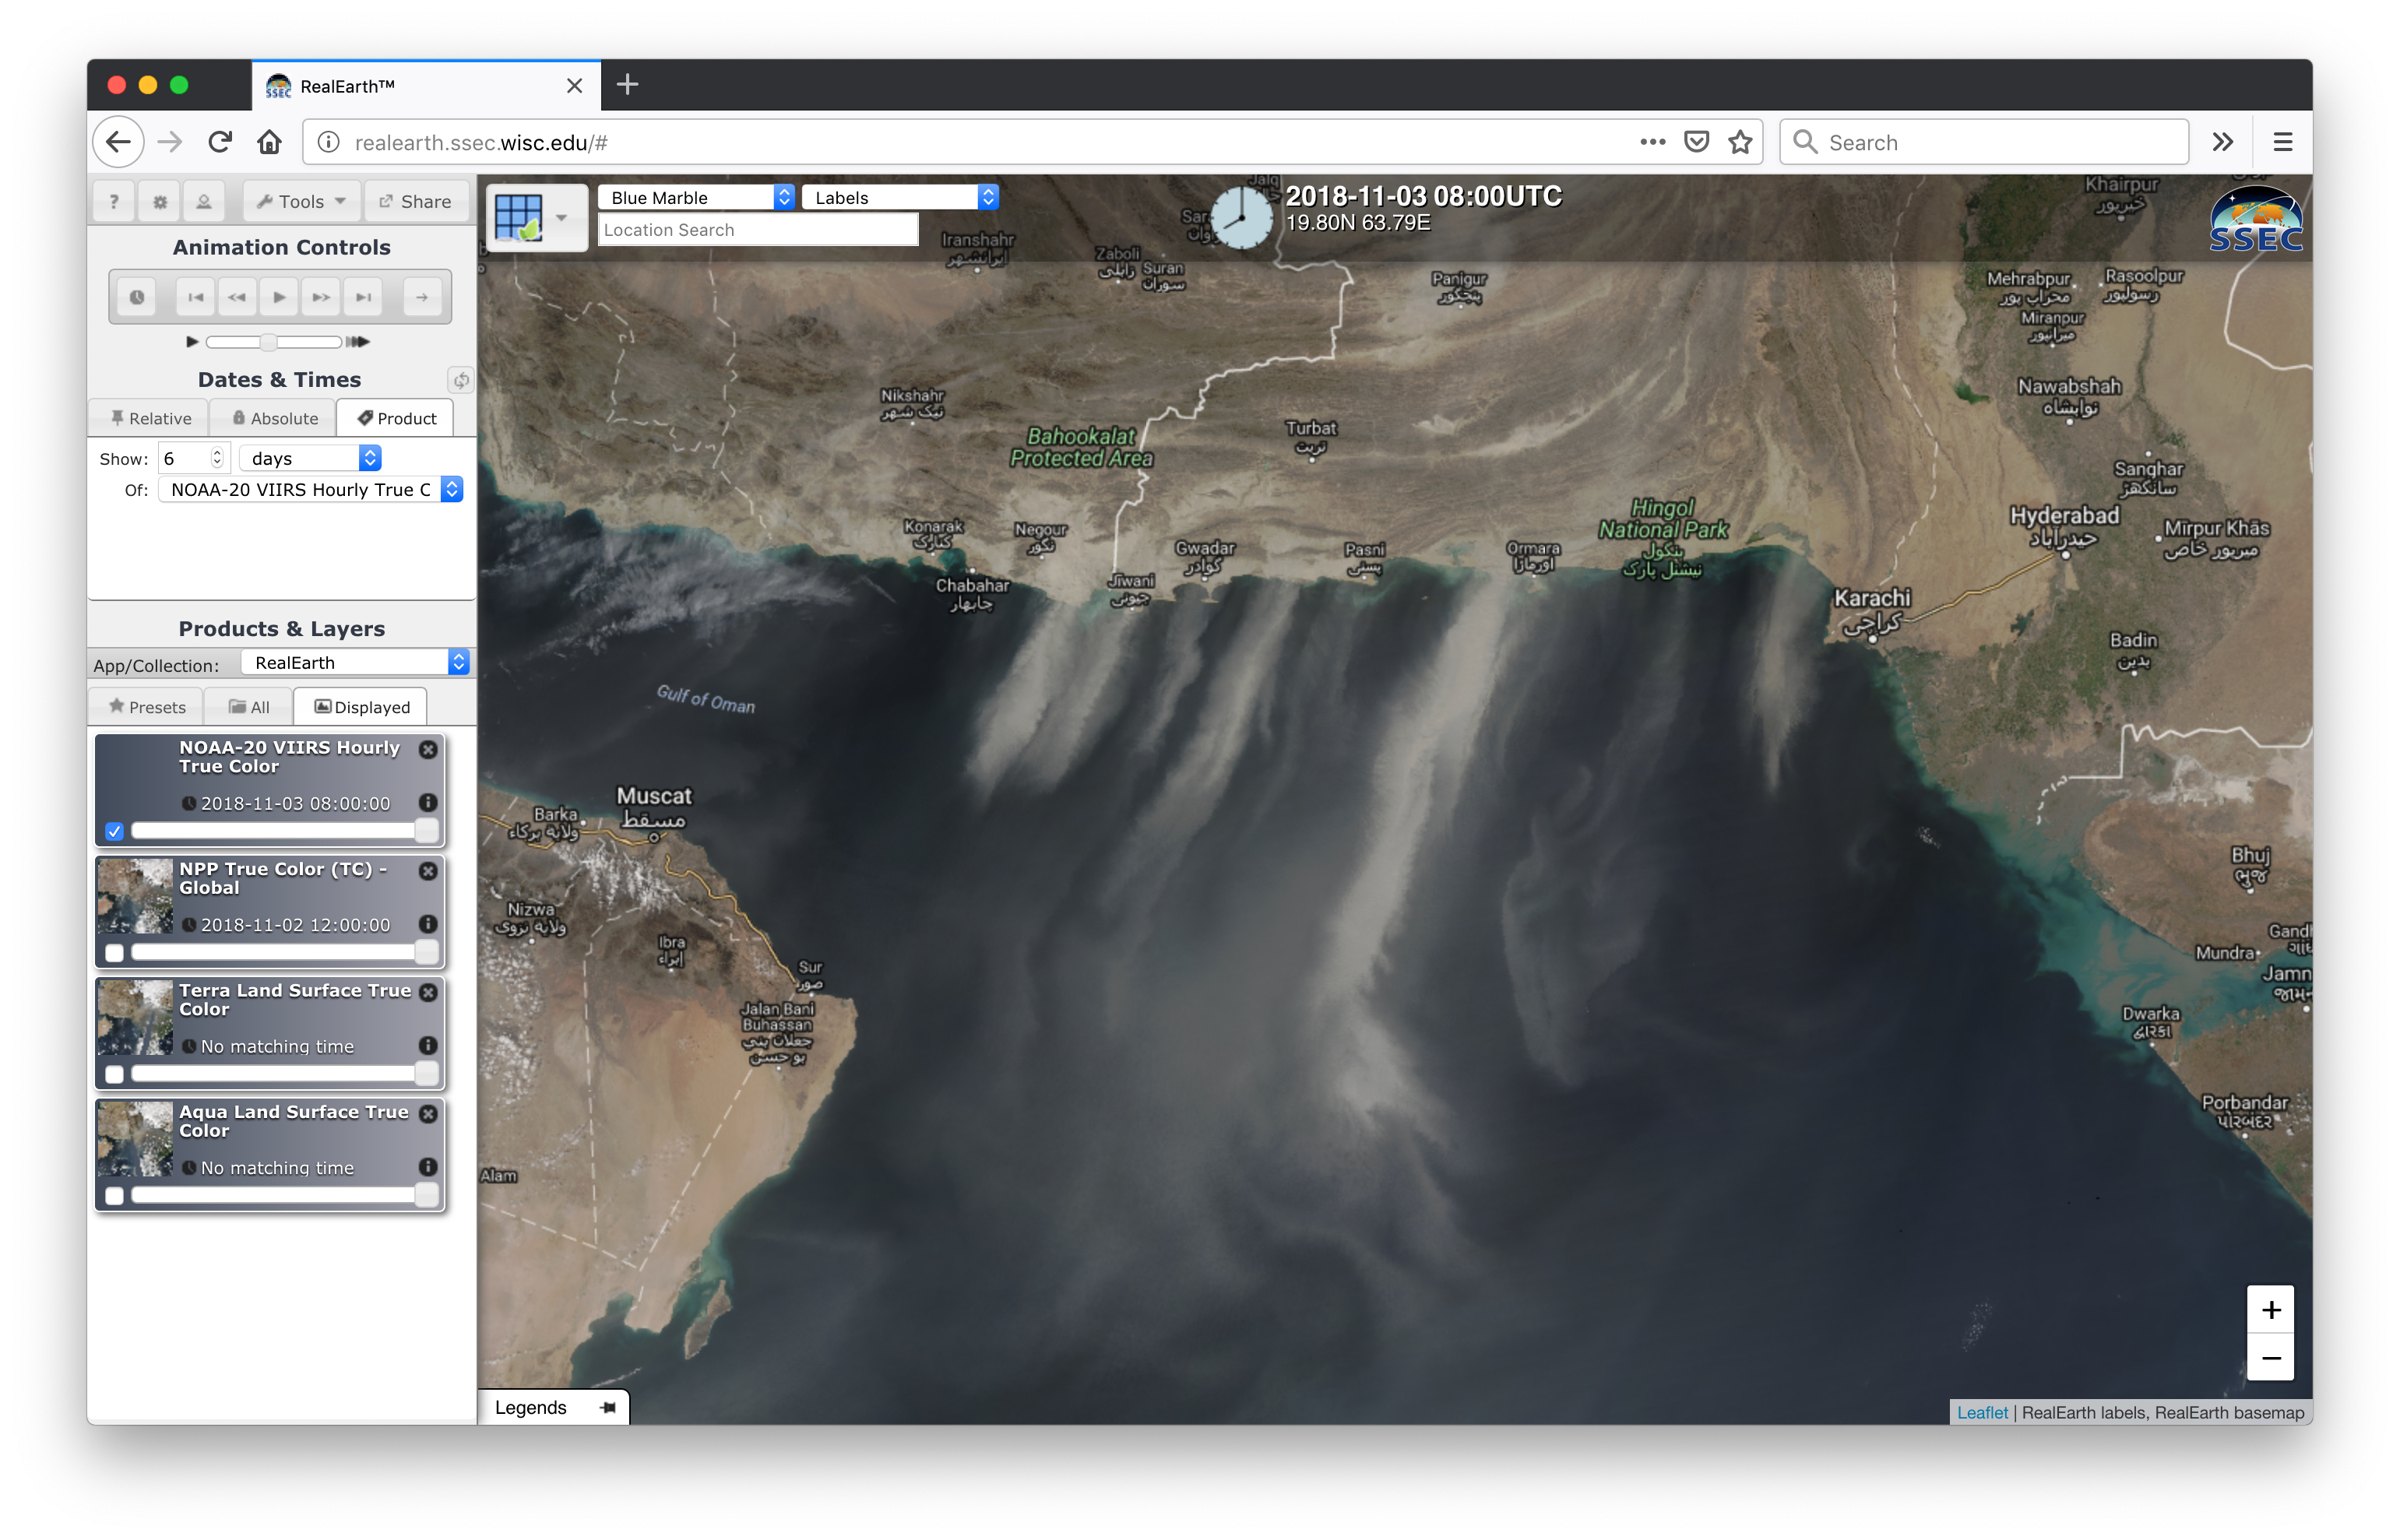
![Sequence of daily True Color RGB images from Terra MODIS, Aqua MODIS and Suomi NPP VIIRS, covering the period 01-03 November [click to play animation]](https://cimss.ssec.wisc.edu/satellite-blog/wp-content/uploads/sites/5/2018/11/181101_181103_terra_aqua_modis_suomiNPP_viirs_Arabian_Sea_dust_anim.gif)
![Comparison of True Color RGB images from Terra MODIS, NOAA-20 VIIRS, Suomi NPP VIIRS and Aqua MODIS on 03 November [click to play animation]](https://cimss.ssec.wisc.edu/satellite-blog/wp-content/uploads/sites/5/2018/11/181103_modis_viirs_Arabian_Sea_dust_anim.gif)
![Meop ASCAT surface scatteromete winds [click to enlarge]](https://cimss.ssec.wisc.edu/satellite-blog/wp-content/uploads/sites/5/2018/11/181103_ascat_Arabian_Sea_anim.gif)
![Meteosat-11 Visible (0.8 µm) images [click to play animation | MP4]](https://cimss.ssec.wisc.edu/satellite-blog/wp-content/uploads/sites/5/2018/11/181102_meteosat11_visible_Arabian_Sea_dust_anim.gif)
![Meteosat-11 Visible (0.8 µm) images on 03 November [click to play animation | MP4]](https://cimss.ssec.wisc.edu/satellite-blog/wp-content/uploads/sites/5/2018/11/181103_meteosat11_visible_Arabian_Sea_dust_anim.gif)
