This website works best with a newer web browser such as Chrome, Firefox, Safari or Microsoft Edge. Internet Explorer is not supported by this website.

Eruption of Mount Veniaminof on the Alaska Peninsula

* GOES-17 images posted here are preliminary and non-operational * Following an eruption of Mount Veniaminof on 21 November 2018, 1-minute Mesoscale Domain Sector GOES-17 “Red” Visible (0.64 µm) and Split Window Difference (10.3-12.3 µm) images (above) showed the volcanic ash plume drifting southeastward over the Gulf of Alaska. During the period 1947-2323 UTC the... Read More

GOES-17

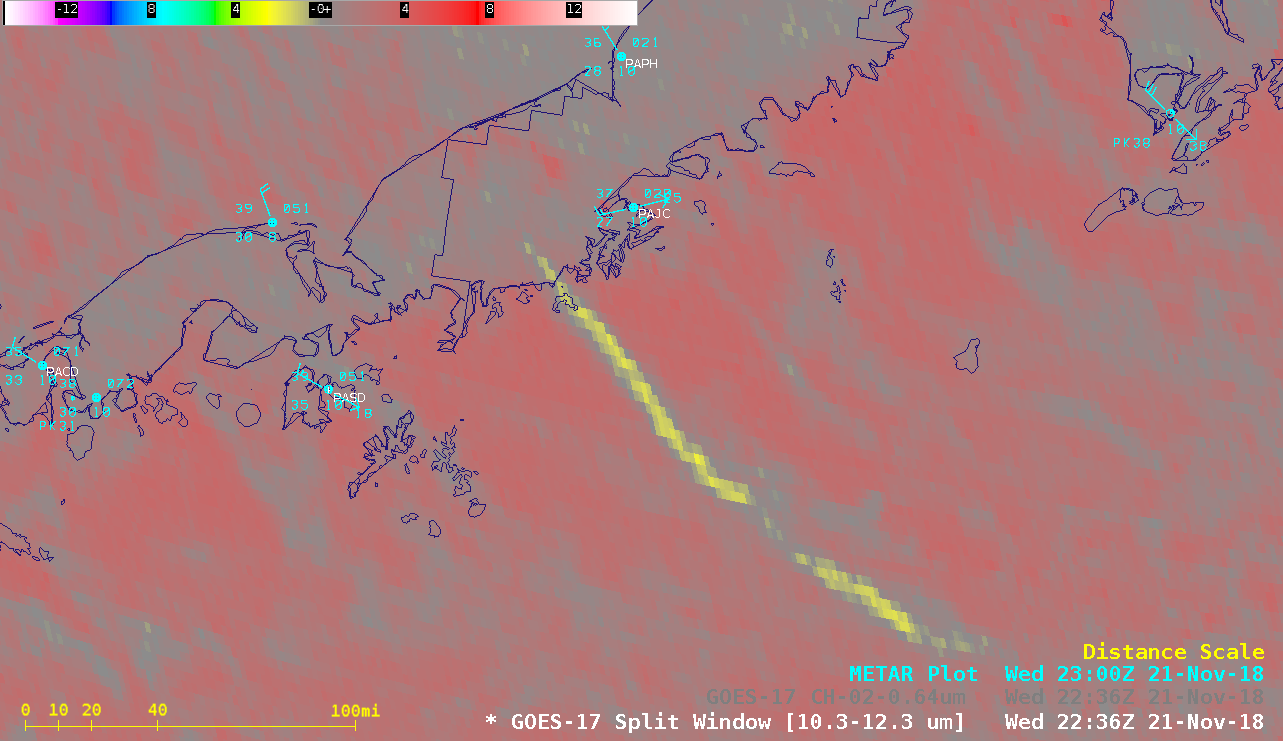
GOES-17 “Red” Visible (0.64 µm) and Split Window Difference (10.3-12.3 µm) images [click to play MP4 animation]

* GOES-17 images posted here are preliminary and non-operational *

Following an eruption of Mount Veniaminof on 21 November 2018, 1-minute Mesoscale Domain Sector GOES-17 “Red” Visible (0.64 µm) and Split Window Difference (10.3-12.3 µm) images (above) showed the volcanic ash plume drifting southeastward over the Gulf of Alaska. During the period 1947-2323 UTC the plume was seen to grow to a length of 200 miles from the volcano summit. Note in the Visible imagery that the 2625 ft (800 m) volcano acted as a barrier to the northwesterly boundary layer winds to create a cloud-free “notch” immediately downwind of Veniaminof.

NOAA-20 VIIRS True Color RGB images viewed using RealEarth (below) highlighted the light brown color of the ash plume.

NOAA-20 VIIRS True Color RGB images [click to enlarge]

NOAA-20 VIIRS True Color RGB images [click to enlarge]

A sequence of retrieved Ash Probability, Ash Height and Ash Loading (source) derived from Terra/Aqua MODIS and Suomi NPP VIIRS data (below) indicated high probabilities of ash content, height values primarily in the 4-6 km range and ash loading exceeding 4 g/m3 at times.

Terra/Aqua MODIS and Suomi NPP VIIRS Ash Probability, Ash Height and Ash Loading images [click to play animation | MP4]

Terra/Aqua MODIS and Suomi NPP VIIRS Ash Probability, Ash Height and Ash Loading images [click to play animation | MP4]


View only this post Read Less

Water Vapor imagery sensing the surface of Hawai’i

* GOES-17 images shown here are preliminary and non-operational *GOES-17 Low-level (7.3 µm), Mid-level (6.9 µm) and Upper-level (6.2 µm) Water Vapor images (above) revealed the diurnal cycle of warming and cooling of the summits of Mauna Kea and Mauna Loa on the Big Island of Hawai’i on 21 November 2018. There was even a... Read More

GOES-17 Low-level (7.3 µm, left), Mid-level (6.9 µm, center) and Upper-level (6.2 µm, right) Water Vapor images [click to play animation | MP4]

GOES-17 Low-level (7.3 µm, left), Mid-level (6.9 µm, center) and Upper-level (6.2 µm, right) Water Vapor images [click to play animation | MP4]

* GOES-17 images shown here are preliminary and non-operational *

GOES-17 Low-level (7.3 µm), Mid-level (6.9 µm) and Upper-level (6.2 µm) Water Vapor images (above) revealed the diurnal cycle of warming and cooling of the summits of Mauna Kea and Mauna Loa on the Big Island of Hawai’i on 21 November 2018. There was even a subtle warming signature of the higher terrain of Maui on 7.3 µm and 6.9 µm imagery. This example helps to underscore the fact that Water Vapor bands are Infrared bands, which — in the absence of clouds — essentially sense the mean temperature of a layer (or layers) of moisture within the troposphere.

The presence of very dry air within the middle/upper troposphere over Hawai’i on 21 November had the effect of shifting the water vapor weighting functions to lower altitudes, as seen on plots for the 3 ABI Water Vapor bands calculated using 00 UTC rawinsonde data from Hilo PHTO (below). This allowed thermal radiation from the higher terrain to pass upward (un-attenuated) through what little high-altitude moisture was present and reach the 7.3 µm / 6.9 µm / 6.2 µm detectors on GOES-17.

Plots of weighting functions for the 3 ABI Water Vapor bands, calculated from 00 UTC rawinsonde data from Hilo PHTO [click to enlarge]

Plots of weighting functions for the 3 ABI Water Vapor bands, calculated using 00 UTC rawinsonde data from Hilo [click to enlarge]

Compare the altitudes and depths of Hilo water vapor weighting function plots on 19 November vs. 22 November (below). Increased moisture within the middle troposphere on 19 November shifted the water vapor weighting function plots for the 7.3 µm and 6.9 µm bands to higher altitudes (and increased the magnitude of the high-altitude contributions for the 6.9 µm and 6.2 µm bands).

Plots of Hilo Water Vapor weighting functions, 19 November vs 22 November at 00 UTC [click to enlarge]

Plots of Hilo water vapor weighting functions, 19 November vs 22 November at 00 UTC [click to enlarge]

View only this post Read Less

Increasing ice concentration in Hudson Bay

After increasingly colder air began moving from eastern Nunavut across Hudson Bay beginning on 06 November (surface analyses), the daily sea ice concentration as derived from GCOM-W1 AMSR2 data (source) began to increase in the northern half of Hudson Bay (above) — especially after 15 November once mid-day (18 UTC) temperatures colder... Read More

Sea ice concentration derived from AMSR2 data, 06-21 November [click to play animation | MP4]

Daily sea ice concentration derived from AMSR2 data, 06-21 November [click to play animation | MP4]

After increasingly colder air began moving from eastern Nunavut across Hudson Bay beginning on 06 November (surface analyses), the daily sea ice concentration as derived from GCOM-W1 AMSR2 data (source) began to increase in the northern half of Hudson Bay (above) — especially after 15 November once mid-day (18 UTC) temperatures colder than -20ºF were seen at reporting stations along the northwest coast.

A sequence of daily Terra/Aqua MODIS True Color Red-Green-Blue (RGB) images (source) showed signatures of the increasing of ice coverage.

Terra/Aqua MODIS True Color RGB images, 06-21 November [click to play animation | MP4]

Daily Terra/Aqua MODIS True Color RGB images, 06-21 November [click to play animation | MP4]

A toggle between Terra MODIS True Color and False Color RGB images on 21 November (below) confirmed that much of the northern half of Hudson Bay contained ice — snow/ice (as well as ice crystal clouds) appear as darker shades of red in the False Color image (in contrast to the cyan shades of supercooled water droplet clouds).

Terra MODIS True Color and False Color RGB images on 21 November [click to enlarge]

Terra MODIS True Color and False Color RGB images on 21 November [click to enlarge]

19 November maps of Ice Concentration, Ice Stage and Departure from Normal via the Canadian Ice Service (below) further characterized this ice formation, which was ahead of normal for the central portion of Hudson Bay.

Ice Concentration [click to enlarge]

Ice Concentration [click to enlarge]

Ice Stage [click to enlarge]

Ice Stage [click to enlarge]

Ice Concentration Departure [click to enlarge]

Ice Concentration Departure [click to enlarge]

View only this post Read Less

Gale-force low in the Gulf of Alaska

* GOES-17 images shown here are preliminary and non-operational *GOES-17 Low-level (7.3 µm), Mid-level (6.9 µm) and Upper-level (6.2 µm) Water Vapor images (above) showed the circulation associated with an occluded gale-force low in the Gulf of Alaska (surface analyses) which moved northward to a position just south of the Kenai Peninsula on 19 November... Read More

GOES-17 Low-level (7.3 µm, left), Mid-level (6.9 µm, center) and Upper-level (6.2 µm, right) Water Vapor images [click to play animation | MP4]

GOES-17 Low-level (7.3 µm, left), Mid-level (6.9 µm, center) and Upper-level (6.2 µm, right) Water Vapor images [click to play animation | MP4]

* GOES-17 images shown here are preliminary and non-operational *

GOES-17 Low-level (7.3 µm), Mid-level (6.9 µm) and Upper-level (6.2 µm) Water Vapor images (above) showed the circulation associated with an occluded gale-force low in the Gulf of Alaska (surface analyses) which moved northward to a position just south of the Kenai Peninsula on 19 November 2018.

The 3 GOES-17 ABI Water Vapor bands sample radiation from different layers within the troposphere — the height and depth of these individual layers varies with changes in (1) the temperature/moisture profile of the atmosphere and (2) the satellite viewing angle (or zenith angle). The 3 water vapor weighting functions — calculated using 12 UTC rawinsonde data from Anchorage (PANC) — provide information on the height and depth of the radiating layers in the vicinity of the storm  (below).

GOES-17 Water Vapor weighting function plots for Anchorage, Alaska [click to enlarge]

GOES-17 Water Vapor weighting function plots for Anchorage, Alaska [click to enlarge]

View only this post Read Less