* GOES-17 images shown here are preliminary and non-operational *GOES-17 Low-level (7.3 µm), Mid-level (6.9 µm) and Upper-level (6.2 µm) Water Vapor images (above) revealed an interesting train of standing waves about 100-150 miles south of the Big Island of Hawai’i on 25 November 2018. With the presence of moisture aloft, the 3... Read More
![GOES-17 Low-level (7.3 µm), Mid-level (6.9 µm) and Upper-level (6.2 µm) Water Vapor images [click to play animation | MP4]](https://cimss.ssec.wisc.edu/satellite-blog/wp-content/uploads/sites/5/2018/11/hi_wv9-20181125_230218.png)
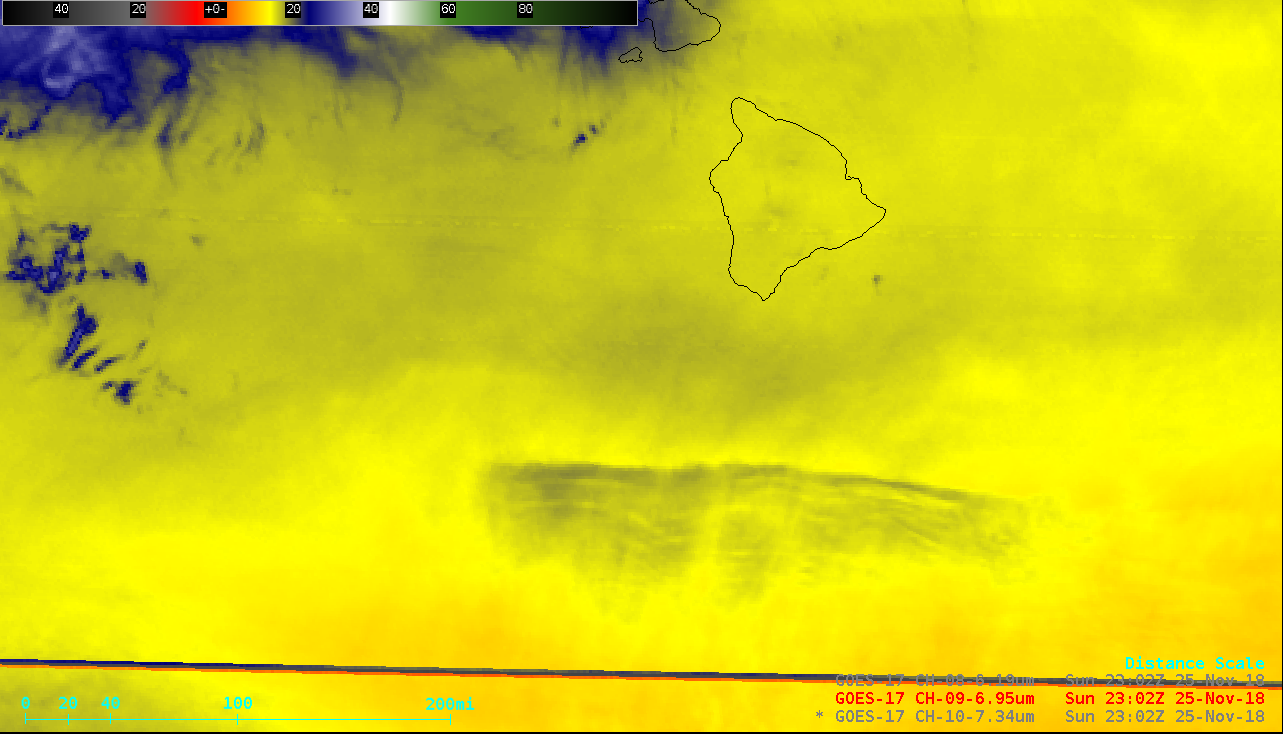
GOES-17 Low-level (7.3 µm), Mid-level (6.9 µm) and Upper-level (6.2 µm) Water Vapor images [click to play animation | MP4]
* GOES-17 images shown here are preliminary and non-operational *
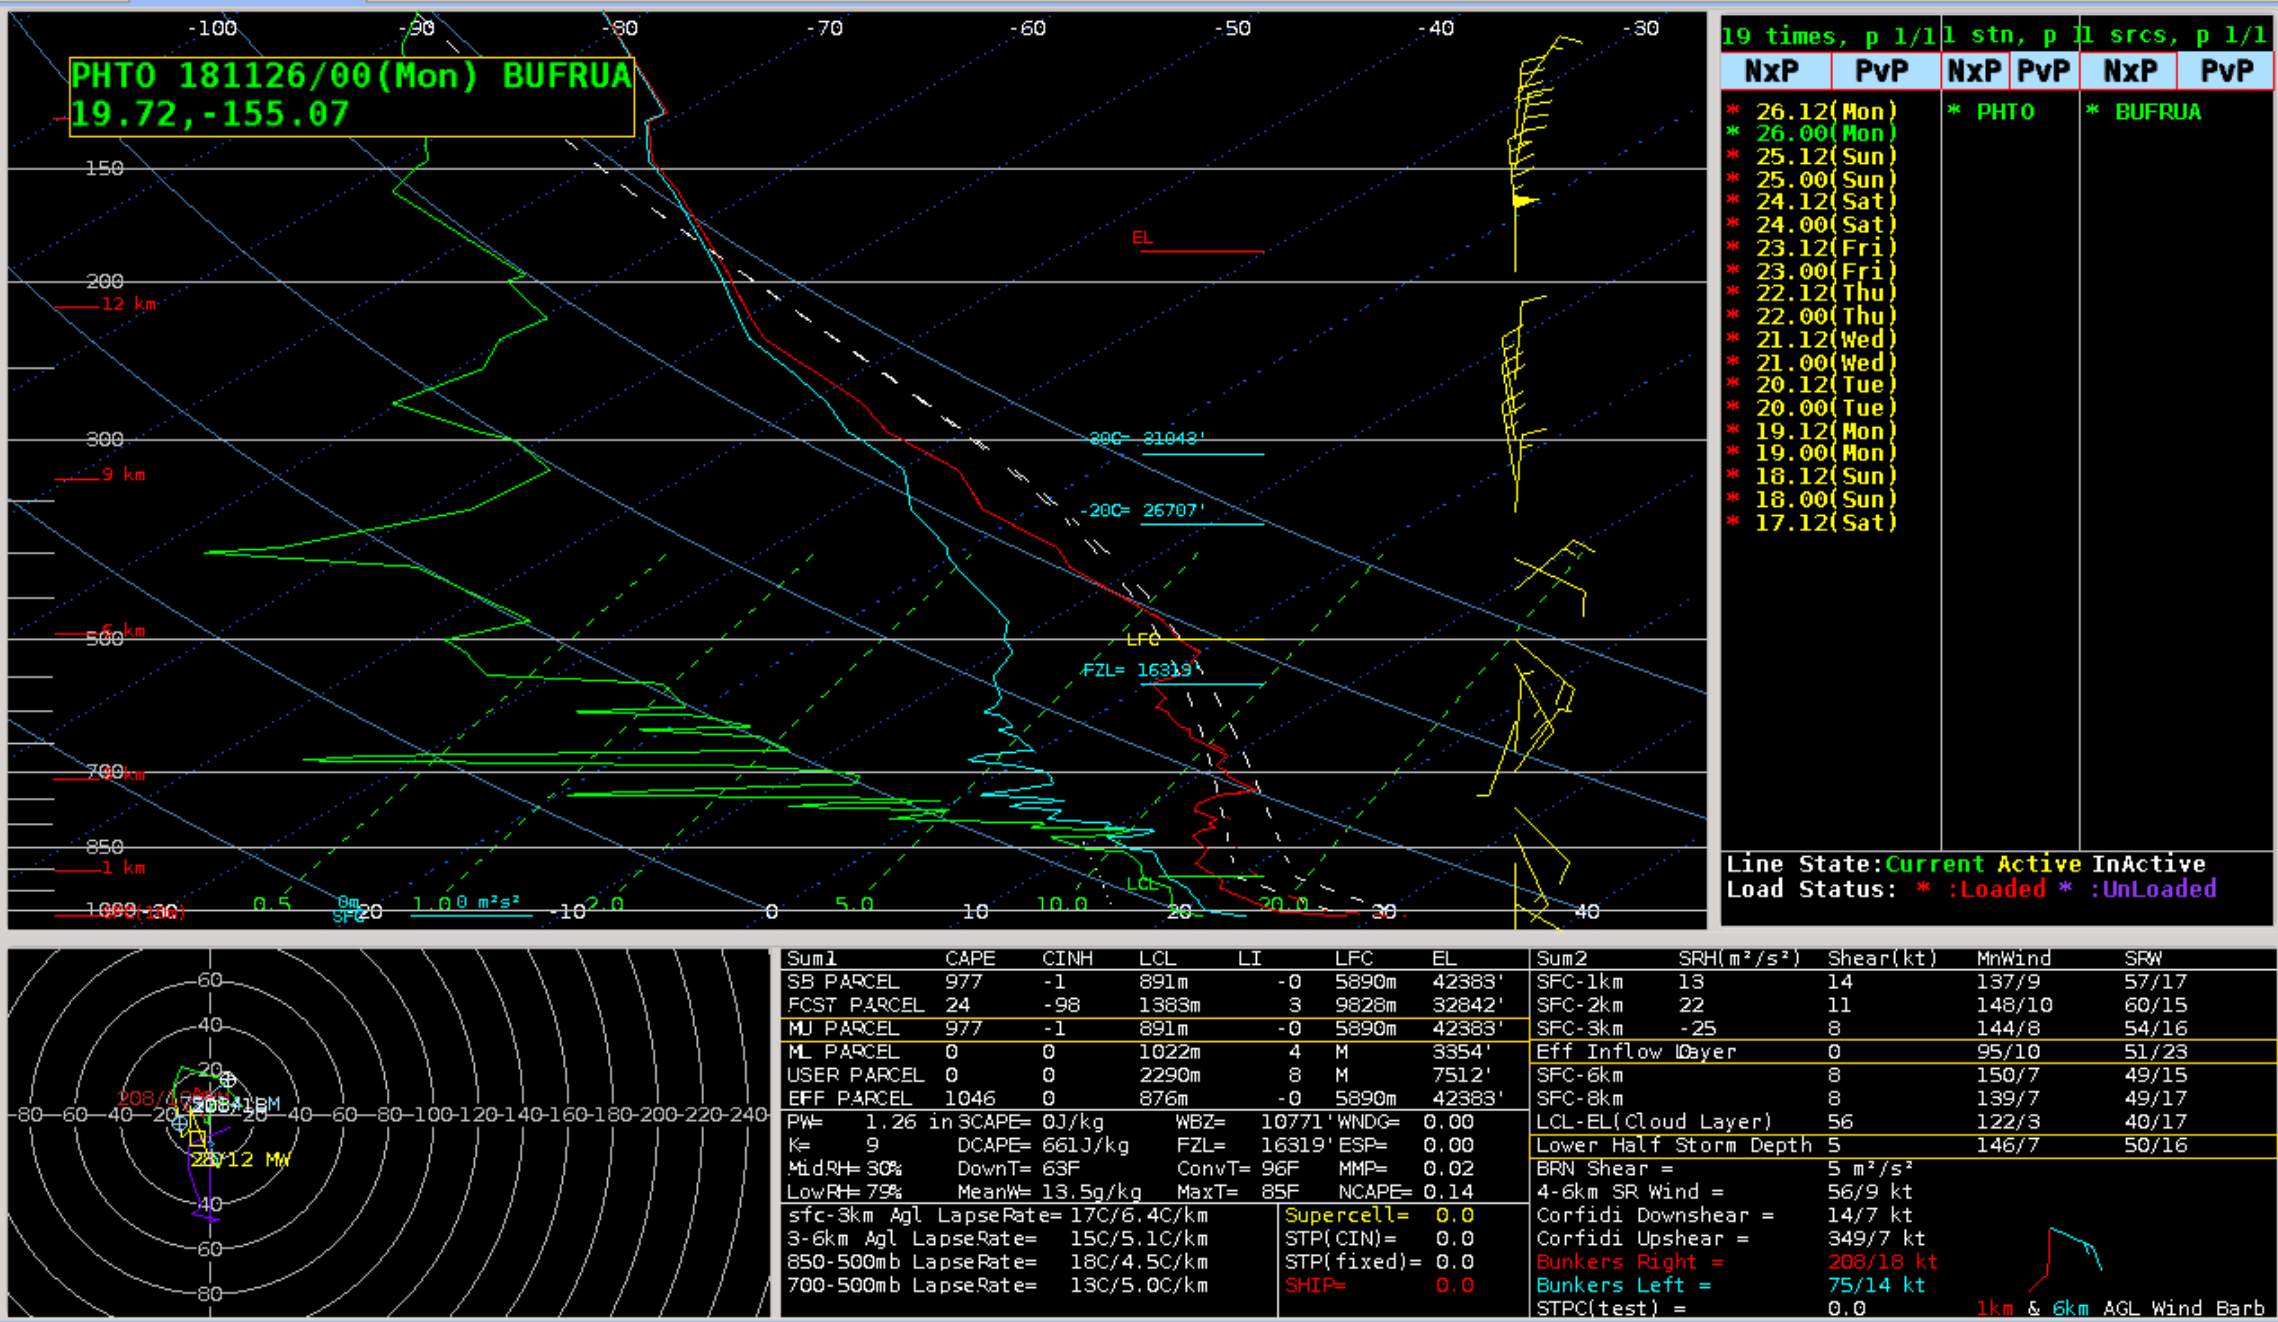
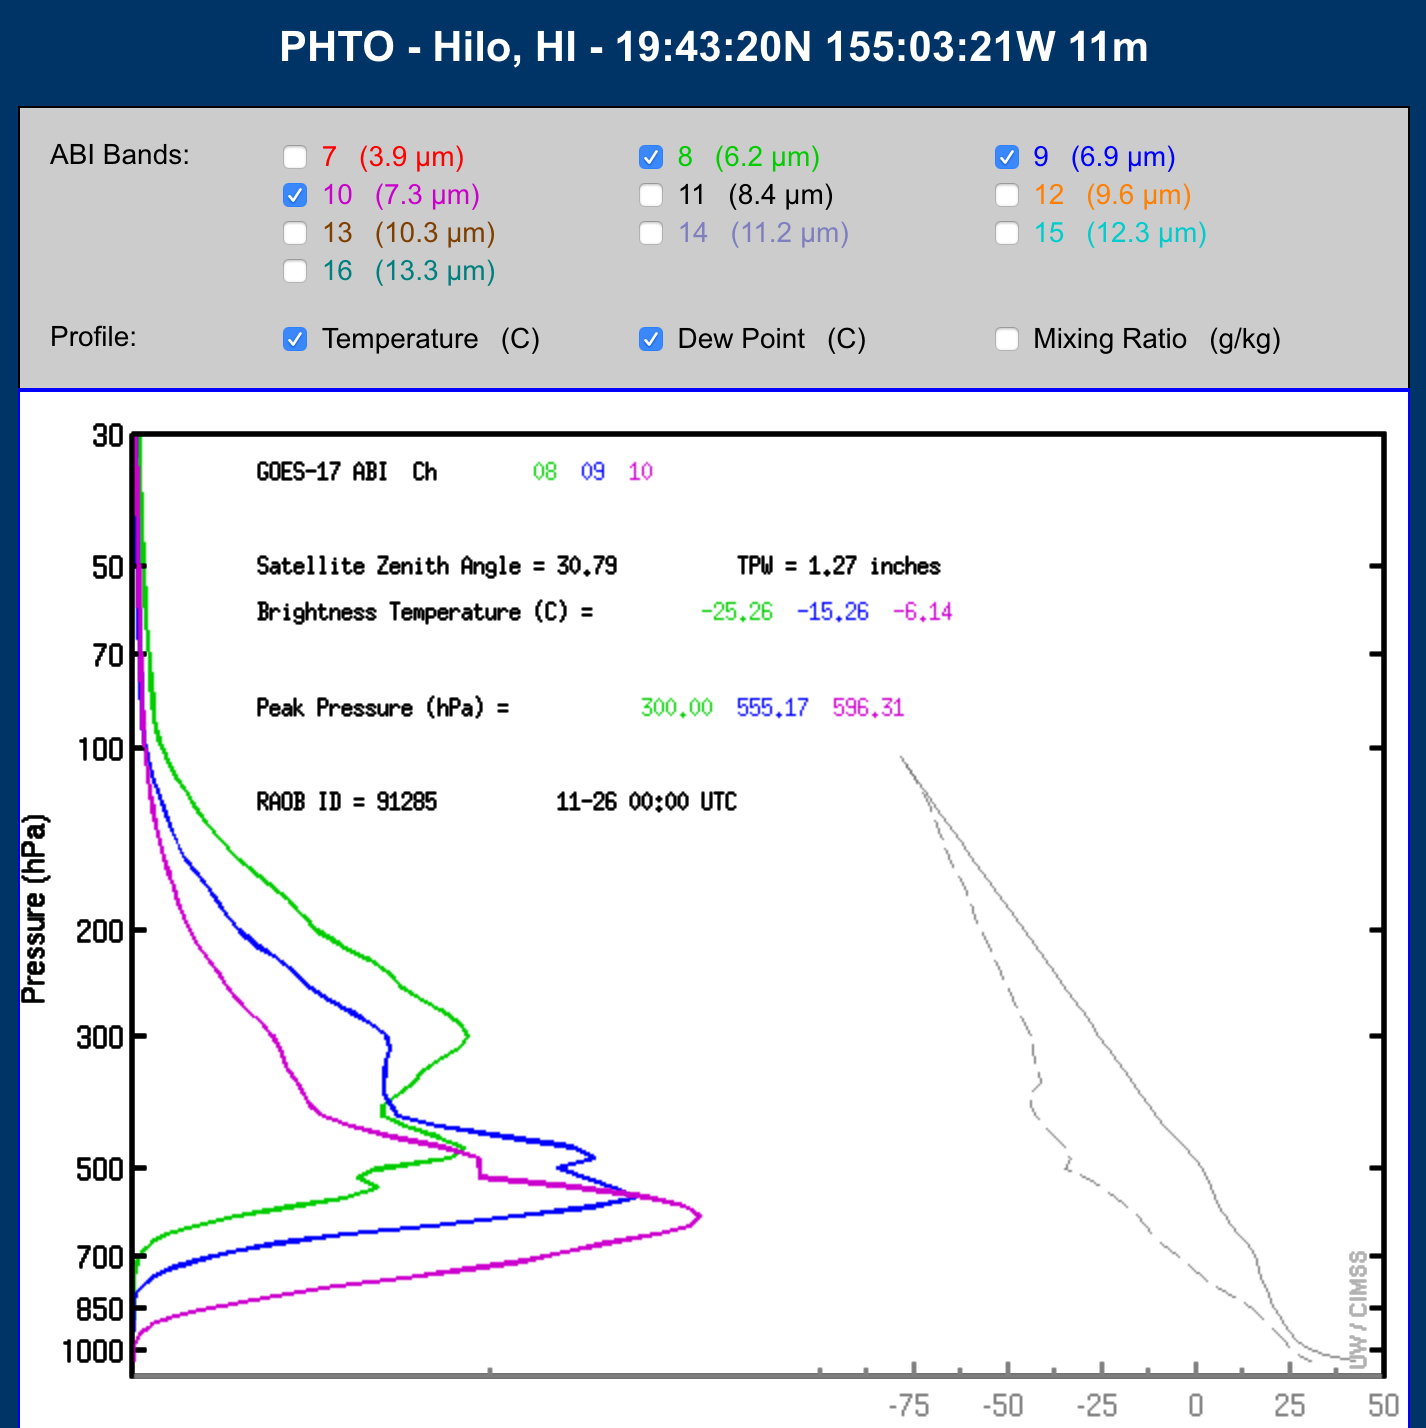
GOES-17 Low-level (7.3 µm), Mid-level (6.9 µm) and Upper-level (6.2 µm) Water Vapor images (above) revealed an interesting train of standing waves about 100-150 miles south of the Big Island of Hawai’i on 25 November 2018. With the presence of moisture aloft, the 3 water vapor weighting functions — calculated using the 00 UTC Hilo sounding — were shifted to high enough altitudes to eliminate the sensing of radiation from features in the lower troposphere. There were no pilot reports of turbulence in the vicinity of these standing waves — but they were located outside of the primary commercial air traffic corridors to/from the islands.
GOES-17 “Clean” Infrared Window (10.3 µm) and Near-Infrared “Cirrus” (1.37 µm) images (below) showed that these wave clouds were radiometrically transparent to longwave thermal energy being emitted from/near the surface — note that marine boundary layer stratocumulus clouds could be seen drifting westward within the easterly trade wind flow. As a result, the satellite-sensed 10.3 µm infrared brightness temperatures of the standing wave clouds were significantly warmer than that of the air at higher altitudes where they existed. These standing wave cloud features were, however, very apparent in 1.37 µm Cirrus imagery, along with what appeared to be other thin filaments of cirrus cascading southward overhead. The southward motion of the features seen on Cirrus imagery suggests that they existed at pressure levels of 370 hPa (26,900 feet / 8.2 km) or higher — altitudes where northerly winds were found on the Hilo sounding.
![GOES-17 "Clean" Infrared Window (10.3 µm) and Near-Infrared "Cirrus" (1.37 µm) images [click to play animation | MP4]](https://cimss.ssec.wisc.edu/satellite-blog/wp-content/uploads/sites/5/2018/11/hi_cirrus-20181125_230218.png)
GOES-17 “Clean” Infrared Window (10.3 µm) and Near-Infrared “Cirrus” (1.37 µm) images [click to play animation | MP4]
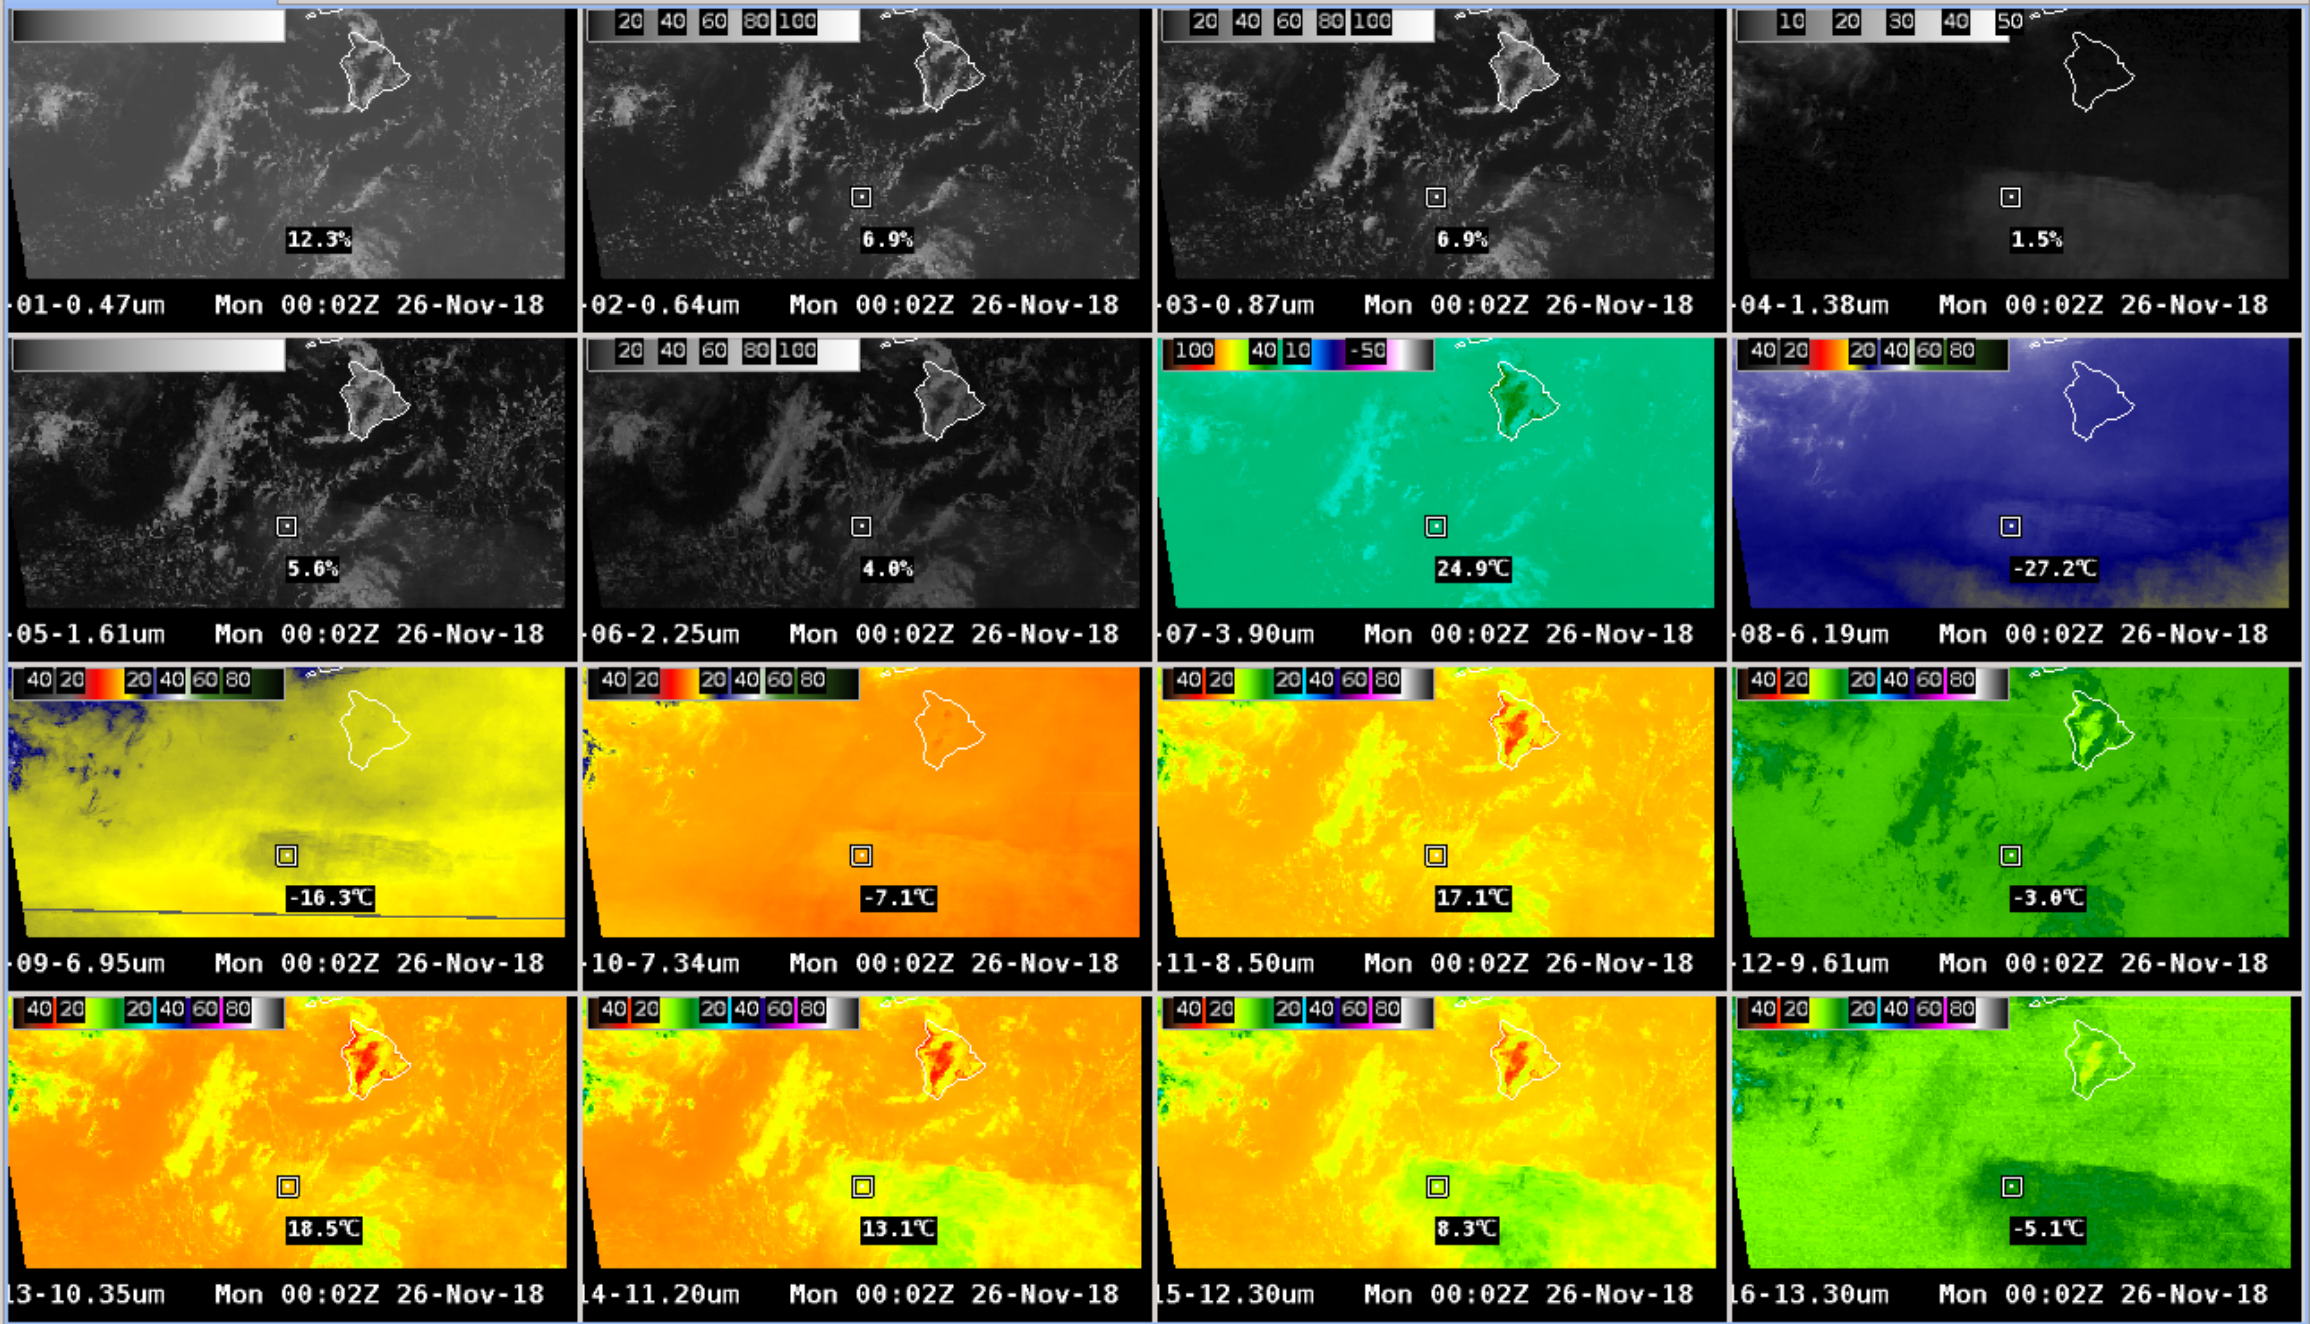
A comparison of all 16
ABI spectral bands is shown below. Note that in the longwave infrared bands along the bottom 4 panels, the brightness temperatures are progressively colder
(darker shades of green) on the
11.2 µm,
12.3 µm and
13.3 µm images — each of these bands are increasingly affected by water vapor absorption aloft, therefore more effectively sensing the thin layer of higher-altitude standing wave clouds. AWIPS cursor sampling showed the differences in detected brightness temperature at 3 different points along the feature:
here,
here and
here. The increasing sensitivity to radiation emitted from higher altitudes can also be seen in a comparison of weighting functions for
ABI bands 13, 14, 15 and 16.
![GOES-17 images of all 16 ABI bands [click to play animation | MP4]](https://cimss.ssec.wisc.edu/satellite-blog/wp-content/uploads/sites/5/2018/11/hi_16panel-20181125_230218.png)
GOES-17 images of all 16 ABI spectral bands [click to play animation | MP4]
GOES-15
(GOES-West) Water Vapor (6.5 µm), Infrared Window (10.7 µm) and Infrared CO2 (13.3 µm) images
(below) showed that the lower spatial resolution of the legacy
GOES Imager infrared bands
(4 km at satellite sub-point) was not able to resolve the individual waves as well as the 2-km GOES-17 ABI images . Also, as was seen with the GOES-17 imagery, the 13.3 µm CO2 brightness temperatures of the standing wave clouds were significantly colder
(shades of blue) compared to those of the conventional 10.7 µm Infrared Window. The corresponding GOES-15 Visible imagery (0.63 µm) is also available:
animated GIF |
MP4.
![GOES-15 Water Vapor (6.5 µm, keft), Infrared Window (10.7 µm, center) and Infraered CO2 (13.3 µm, right) images [click to play animation | MP4]](https://cimss.ssec.wisc.edu/satellite-blog/wp-content/uploads/sites/5/2018/11/G15_WATER_VAPOR_INFRARED_HAWAII_25NOV2018_2018329_230000_GOES-15_0003PANELS.GIF)
GOES-15 Water Vapor (6.5 µm, keft), Infrared Window (10.7 µm, center) and Infraered CO2 (13.3 µm, right) images [click to play animation | MP4]
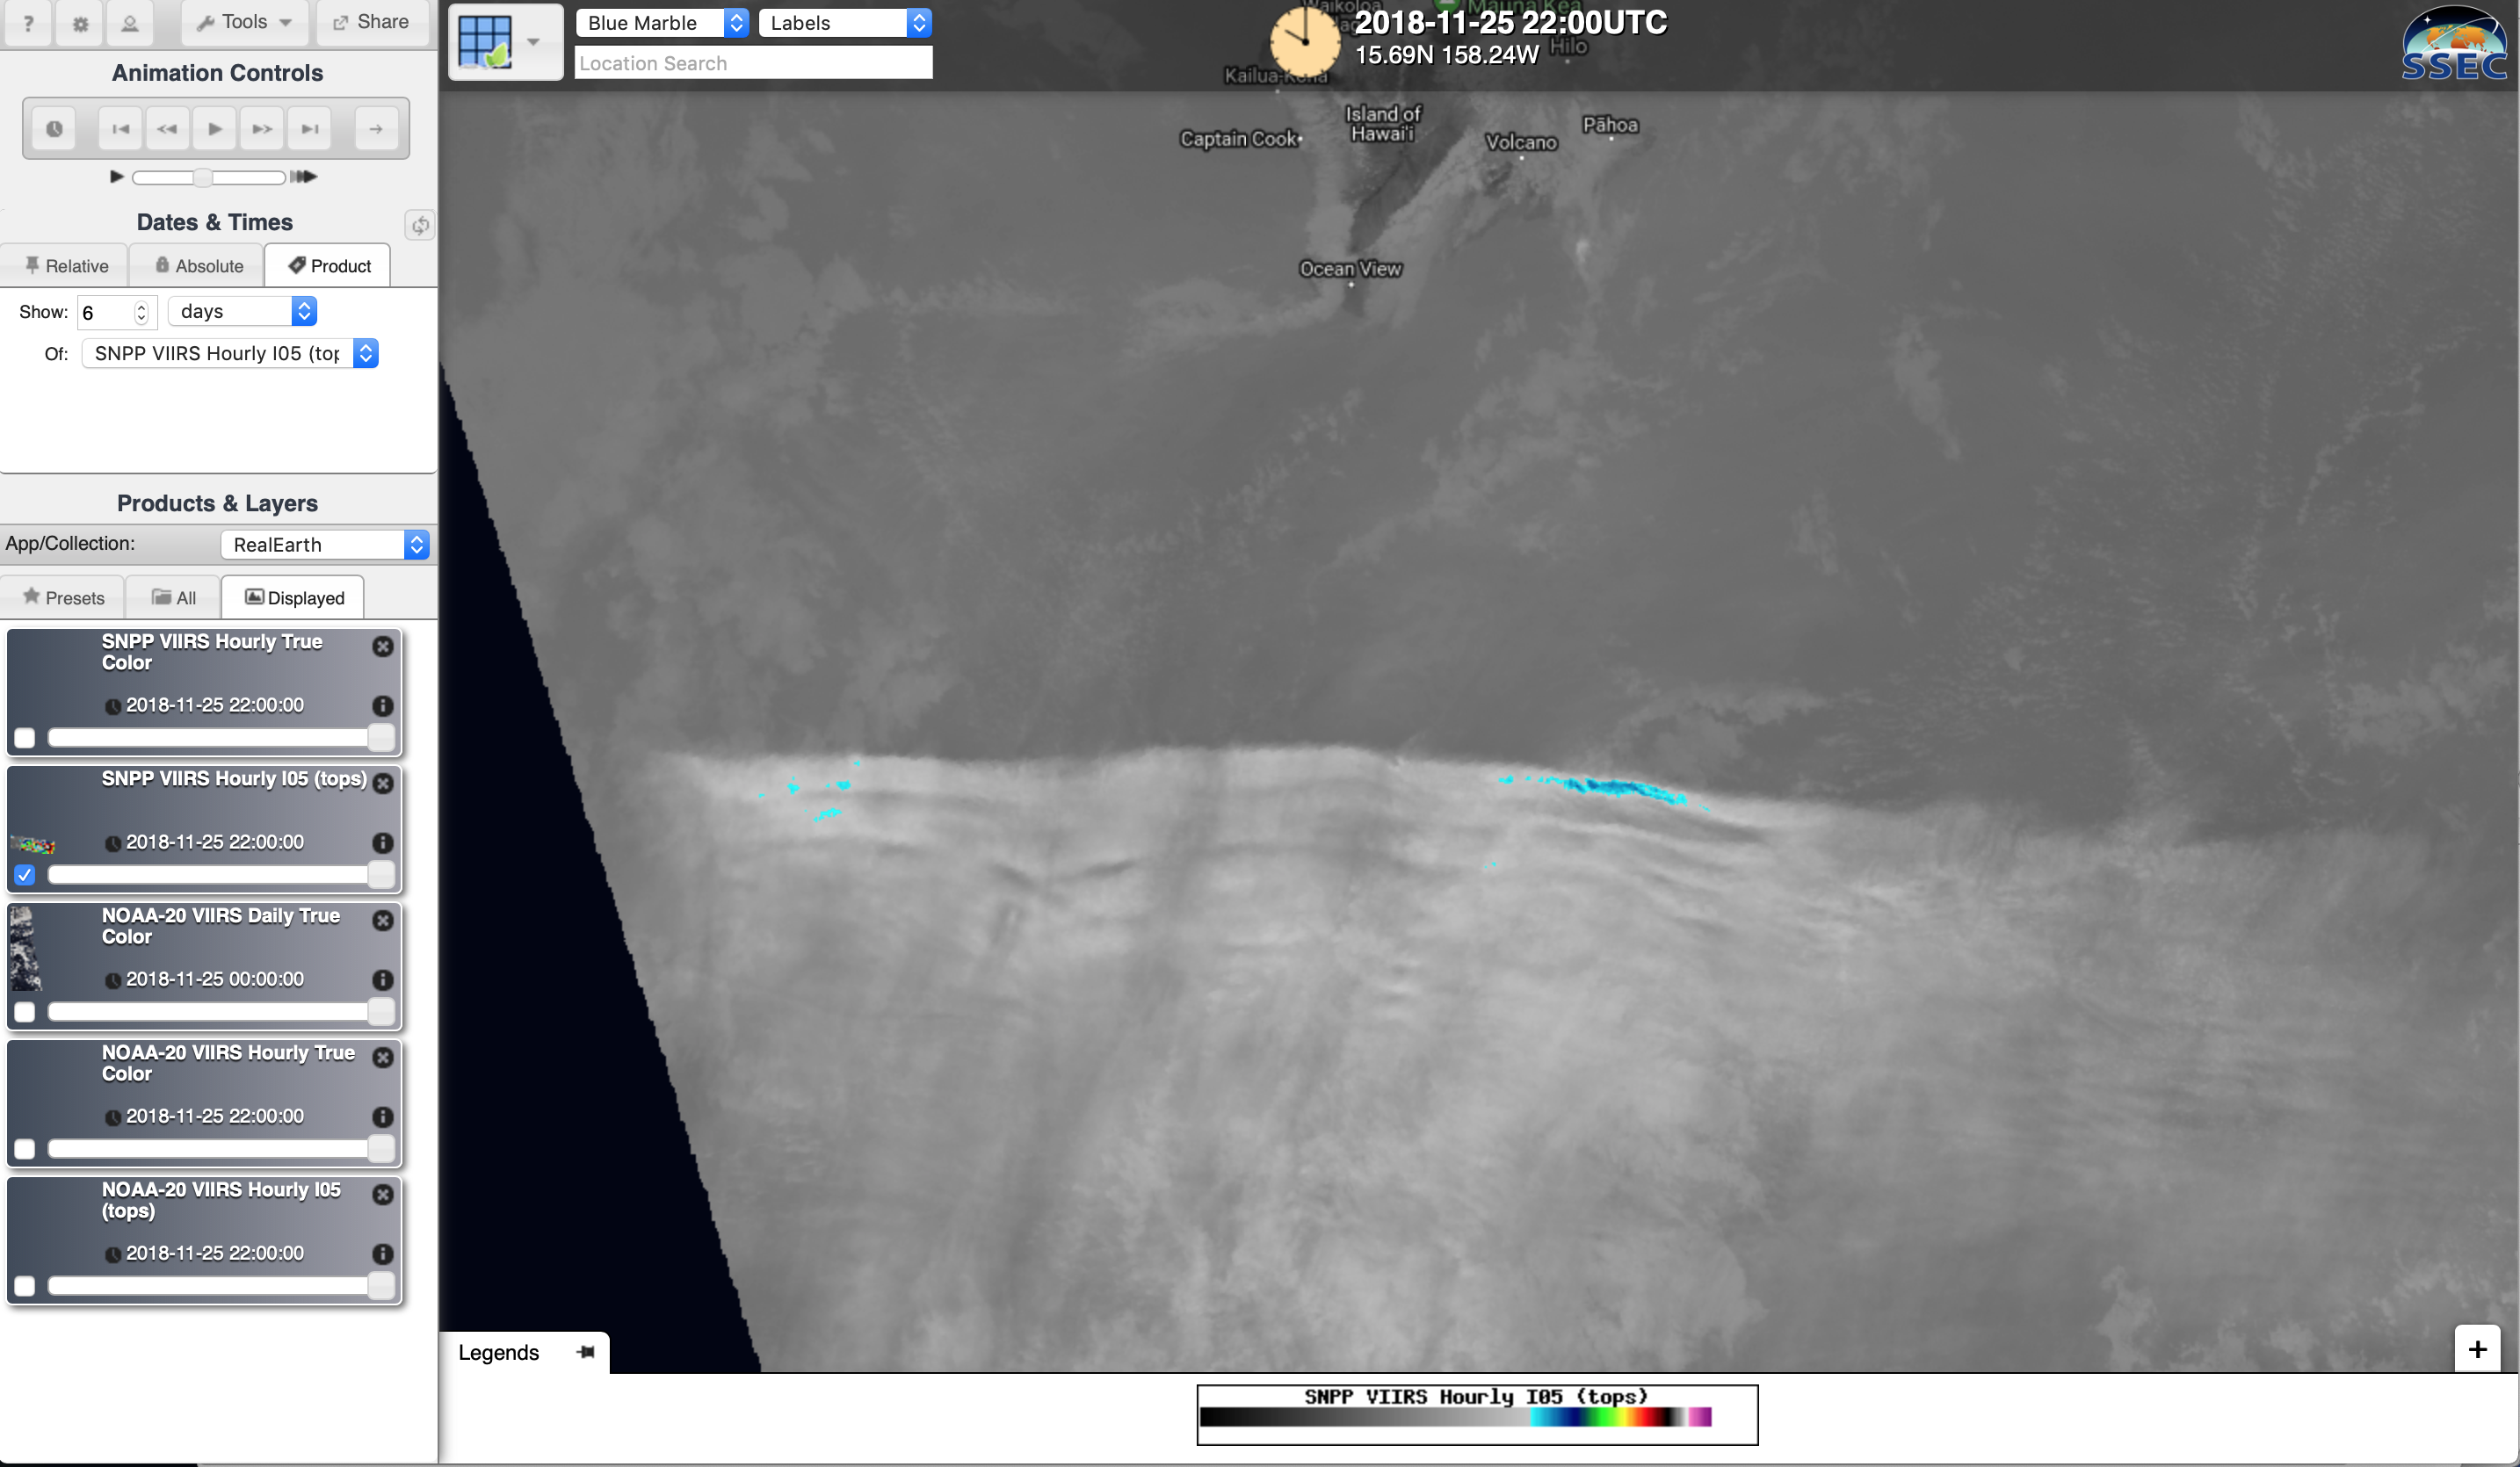
In comparisons of VIIRS True Color Red-Green-Blue (RGB) and Infrared Window (11.45 µm) images from Suomi NPP and NOAA-20 visualized using
RealEarth (below), note the highly-transparent nature of the standing wave clouds on the RGB images; only the earliest 2256 UTC VIIRS
11.45 µm image displayed brightness temperatures of -20ºC and colder
(cyan to blue enhancement).
![Suomi NPP VIIRS True Color RGB and Infrared Window (11.45 µm) images at 2256 UTC [click to enlarge]](https://cimss.ssec.wisc.edu/satellite-blog/wp-content/uploads/sites/5/2018/11/181125_2246utc_snpp_viirs_truecolor_infraredWindow_HI_anim.gif)
Suomi NPP VIIRS True Color RGB and Infrared Window (11.45 µm) images at 2256 UTC [click to enlarge]
![NOAA-20 VIIRS True Color RGB and Infrared Window (11.45 µm) images at 2336 UTC [click to enlarge]](https://cimss.ssec.wisc.edu/satellite-blog/wp-content/uploads/sites/5/2018/11/181125_2336utc_noaa20_viirs_truecolor_infraredWindow_HI_anim.gif)
NOAA-20 VIIRS True Color RGB and Infrared Window (11.45 µm) images at 2336 UTC [click to enlarge]
![Suomi NPP VIIRS True Color RGB and Infrared Window (11.45 µm) images at 0028 UTC [click to enlarge]](https://cimss.ssec.wisc.edu/satellite-blog/wp-content/uploads/sites/5/2018/11/181126_0028utc_snpp_viirs_truecolor_infraredWindow_HI_anim.gif)
Suomi NPP VIIRS True Color RGB and Infrared Window (11.45 µm) images at 0028 UTC [click to enlarge]
Terra (at 2043 UTC) and Aqua (at 2347 UTC) MODIS True Color RGB images along with retrievals of Cloud Phase, Cloud Top Temperature, Cloud Top Height and Cloud Top Pressure from the
WorldView site
(below) indicated that the standing wave feature was composed of ice crystal clouds exhibiting temperature values of -53ºC and colder
(dark purple enhancement) located at heights of 12 km or higher (and at pressure levels at or above 250 hPa). These temperature/height/pressure values roughly corresponded to the upper portion of a layer of increasing relative humidity between 200-274 hPa on the
Hilo sounding.
![Terra MODIS True Color RGB image and retrievals of Cloud Phase, Cloud Top Temperature, Cloud Top Height and Cloud Top Pressure at 2043 UTC [click to enlarge]](https://cimss.ssec.wisc.edu/satellite-blog/wp-content/uploads/sites/5/2018/11/181125_2043utc_terra_modis_truecolor_cloudPhase_cloudTopTemperature_cloudTopHeight_cloudTopPressure_HI_anim.gif)
Terra MODIS True Color RGB image and retrievals of Cloud Phase, Cloud Top Temperature, Cloud Top Height and Cloud Top Pressure at 2043 UTC [click to enlarge]
![Aqua MODIS True Color RGB image and retrievals of Cloud Phase, Cloud Top Temperature, Cloud Top Height and Cloud Top Pressure at 2347 UTC [click to enlarge]](https://cimss.ssec.wisc.edu/satellite-blog/wp-content/uploads/sites/5/2018/11/181125_2347utc_aqua_modis_truecolor_cloudPhase_cloudTopTemperature_cloudTopHeight_cloudTopPressure_HI_anim.gif)
Aqua MODIS True Color RGB image and retrievals of Cloud Phase, Cloud Top Temperature, Cloud Top Height and Cloud Top Pressure at 2347 UTC [click to enlarge]
However, an experimental
CLAVR-x version of GOES-17 Cloud Type, Cloud Top Temperature and Cloud Top Height products
(below; courtesy of Steve Wanzong, CIMSS) indicated Cirrus clouds having temperature values in the 210-200 K (-63 to -73ºC) range at heights within the 13-16 km range. These colder/higher values raise the question of whether the wave clouds might have formed and been ducted within the shallow temperature inversion near 15 km on the
Hilo sounding.
![GOES-17 Cloud Type product [click to play animation | MP4]](https://cimss.ssec.wisc.edu/satellite-blog/wp-content/uploads/sites/5/2018/11/cloud_type.no-grid.20181125.230300.jpg)
GOES-17 Cloud Type product [click to play animation | MP4]
![GOES-17 Cloud Top Temperature product [click to play animation | MP4]](https://cimss.ssec.wisc.edu/satellite-blog/wp-content/uploads/sites/5/2018/11/cld_temp_acha.no-grid.20181125.230300.jpg)
GOES-17 Cloud Top Temperature product [click to play animation | MP4]
![GOES-17 Cloud Top Height product [click to play animation | MP4]](https://cimss.ssec.wisc.edu/satellite-blog/wp-content/uploads/sites/5/2018/11/cld_height_acha.no-grid.20181125.230300.jpg)
GOES-17 Cloud Top Height product [click to play animation | MP4]
GOES-17 False Color RGB images
(below) vividly portrayed the transparent nature of the high-altitude standing wave cloud feature, which allowed westward-moving stratocumulus clouds within the marine boundary layer to plainly be seen. The RGB components are 1.38 µm / 0.64 µm / 1.61 µm.
![GOES-17 False Color RGB images [click to play animation | MP4]](https://cimss.ssec.wisc.edu/satellite-blog/wp-content/uploads/sites/5/2018/11/clavrx_OR_ABI-L1b-RadC-M3C01_G17_s20183292302189_FD.level2.true_rgb.tif.png)
GOES-17 False Color RGB images [click to play animation | MP4]
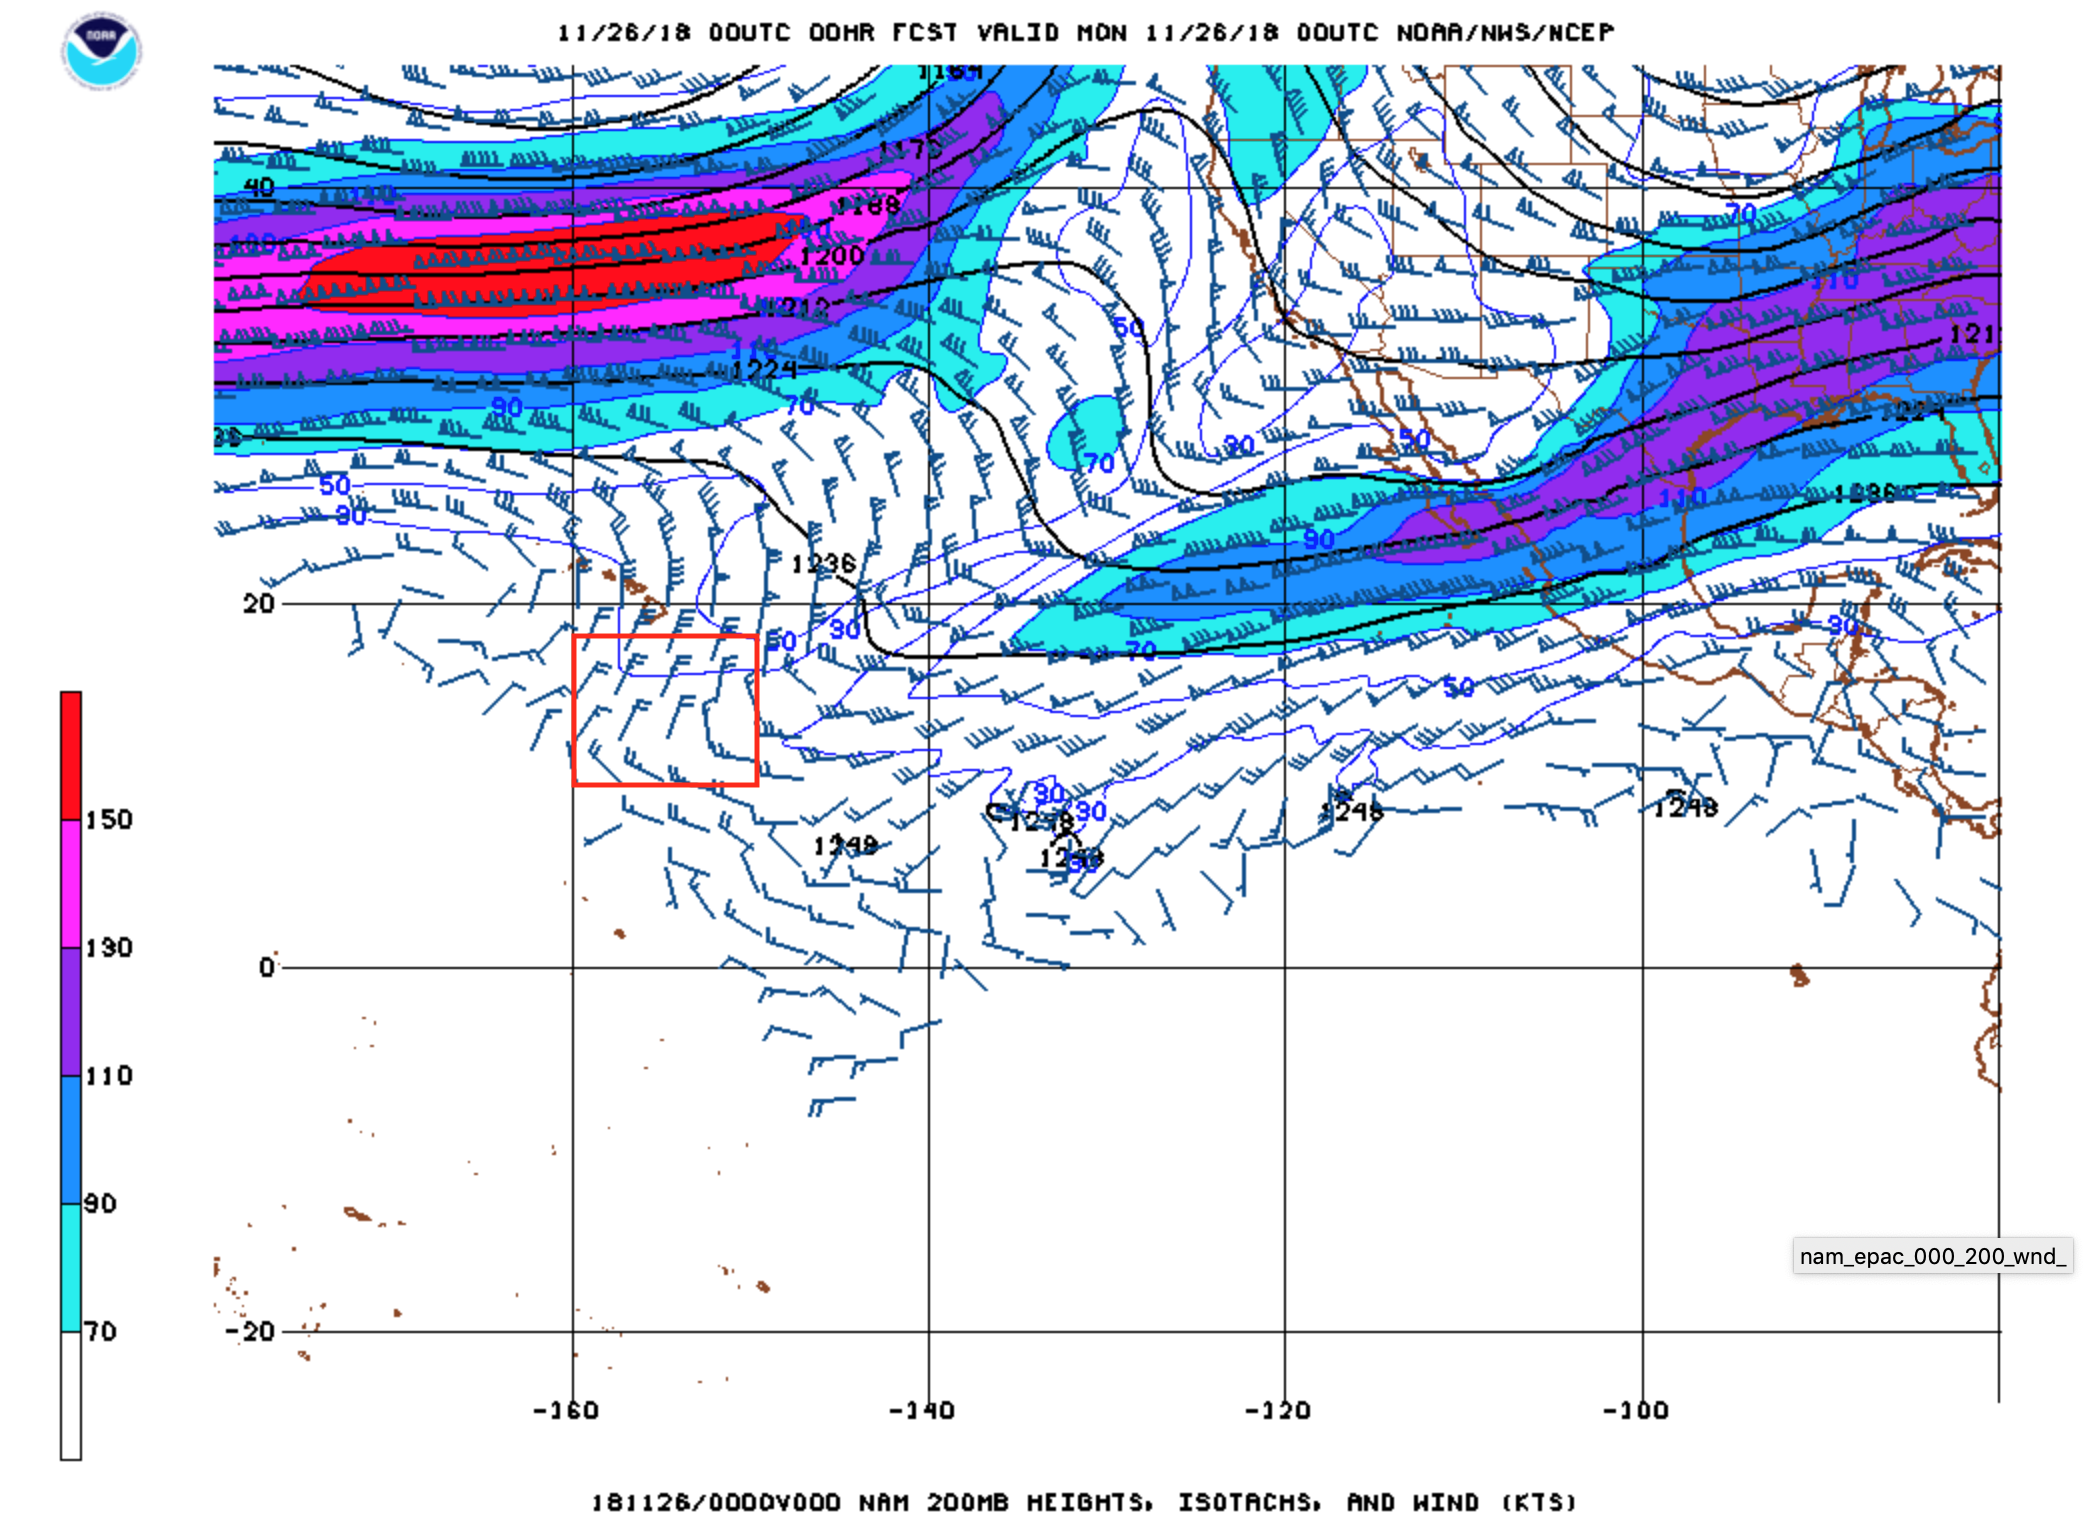
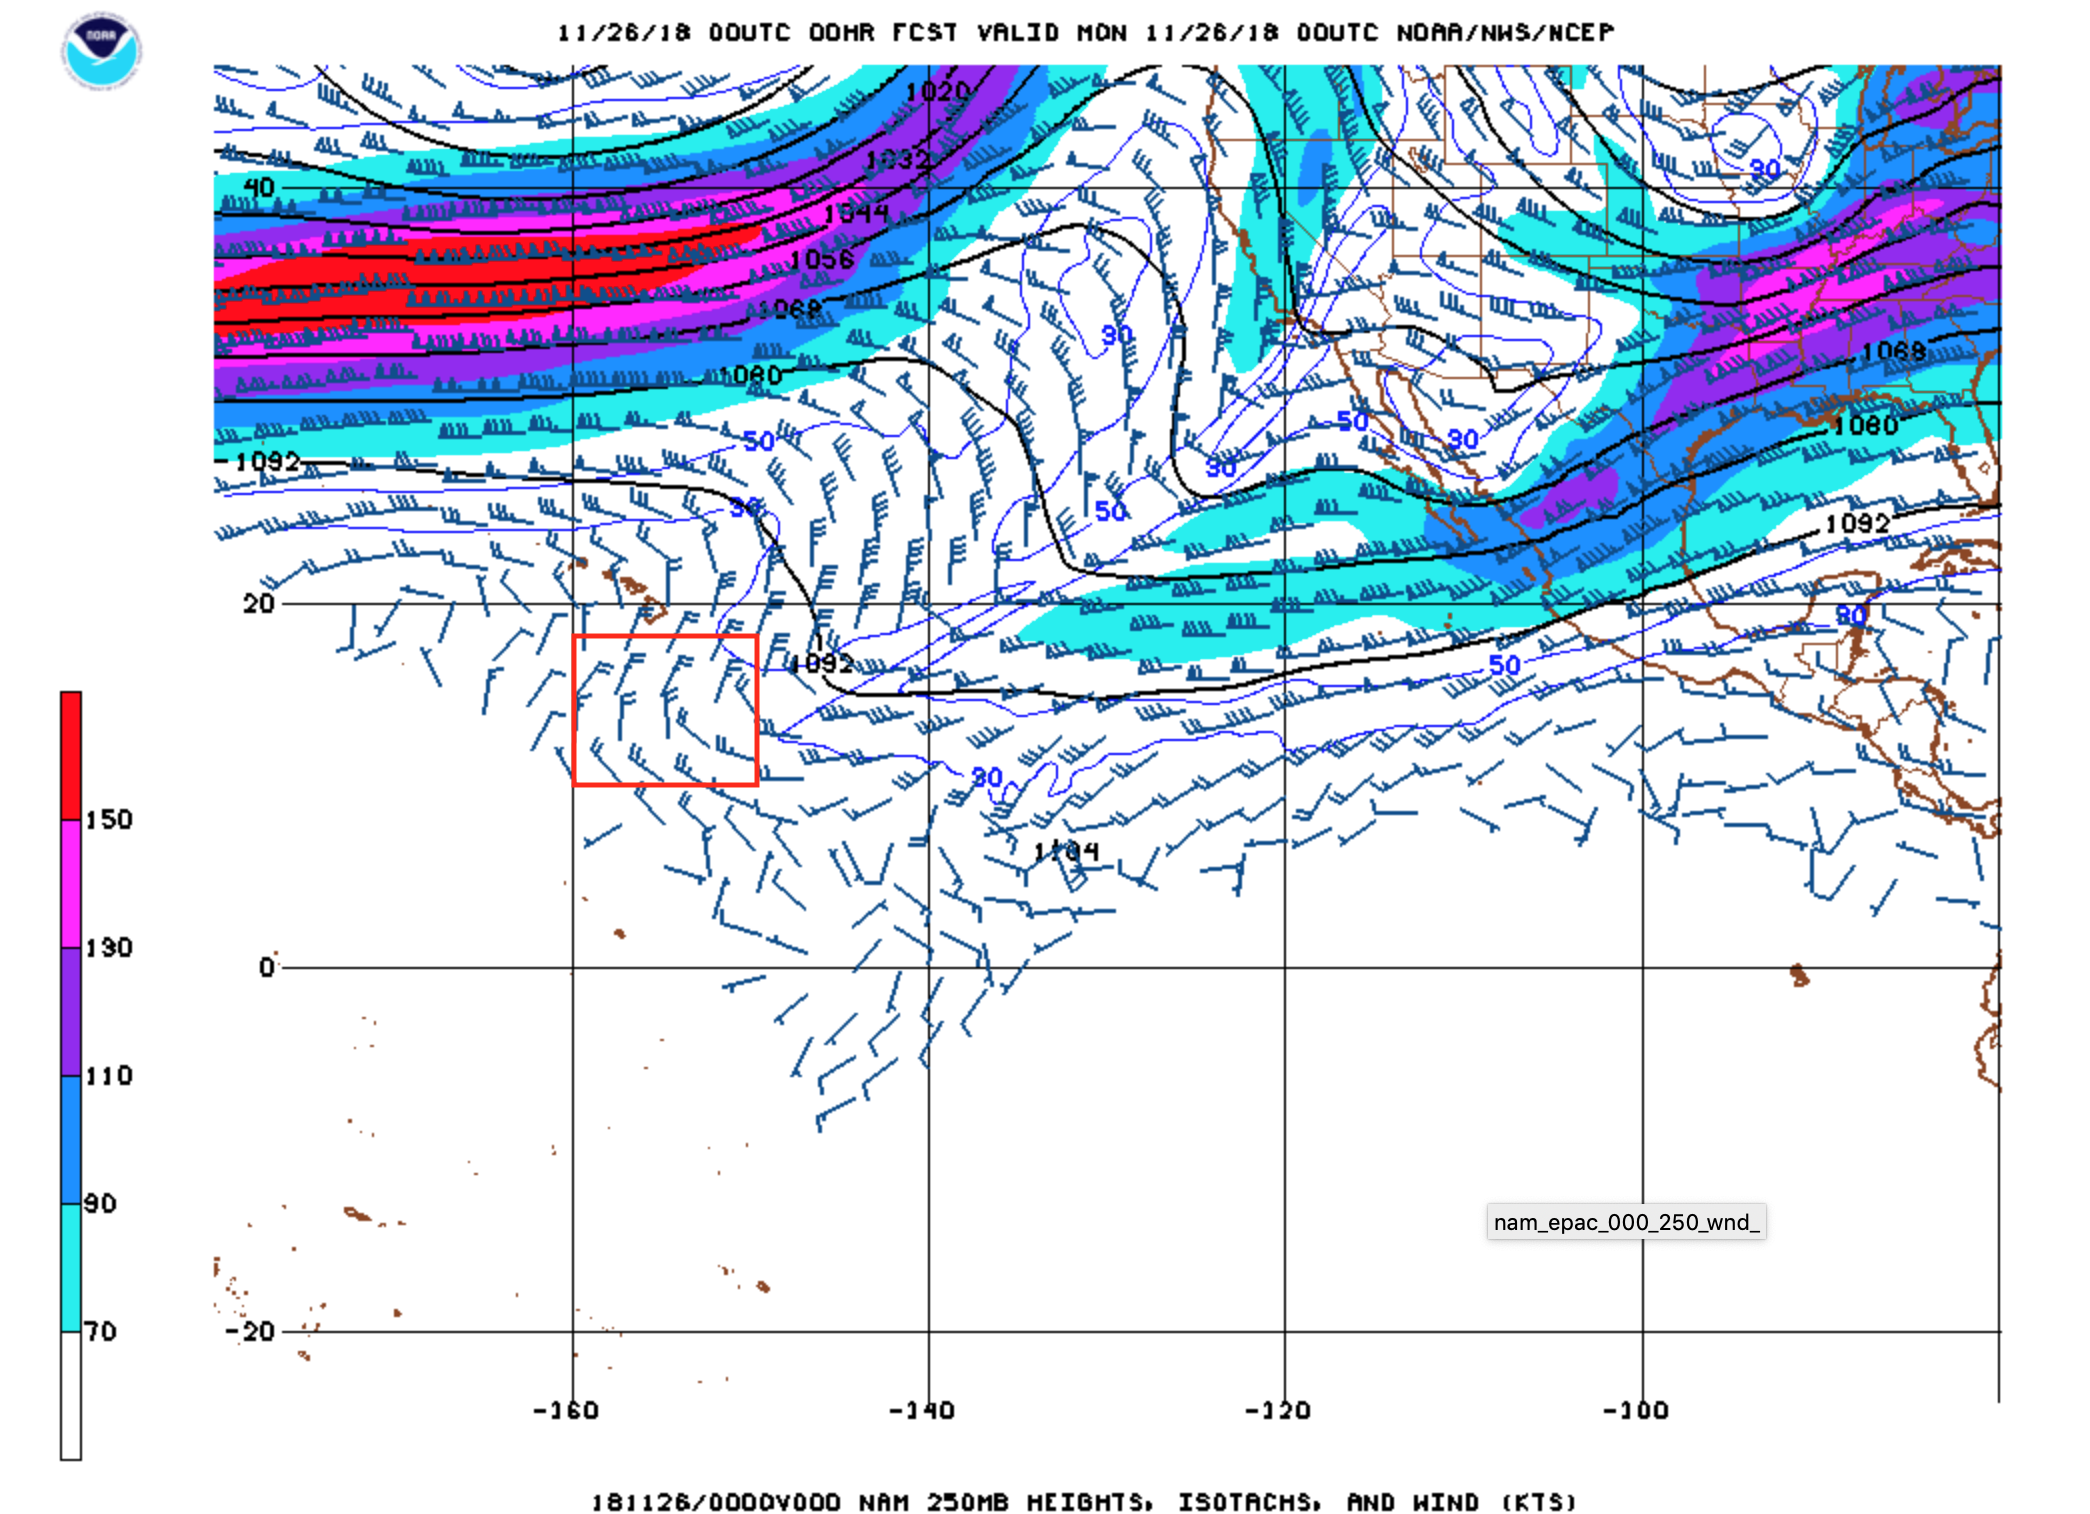
A coherent explanation of this feature and what caused it to form remains elusive, earning it a distinguished place in the
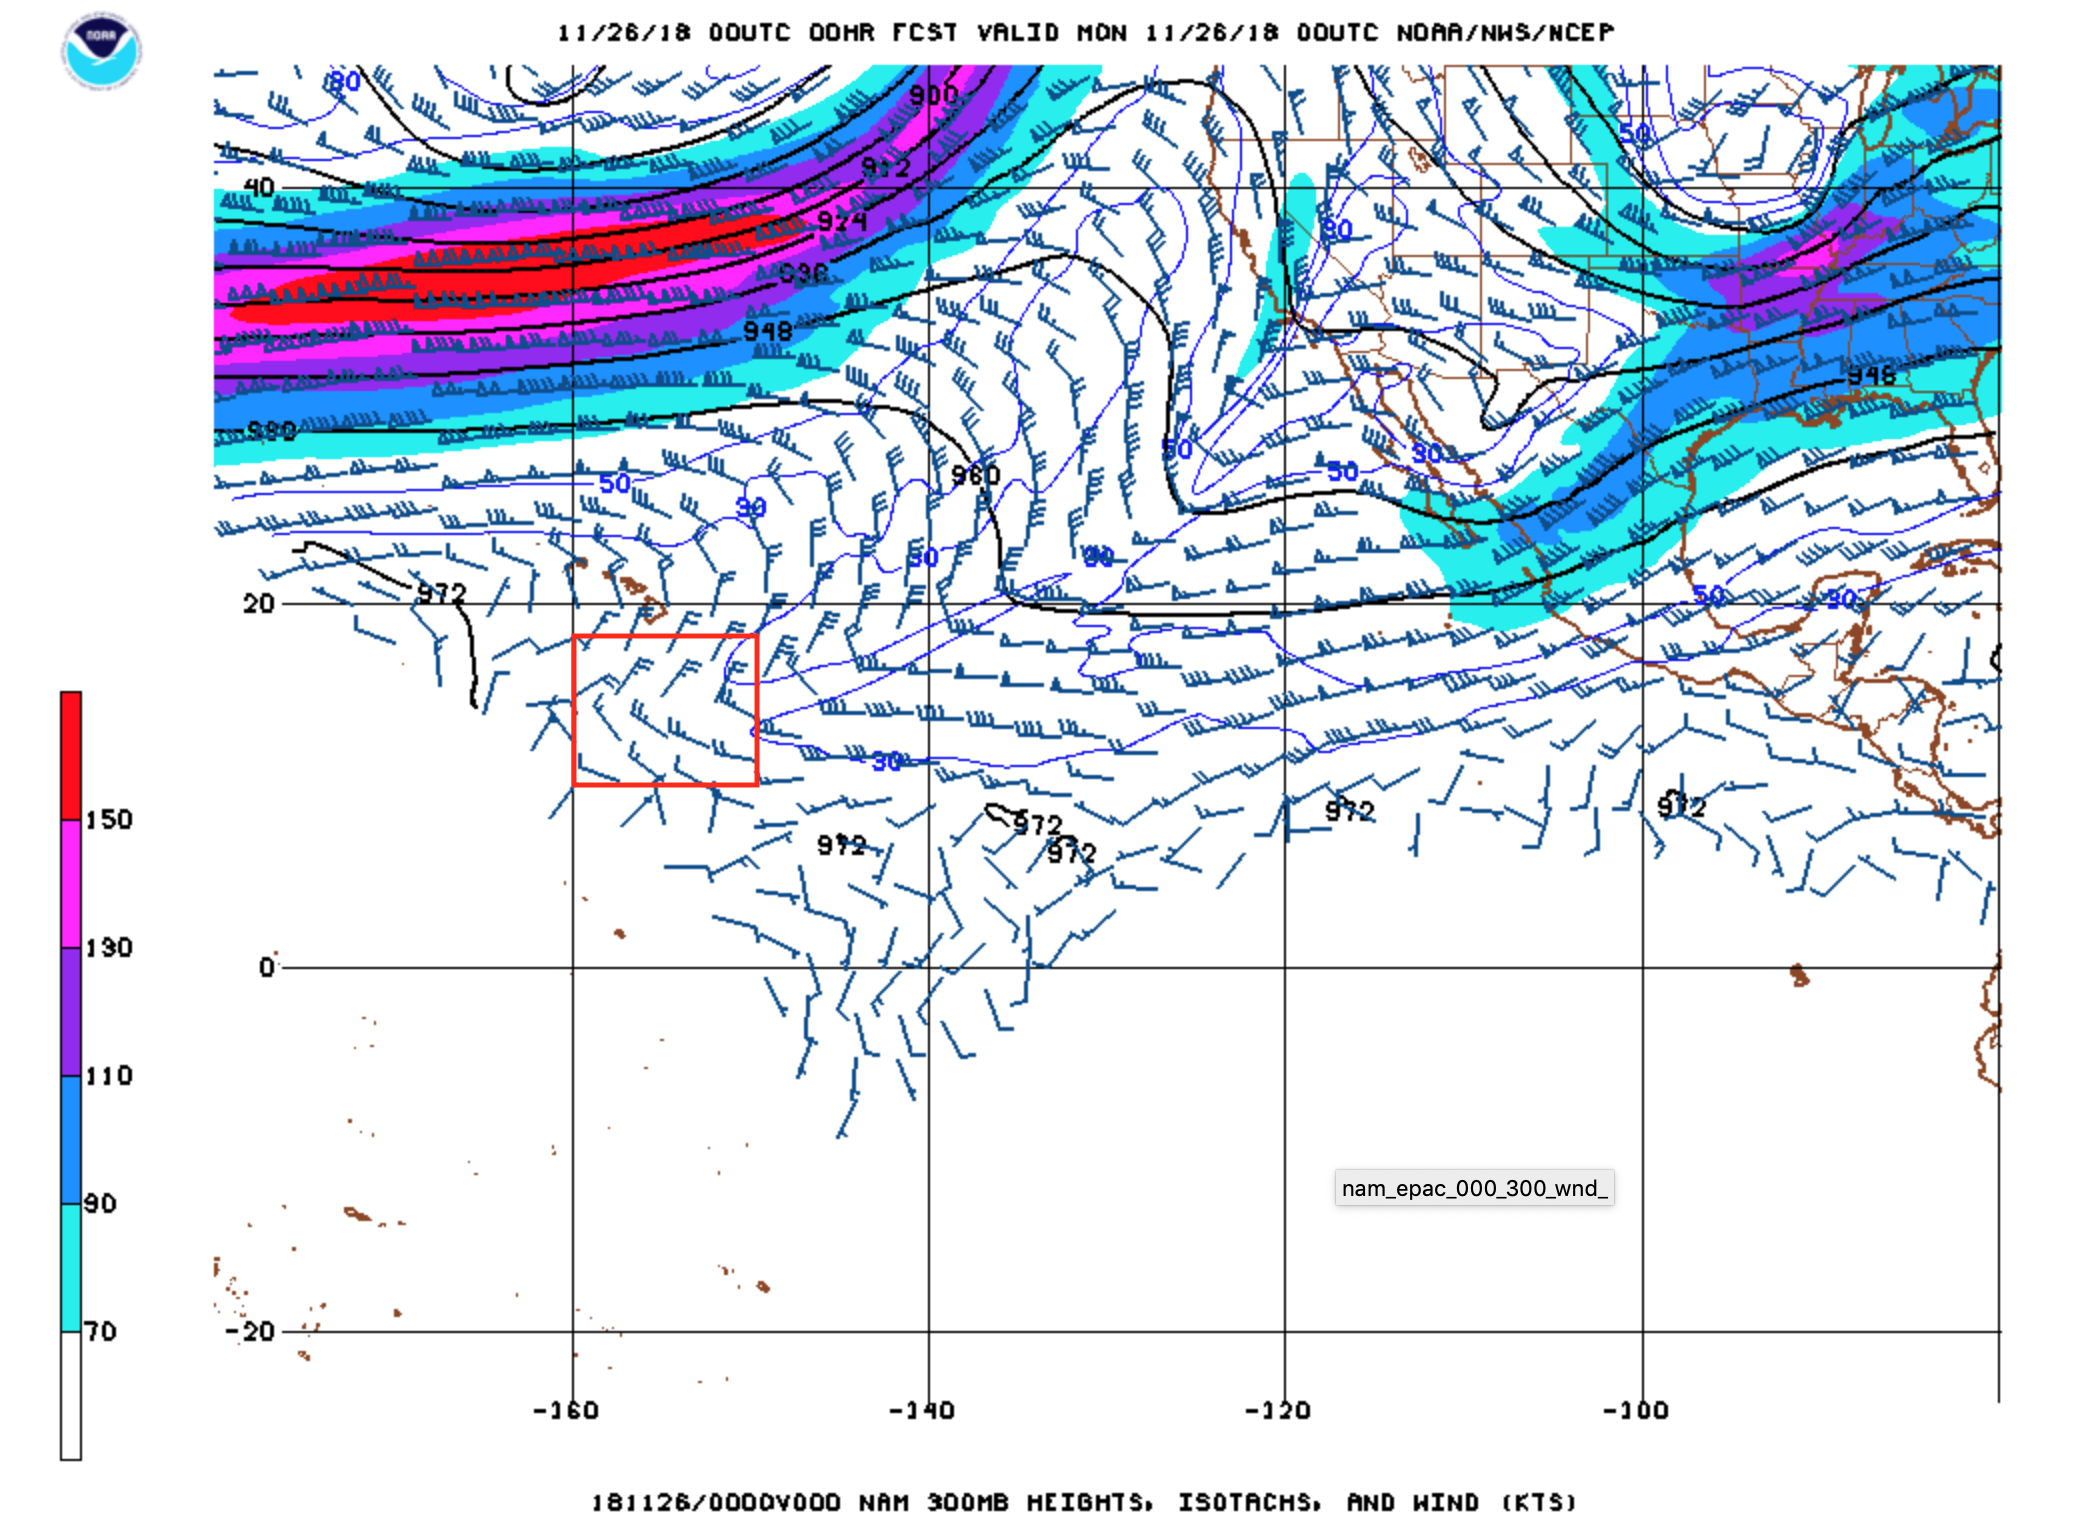
what the heck is this? blog category. Perhaps one clue existed in the winds aloft, as depicted by the
NAM at
200 hPa,
250 hPa and
300 hPa (below), which showed northerly/northeasterly flow that was
decelerating as it entered a trough axis
(the region within the red box). Could this flow deceleration have induced a “reverse flow” which then caused enough weak lift to form the thin standing wave clouds within the aforementioned semi-moist 200-274 hPa layer seen on the
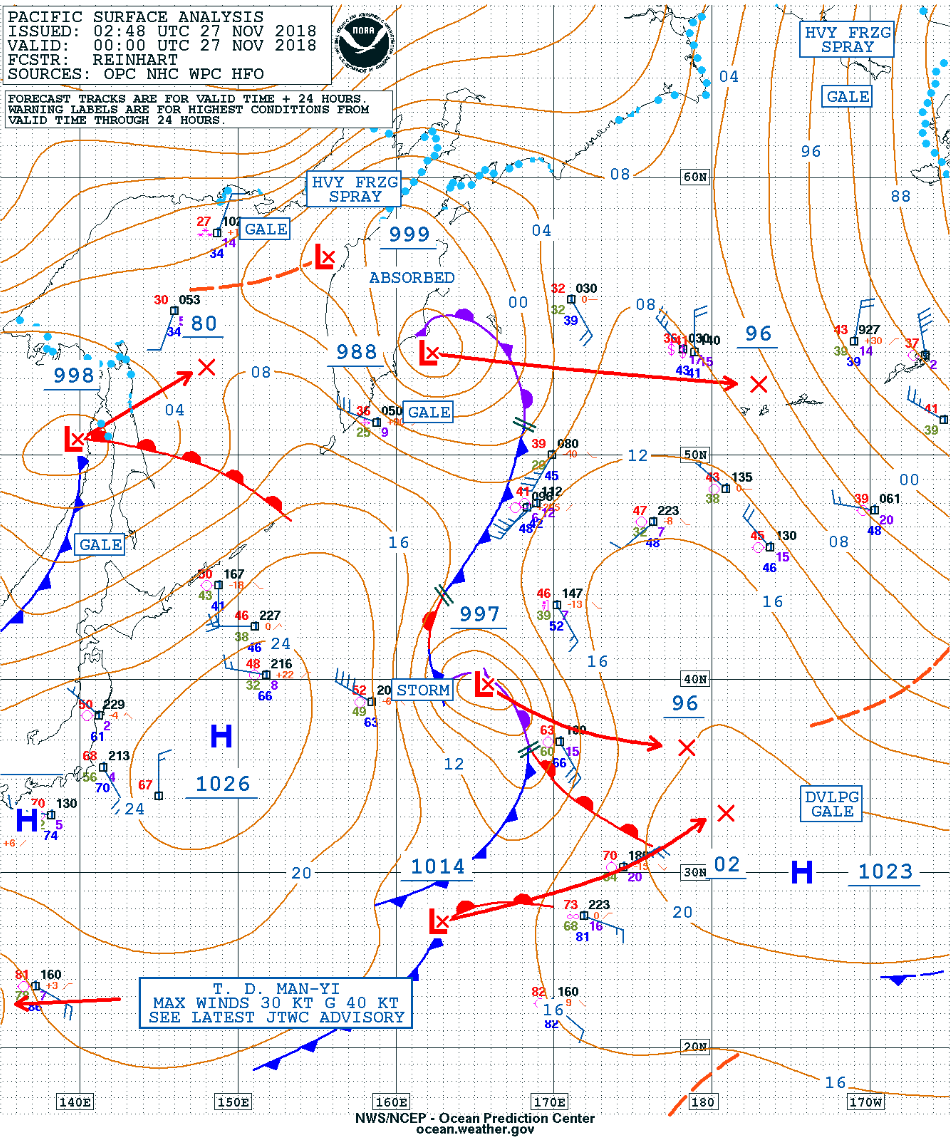
Hilo sounding? No other obvious forcing mechanisms were in the immediate area — a slowly-approaching
surface cold front was too far north of Hawai’i to have played a role.
![NAM Winds at 200 hPa, 250 hPa and 300 hPa [click to enlarge]](https://cimss.ssec.wisc.edu/satellite-blog/wp-content/uploads/sites/5/2018/11/181126_00utc_nam_200_250_300_winds_HI_anim.gif)
NAM Winds at 200 hPa, 250 hPa and 300 hPa [click to enlarge]
View only this post
Read Less
![Suomi NPP VIIRS True Color RGB image at 1753 UTC [click to enlarge]](https://cimss.ssec.wisc.edu/satellite-blog/wp-content/uploads/sites/5/2018/11/181129_1753utc_suomiNPP_viirs_truecolor_Argentina_anim.gif)
![Suomi NPP VIIRS True Color RGB and Infrared Windoe (11.45 µm) images at 1753 UTC [click to enlarge]](https://cimss.ssec.wisc.edu/satellite-blog/wp-content/uploads/sites/5/2018/11/181129_1753utc_suomiNPP_viirs_truecolor_infraredWindow_Argentina_anim.gif)
![NOAA-20 VIIRS True Color RGB and Infrared Windoe (11.45 µm) images at 1843 UTC [click to enlarge]](https://cimss.ssec.wisc.edu/satellite-blog/wp-content/uploads/sites/5/2018/11/181129_1843utc_noaa20_viirs_truecolor_infraredWindow_Argentina_anim.gif)

![GOES-16 Near-Infrared "Snow/Ice" (1.61 µm) images [click to play MP4 animation]](https://cimss.ssec.wisc.edu/satellite-blog/wp-content/uploads/sites/5/2018/11/G16_NIR_ARGENTINA_MCS_29NOV2018_2018333_184325_GOES-16_0001PANEL.GIF)
![GOES-16 "Clean" Infrared Window (10.3 µm) images [click to play MP4 animation]](https://cimss.ssec.wisc.edu/satellite-blog/wp-content/uploads/sites/5/2018/11/G16_IR_ARGENTINA_MCS_29NOV2018_2018333_184325_GOES-16_0001PANEL.GIF)
![GOES-16 "Red" Visible (0.64 µm, top), Near-Infrared :Snow/Ice" (1.61 µm, center) and "Clean" Infrared Window (10.3 µm, bottom) images [click to play MP4 animation]](https://cimss.ssec.wisc.edu/satellite-blog/wp-content/uploads/sites/5/2018/11/G16_VIS_NIR_IR_ARGENTINA_AACP_29NOV2018_2018333_214825_GOES-16_0003PANELS.GIF)
![Plot of 12 UTC Santa Rosa rawinsonde data [click to enlarge]](https://cimss.ssec.wisc.edu/satellite-blog/wp-content/uploads/sites/5/2018/11/181129_12UTC_SAZR_RAOB.GIF)
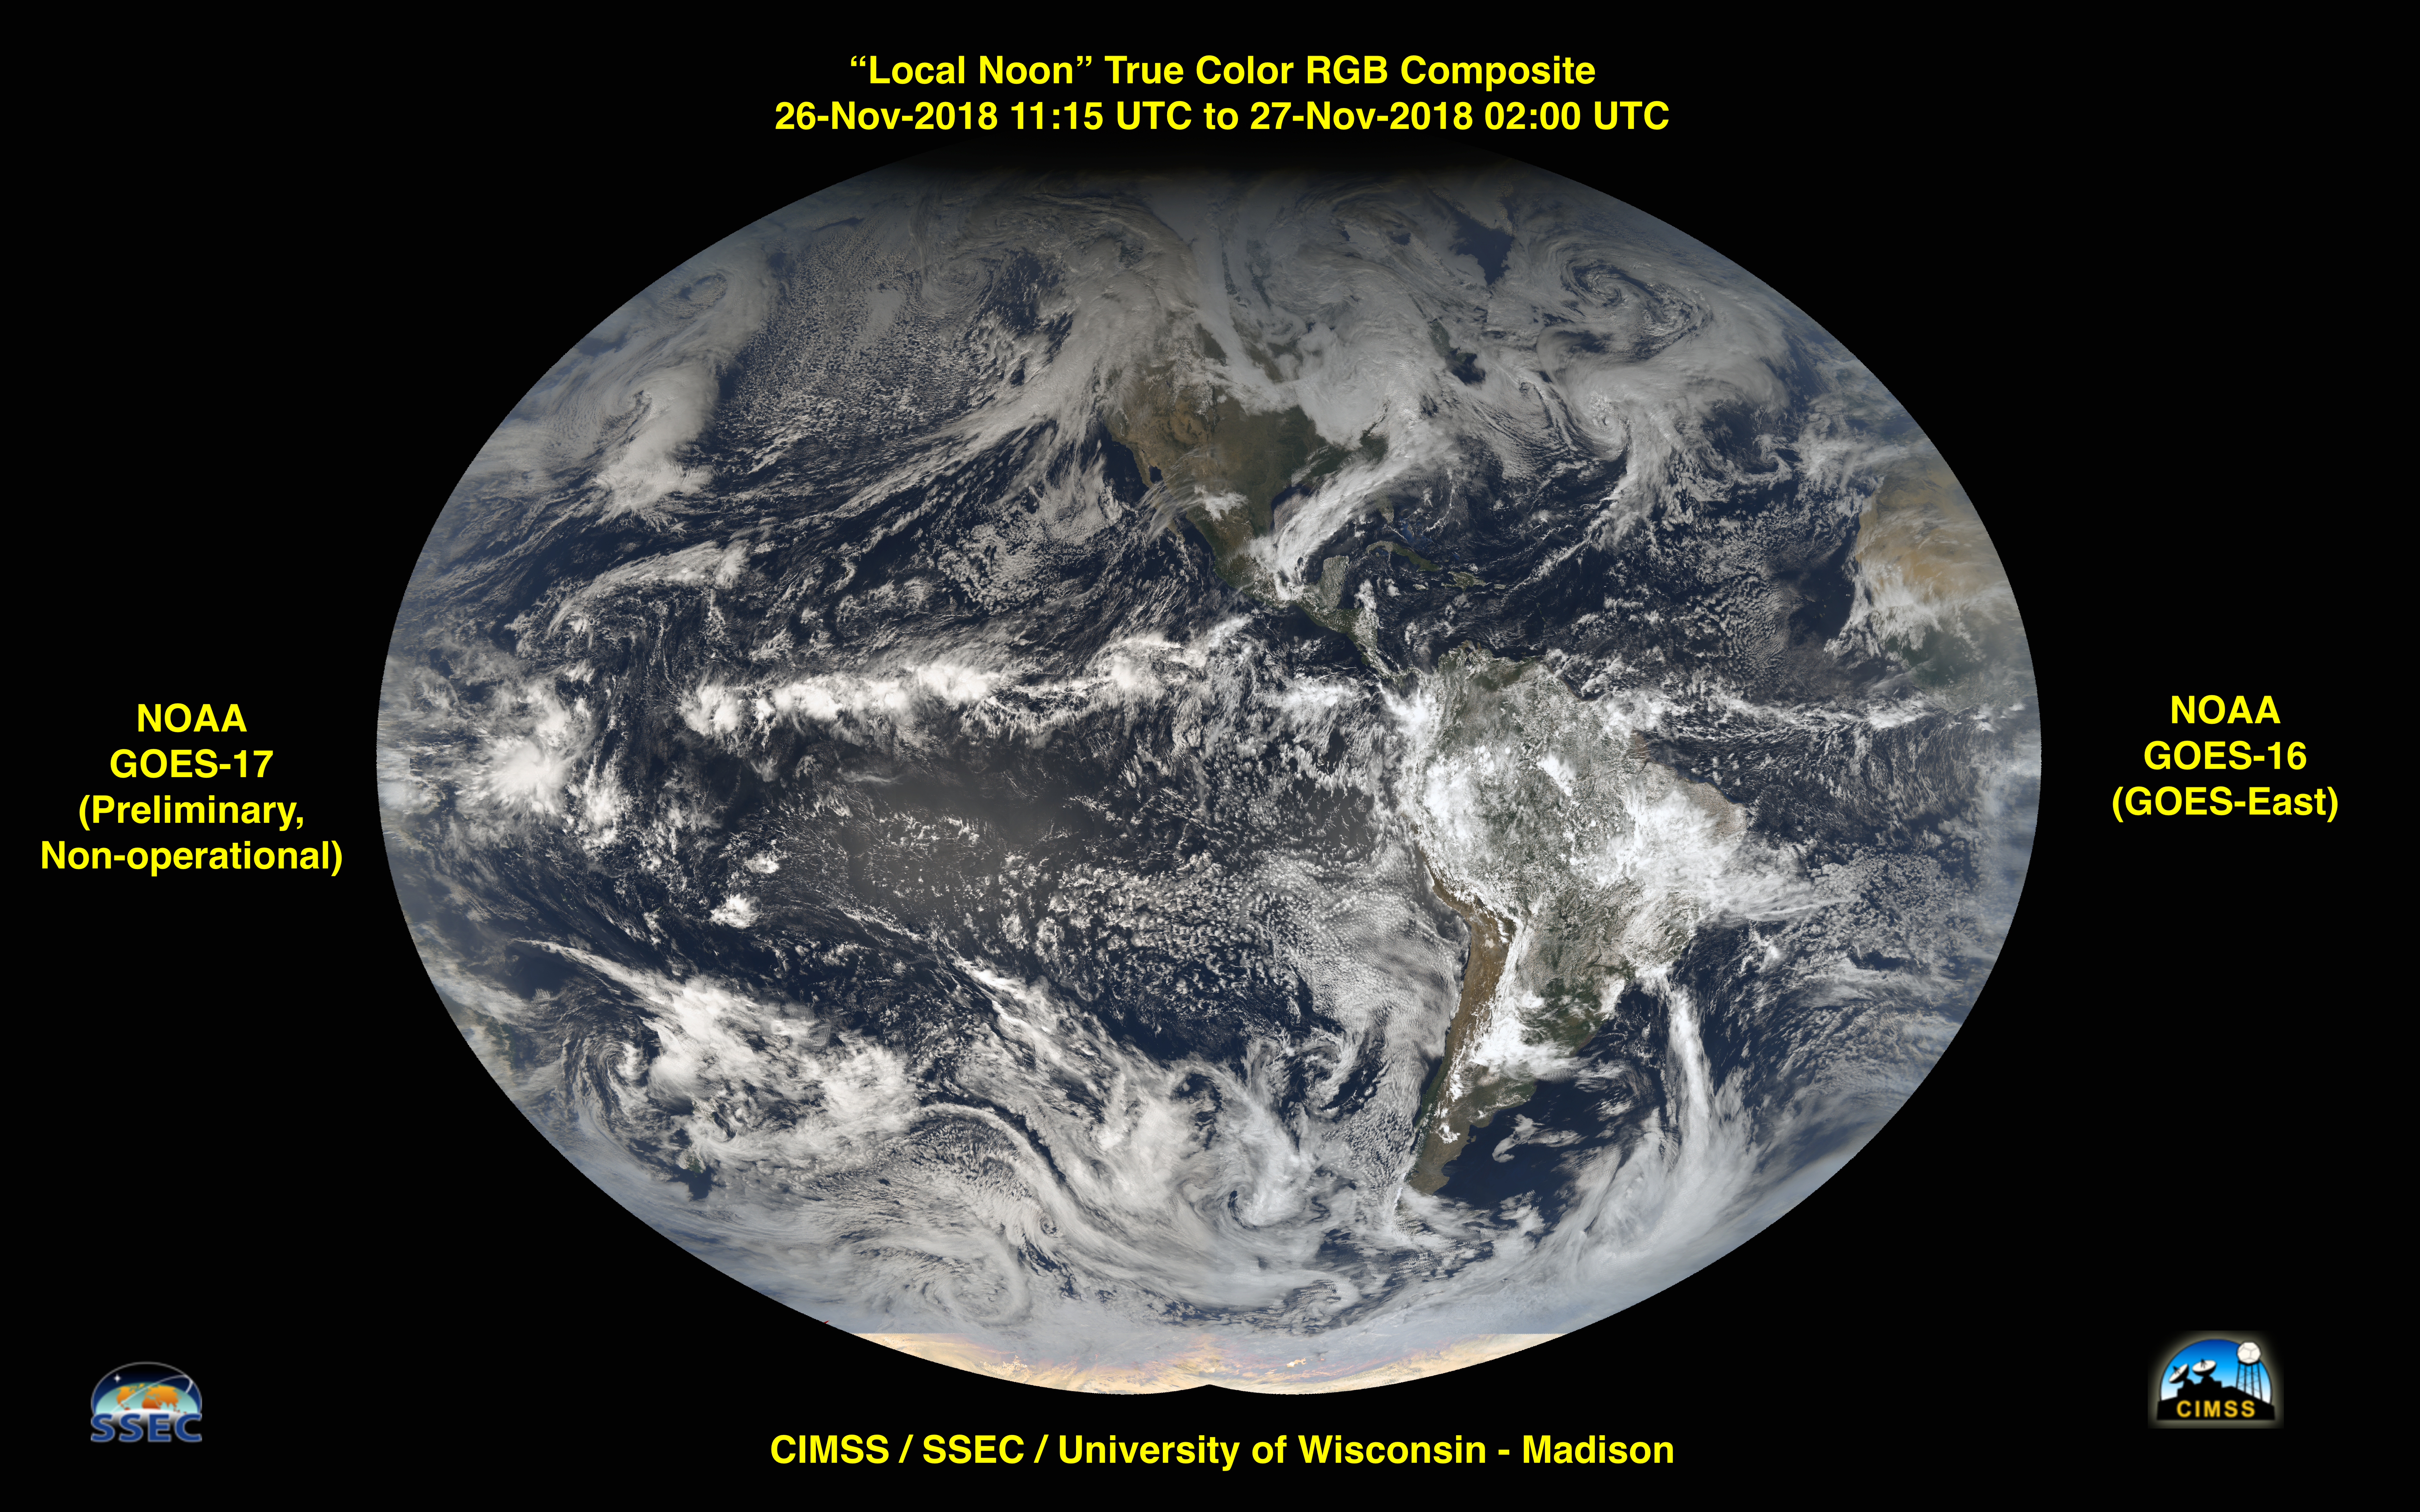
![GOES-17 / GOES-16 True Color RGB composite [click to enlarge]](https://cimss.ssec.wisc.edu/satellite-blog/wp-content/uploads/sites/5/2018/11/GOES17-GOES16-truecolor-local-noon-v2.jpg)
![GOES-17 / GOES-16 True Color RGB composite [click to enlarge]](https://cimss.ssec.wisc.edu/satellite-blog/wp-content/uploads/sites/5/2018/11/GOES17-GOES16-truecolor-local-noon-reference-v2.jpg)
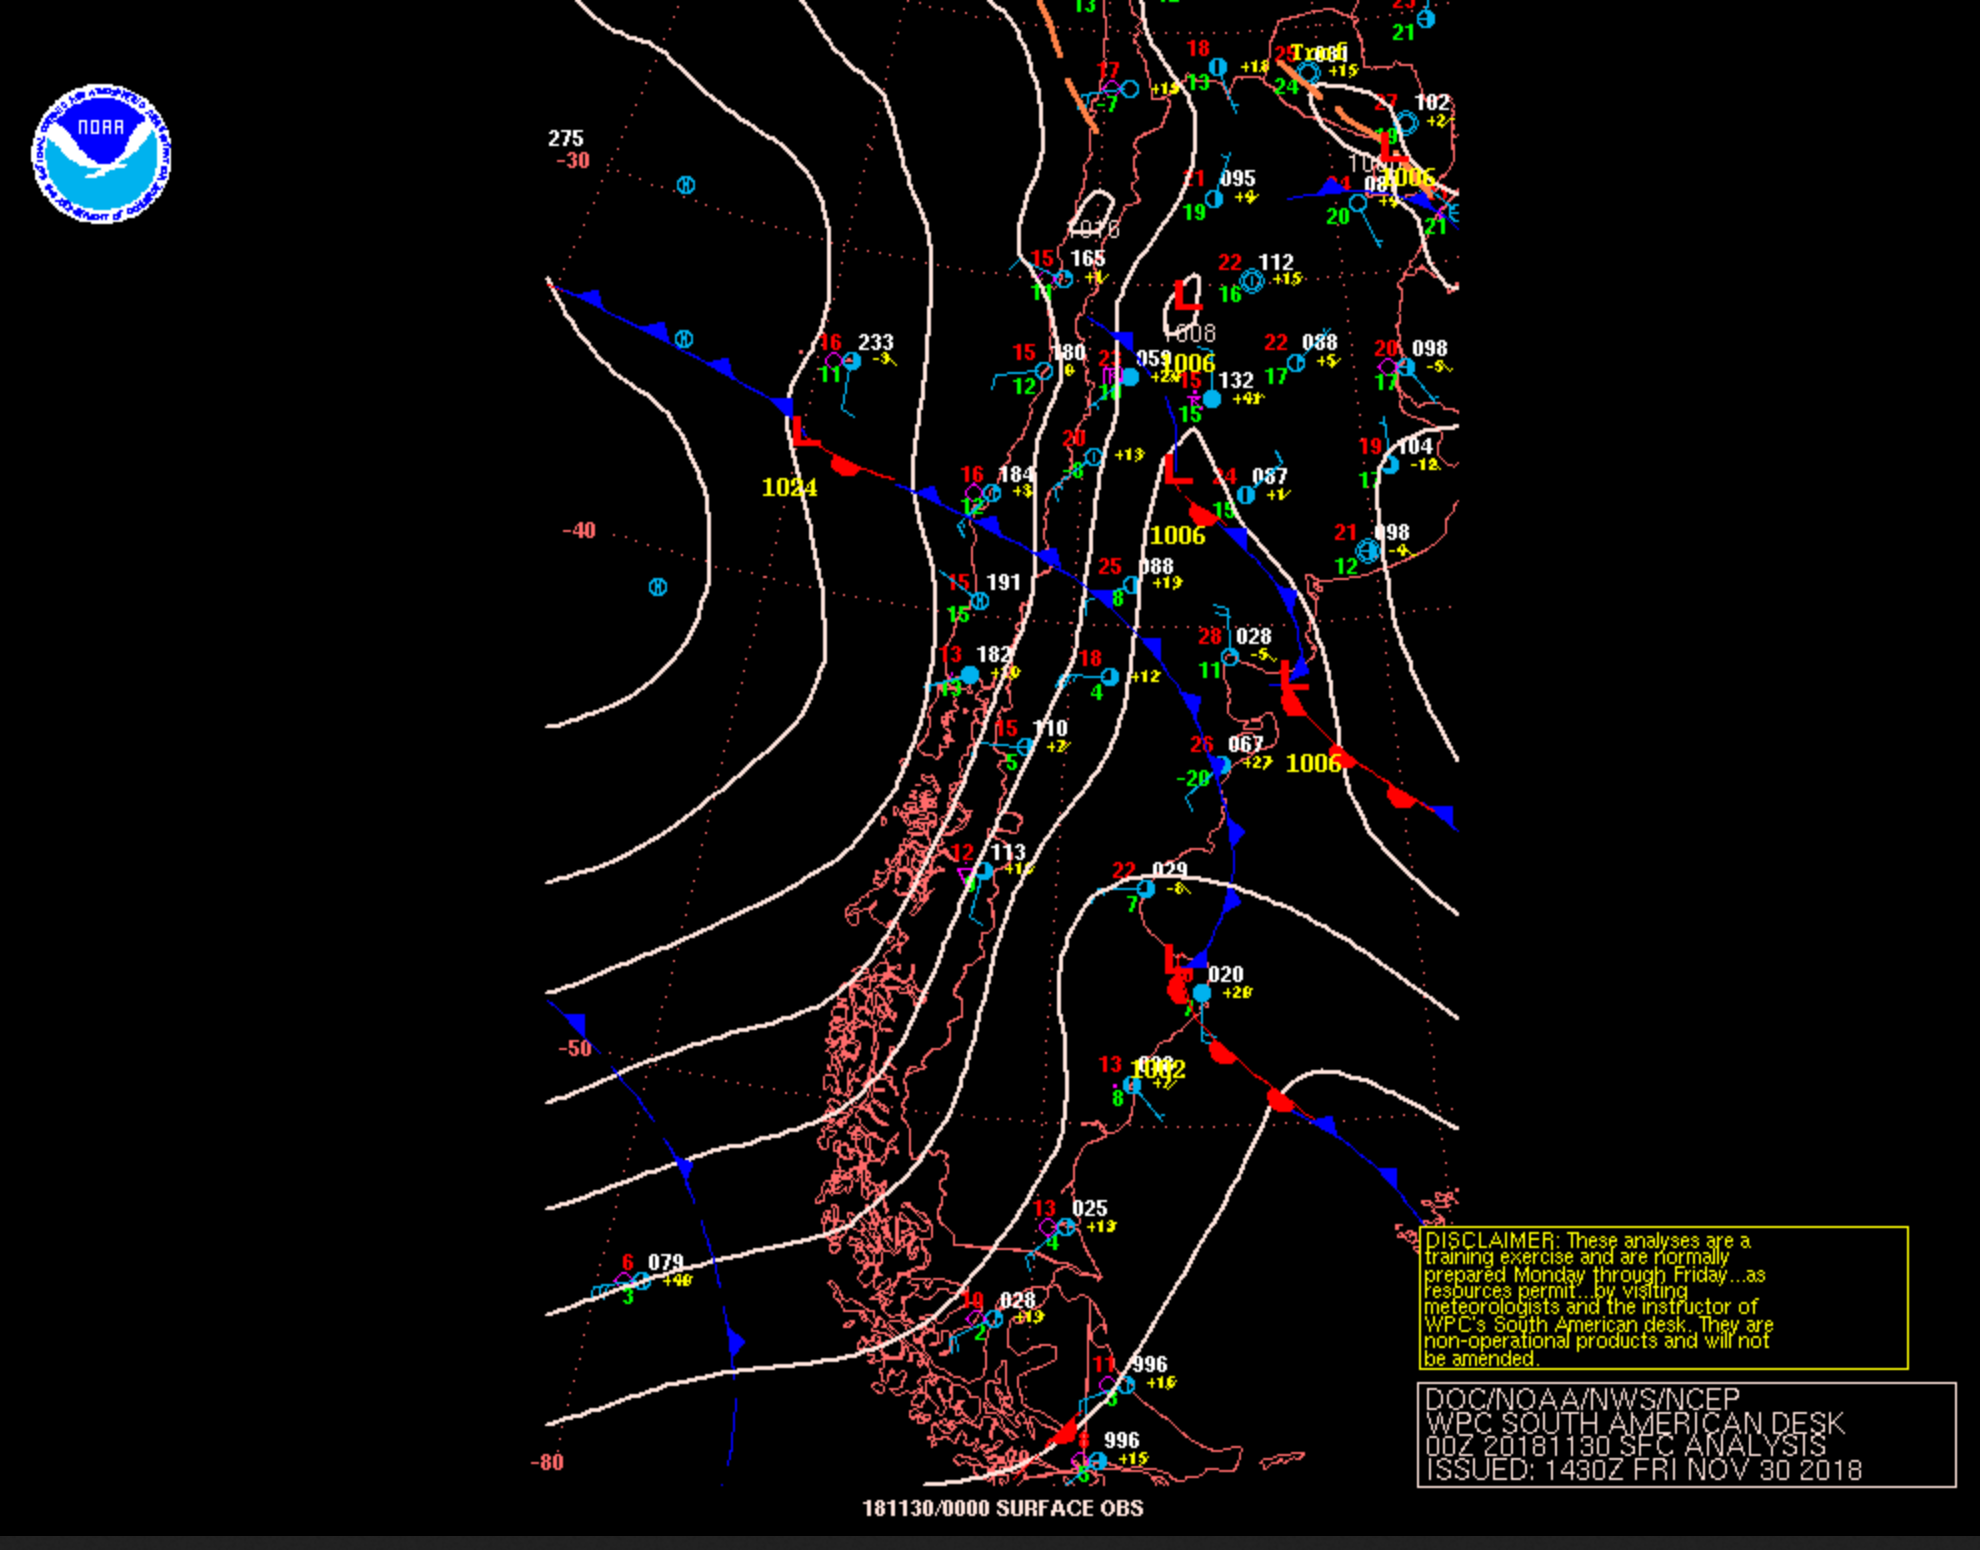
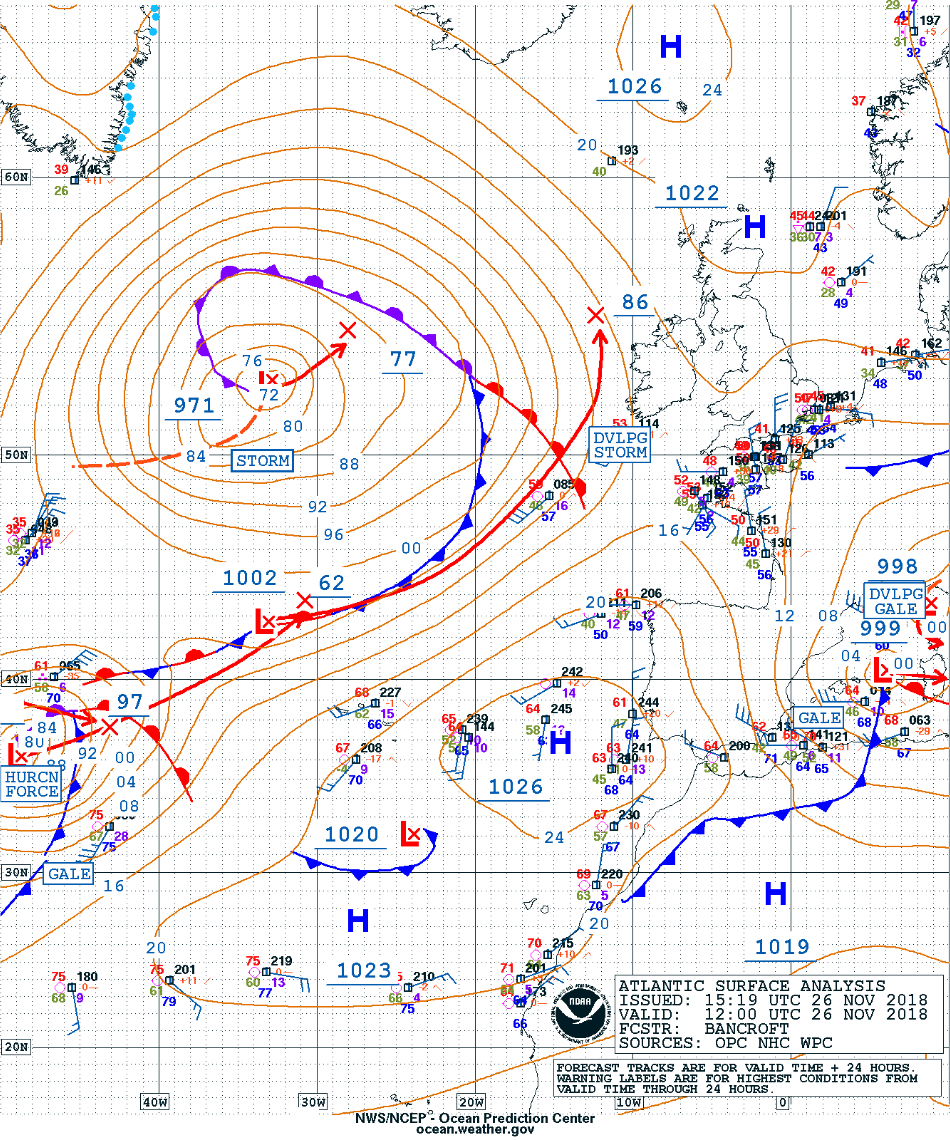
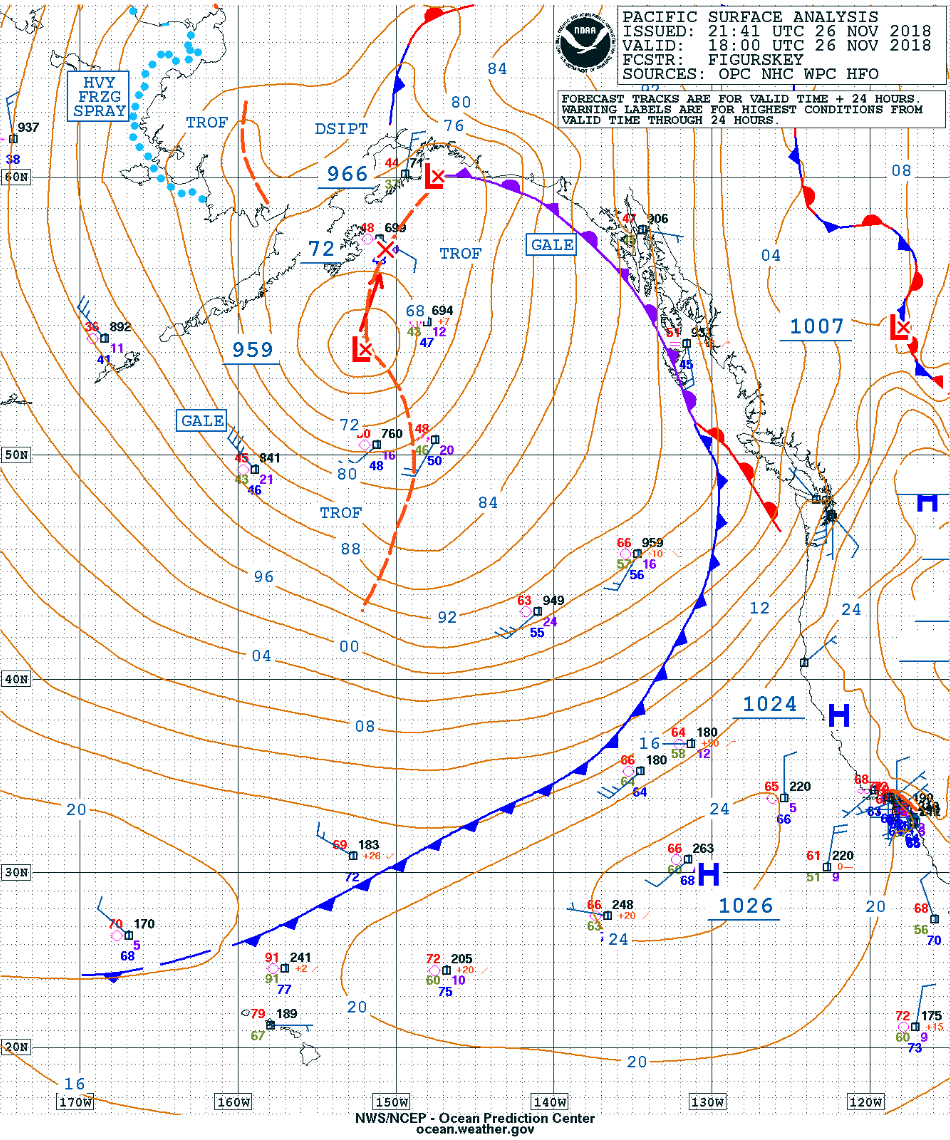
![Surface analyses from 12 UTC on 26 November to 00 UTC on 27 November [click to enlarge]](https://cimss.ssec.wisc.edu/satellite-blog/wp-content/uploads/sites/5/2018/11/181126_surface_analysis_anim.gif)
![GOES-17 Low-level (7.3 µm), Mid-level (6.9 µm) and Upper-level (6.2 µm) Water Vapor images [click to play animation | MP4]](https://cimss.ssec.wisc.edu/satellite-blog/wp-content/uploads/sites/5/2018/11/181125_goes17_waterVapor_standing_waves_Hawaii_anim.gif)
![GOES-17 "Clean" Infrared Window (10.3 µm) and Near-Infrared "Cirrus" (1.37 µm) images [click to play animation | MP4]](https://cimss.ssec.wisc.edu/satellite-blog/wp-content/uploads/sites/5/2018/11/181125_goes17_infraredWindow_nearInfraredCirrus_standing_waves_Hawaii_anim.gif)
![GOES-17 images of all 16 ABI bands [click to play animation | MP4]](https://cimss.ssec.wisc.edu/satellite-blog/wp-content/uploads/sites/5/2018/11/181125_goes17_16panel_standing_waves_HI_anim.gif)
![GOES-15 Water Vapor (6.5 µm, keft), Infrared Window (10.7 µm, center) and Infraered CO2 (13.3 µm, right) images [click to play animation | MP4]](https://cimss.ssec.wisc.edu/satellite-blog/wp-content/uploads/sites/5/2018/11/181125_goes15_waterVapor_infraredWindow_infraredCO2_HI_anim.gif)
![GOES-17 Cloud Type product [click to play animation | MP4]](https://cimss.ssec.wisc.edu/satellite-blog/wp-content/uploads/sites/5/2018/11/181125_goes17_cloudType_HI_anim.gif)
![GOES-17 Cloud Top Temperature product [click to play animation | MP4]](https://cimss.ssec.wisc.edu/satellite-blog/wp-content/uploads/sites/5/2018/11/181125_goes17_cloudTopTemperature_HI_anim.gif)
![GOES-17 Cloud Top Height product [click to play animation | MP4]](https://cimss.ssec.wisc.edu/satellite-blog/wp-content/uploads/sites/5/2018/11/181125_goes17_cloudTopHeight_HI_anim.gif)
![GOES-17 False Color RGB images [click to play animation | MP4]](https://cimss.ssec.wisc.edu/satellite-blog/wp-content/uploads/sites/5/2018/11/181125_goes17_falsecolor_rgb_HI_anim.gif)
![Suomi NPP VIIRS Day/Night Band (0.7 µm) and Infrared Window (11.45 µm) images [click to enlarge]](https://cimss.ssec.wisc.edu/satellite-blog/wp-content/uploads/sites/5/2018/11/181124_suomiNPP_viirs_dayNightBand_infraredWindow_AK_2_anim.gif)
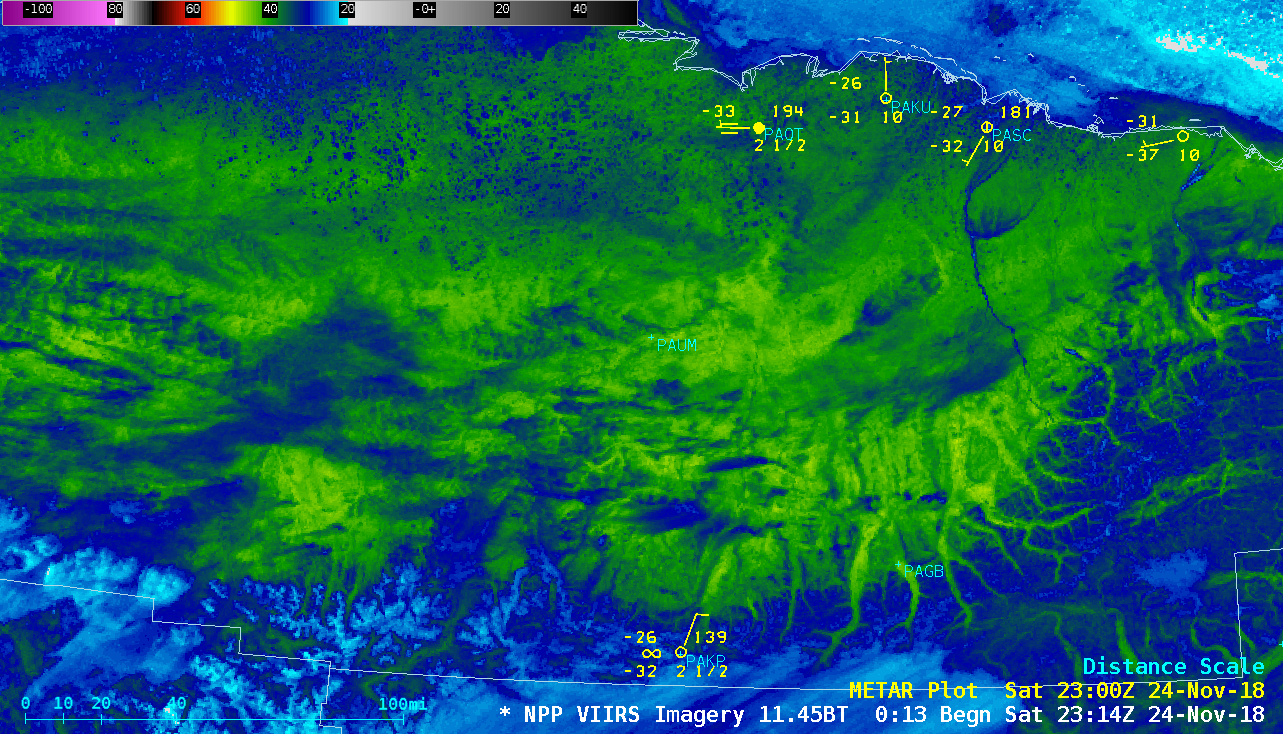
![Suomi NPP VIIRS Infrared Window (11.45 µm) image at 2314 UTC [click to enlarge]](https://cimss.ssec.wisc.edu/satellite-blog/wp-content/uploads/sites/5/2018/11/ak_viirs_ir_paum_zoom_1-20181124_231420.png)
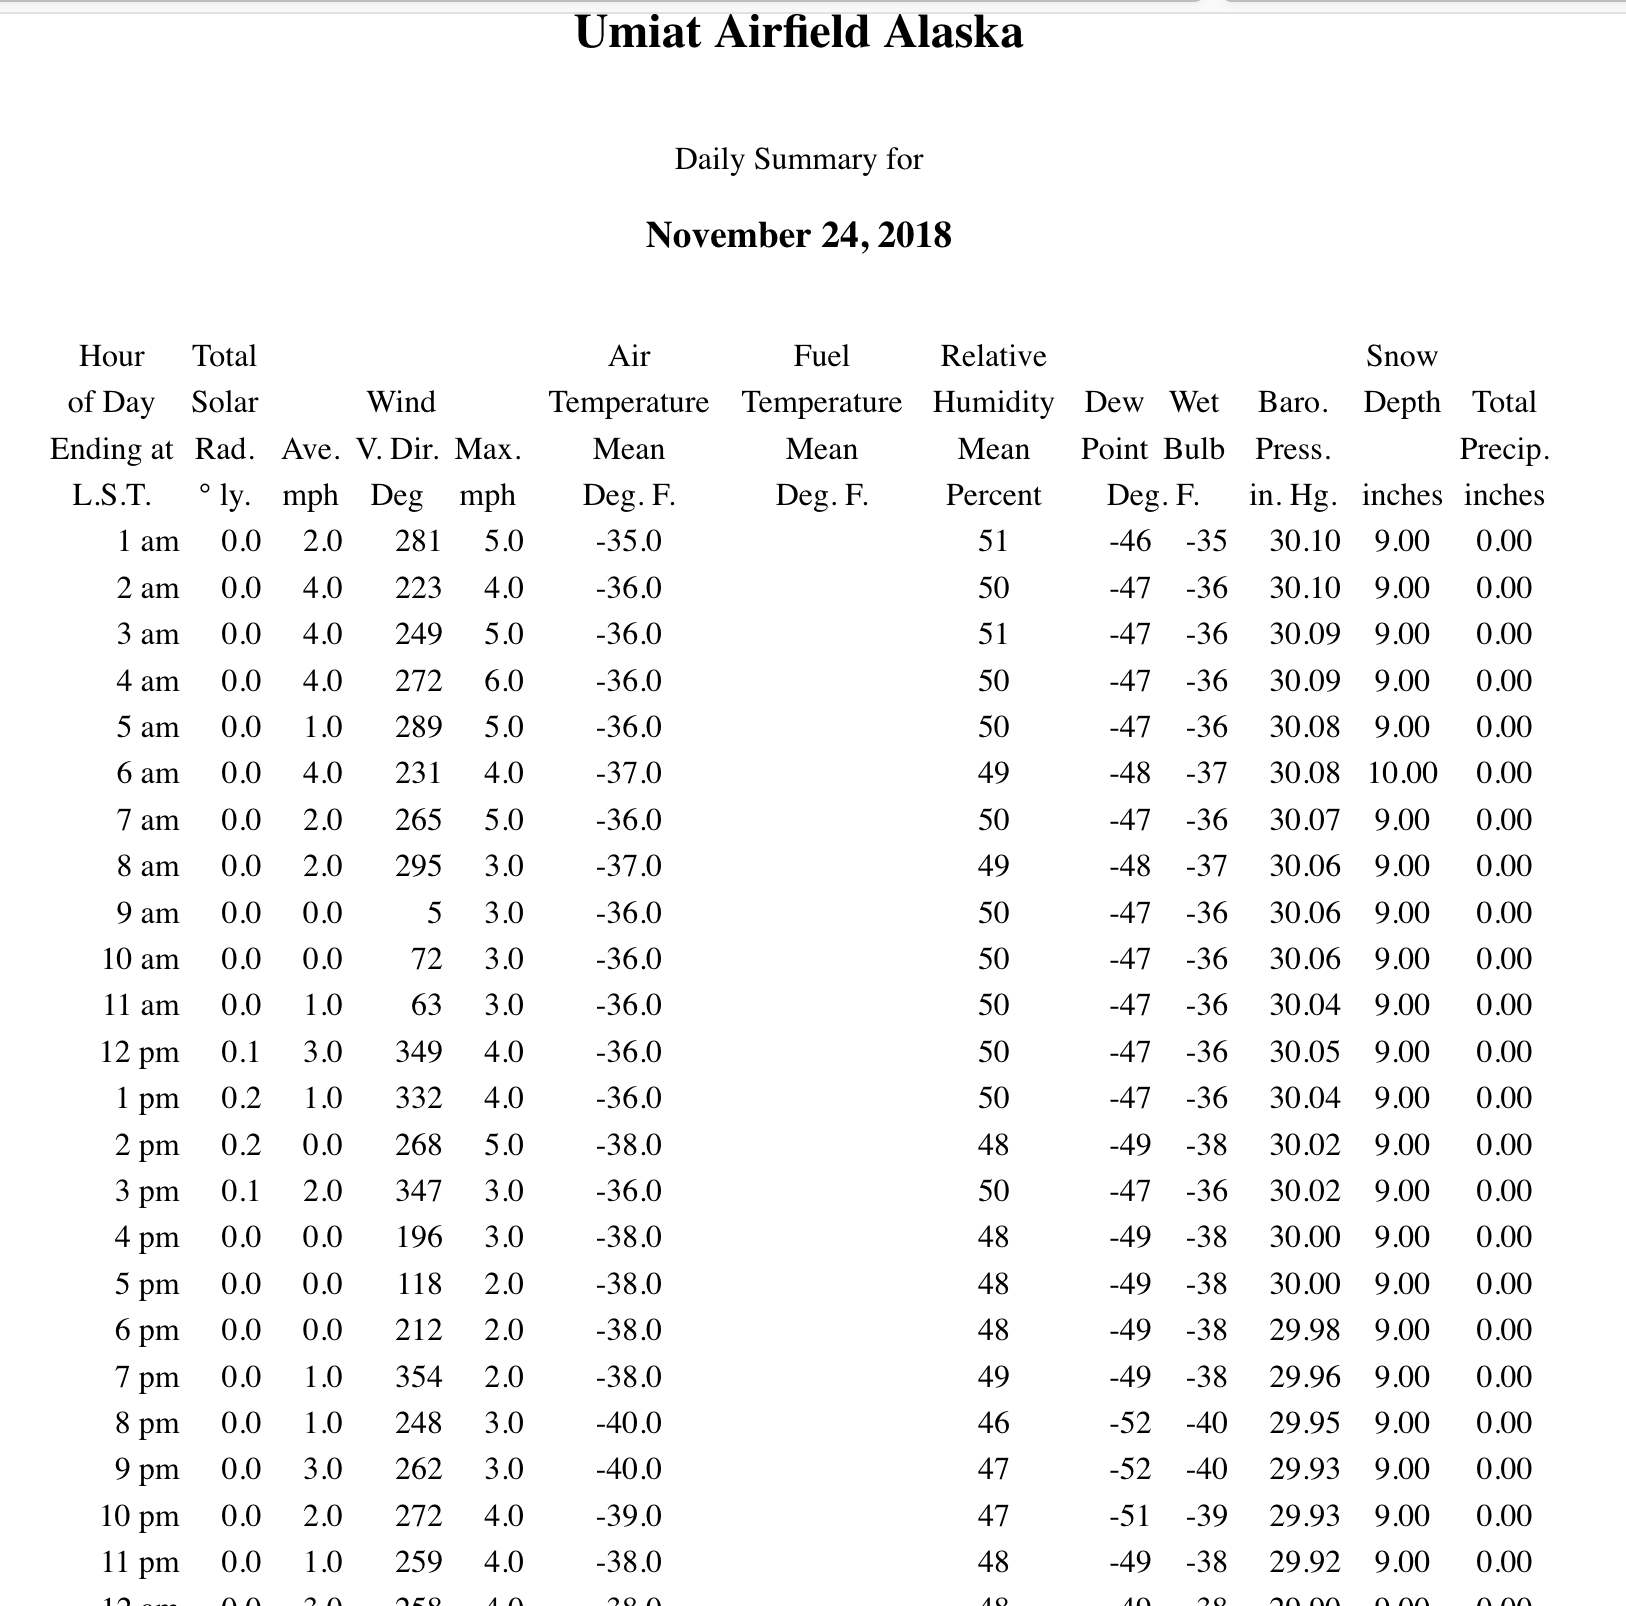
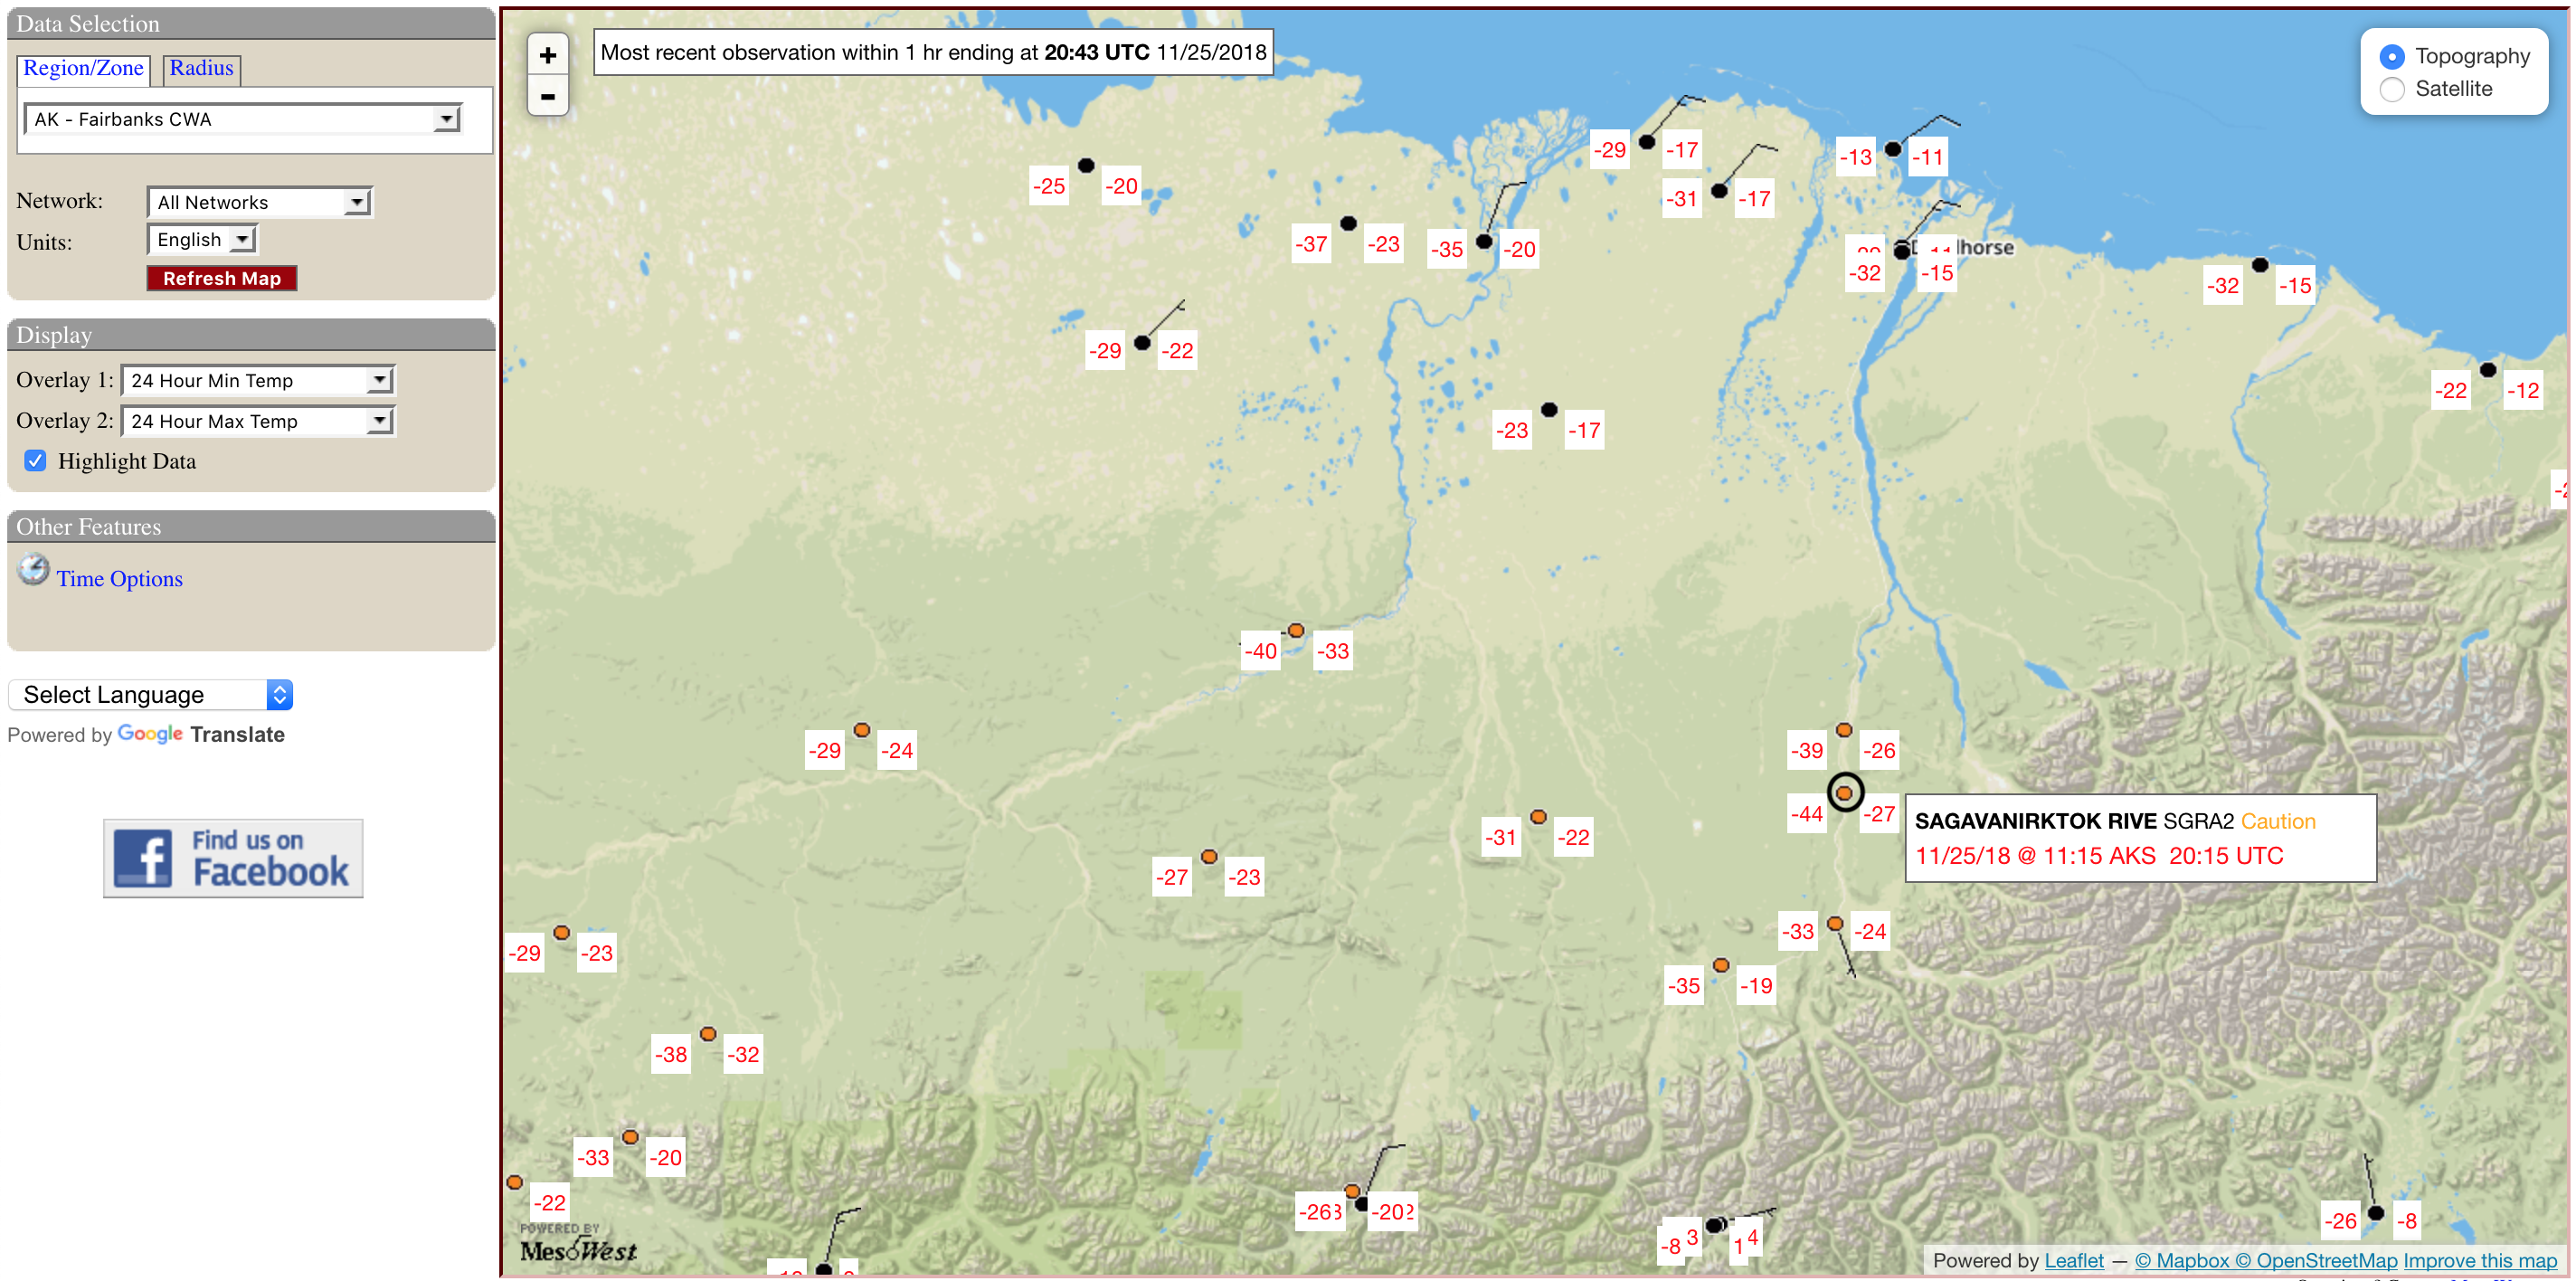
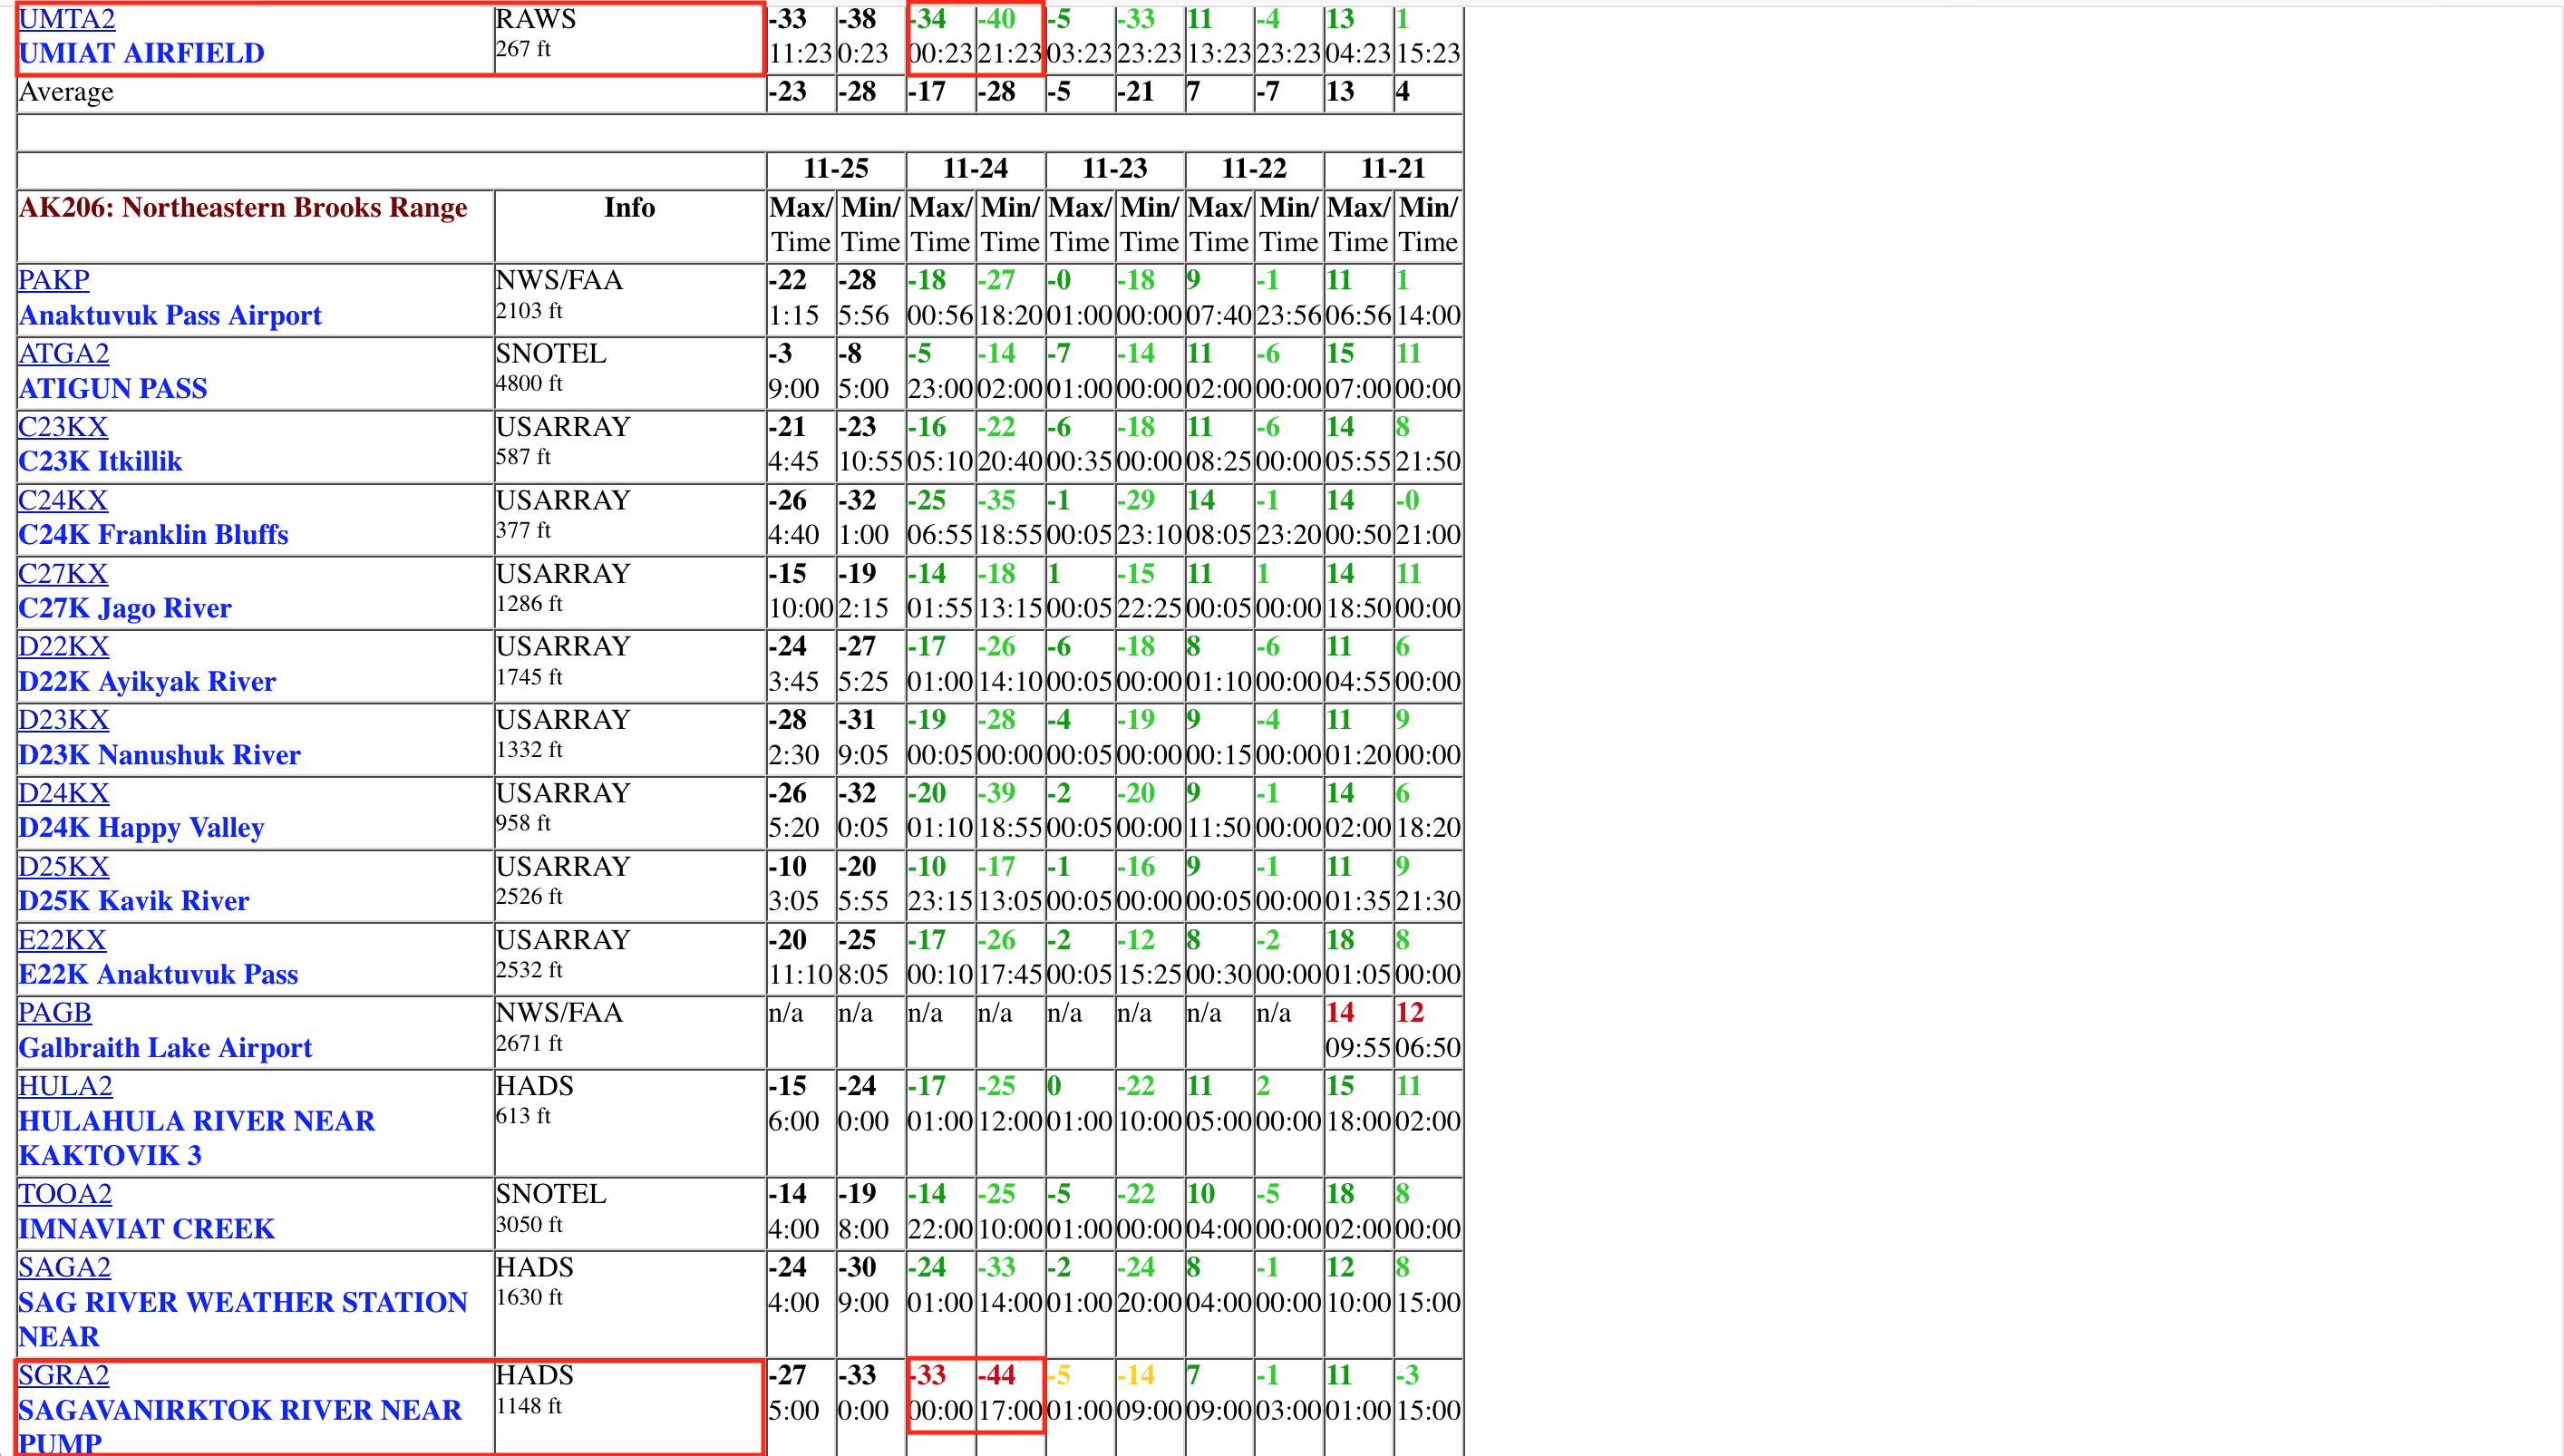
![Minimum and maximum temperatures for the 24-hour period ending at 20 UTC on 25 November [click to enlarge]](https://cimss.ssec.wisc.edu/satellite-blog/wp-content/uploads/sites/5/2018/11/181125_20utc_24hour_maximum_minimum_temperatures_Umiat_AK.png)
