* GOES-17 images posted here are preliminary and non-operational *GOES-17 arrived at its GOES-West position of 137.2º W longitude on 13 November 2018, and began to transmit imagery via GOES Re-Broadcast (GRB) at 1500 UTC and the AWIPS Satellite Broadcast Network (SBN) at 1700 UTC on 15 November (NOAA/NESDIS article). A... Read More
![Full Disk images of the 16 ABI bands from GOES-17 [click to play MP4 animation]](https://cimss.ssec.wisc.edu/satellite-blog/wp-content/uploads/sites/5/2018/11/181115_1500utc_goes17_visible_FD.png)
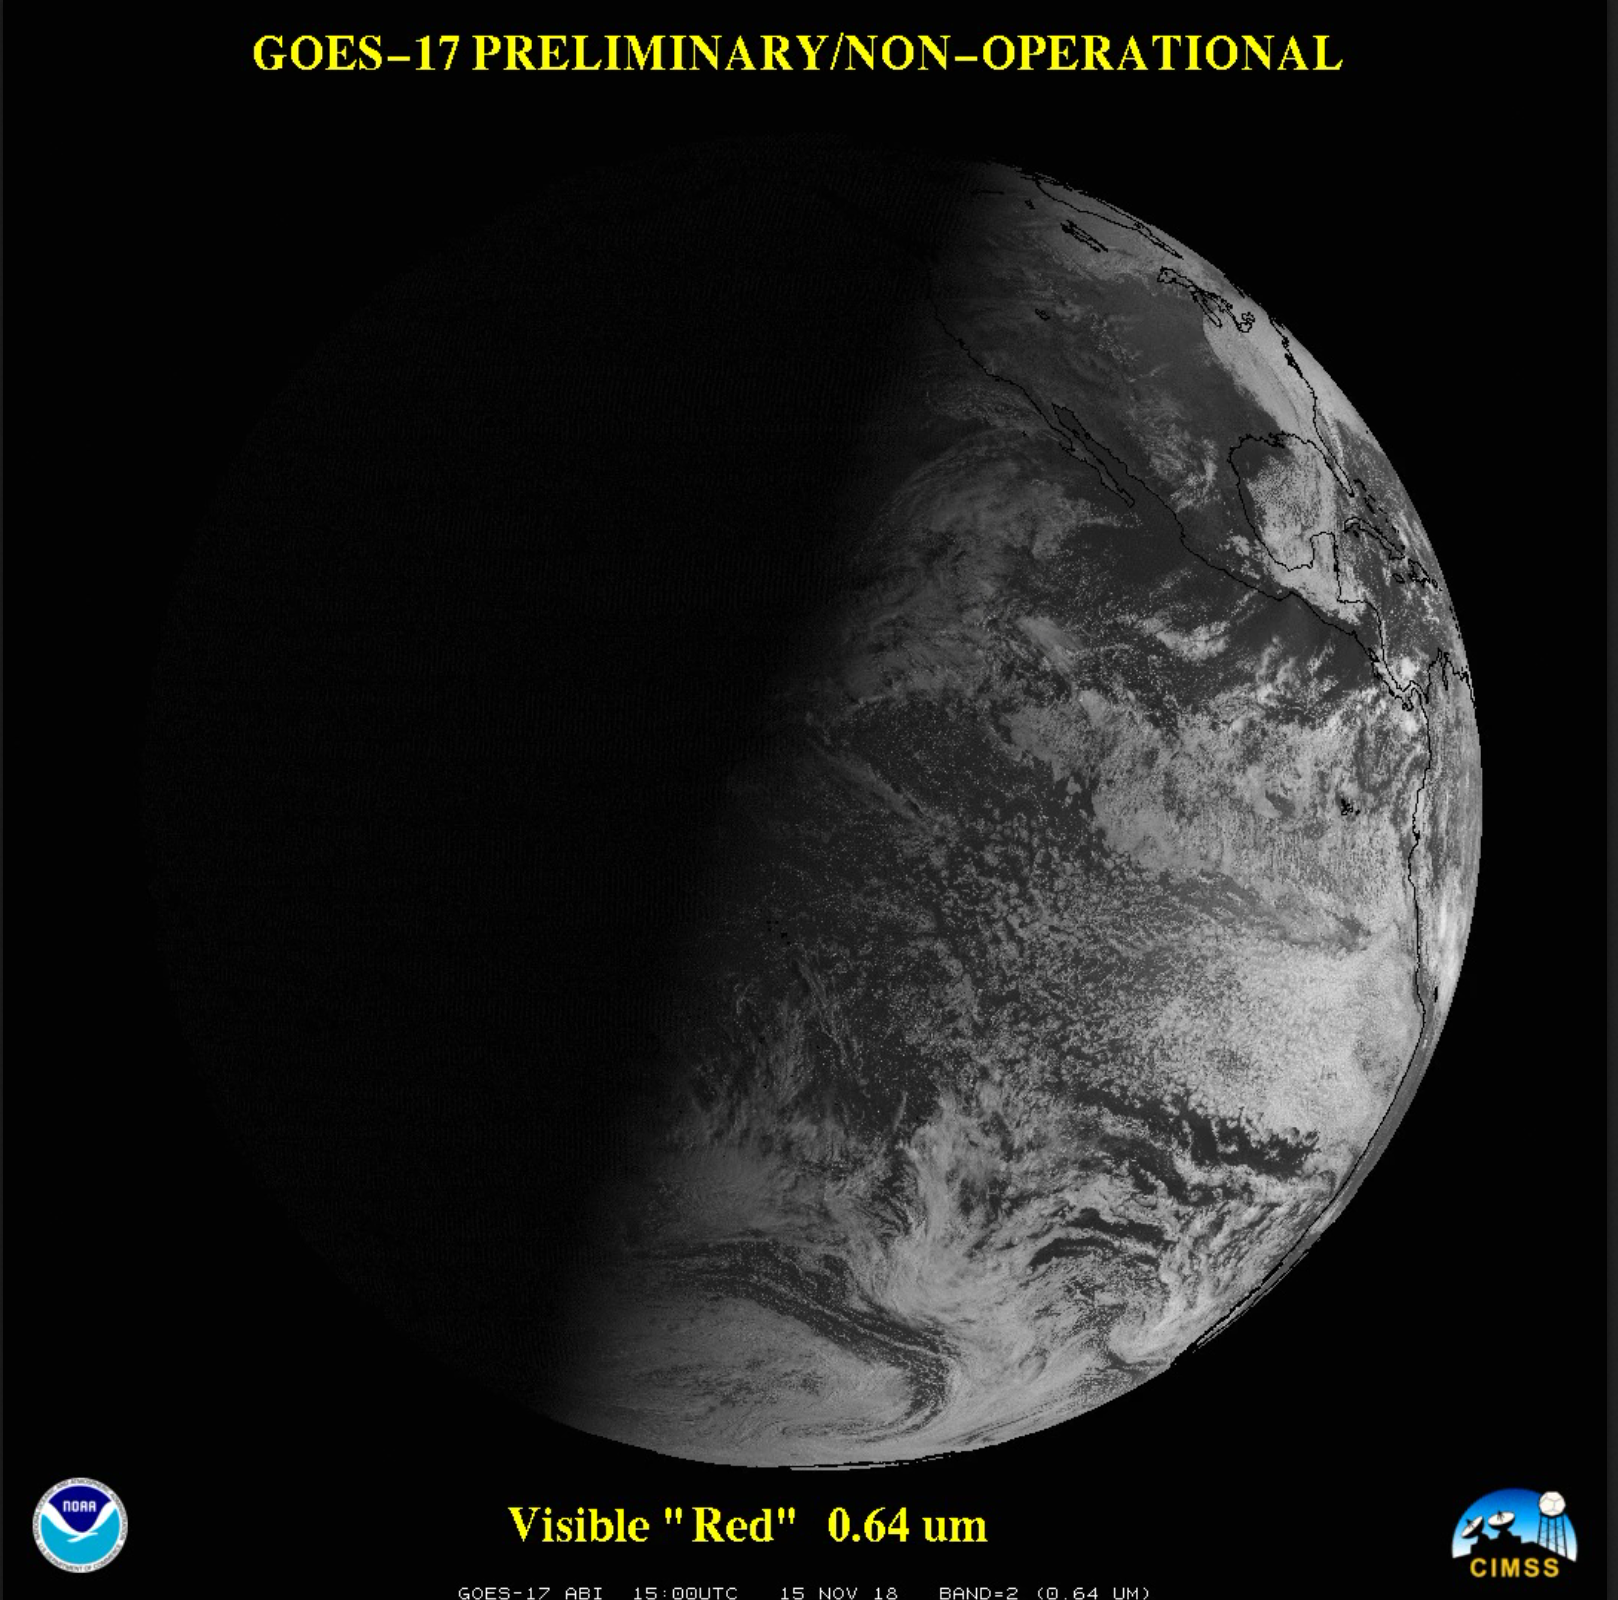
1500 UTC Full Disk images of the 16 ABI bands from GOES-17 [click to play MP4 animation]
* GOES-17 images posted here are preliminary and non-operational *
GOES-17 arrived at its GOES-West position of 137.2º W longitude on 13 November 2018, and began to transmit imagery via GOES Re-Broadcast (GRB) at 1500 UTC and the AWIPS Satellite Broadcast Network (SBN) at 1700 UTC on 15 November (NOAA/NESDIS article). A toggle between Full Disk images of the 16 ABI spectral bands from GOES-17 at 1500 UTC is shown above, with a 16-panel multi-band animation from 1515-2300 UTC shown below..
![Full Disk images from the 16 ABI bands of GOES-17 [click to play MP4 animation]](https://cimss.ssec.wisc.edu/satellite-blog/wp-content/uploads/sites/5/2018/11/181115_2000utc_goes17_FD_16panel.png)
Full Disk images from the 16 ABI bands of GOES-17 [click to play MP4 animation]
Full Disk GOES-17 Low-level (
7.3 µm), Mid-level (
6.9 µm) and Upper-level (
6.2 µm) Water Vapor images are shown below.
![GOES-17 Low-level (7.3 µm), Mid-level (6.9 µm) and Upper-level (6.2 µm) Water Vapor images [click to play animation | MP4]](https://cimss.ssec.wisc.edu/satellite-blog/wp-content/uploads/sites/5/2018/11/G17_FD_WV_B9_15NOV2018_2018319_150038_GOES-17_0001PANEL.GIF)
GOES-17 Low-level (7.3 µm), Mid-level (6.9 µm) and Upper-level (6.2 µm) Water Vapor images [click to play animation | MP4]
The improved spatial resolution of GOES-17 (vs GOES-15) was very obvious at higher latitudes — a closer look at GOES-17 Water Vapor imagery
(below) showed good detail associated with a gale-force occluded low in the Gulf of Alaska and a weaker low in the Bering Sea (
surface analyses). Note that signatures of the higher terrain of mountain ranges across south-central and southeastern Alaska could be seen on the 7.3 µm and to a lesser extent the 6.9 µm images.
![GOES-17 Low-level (7.3 µm), Mid-level (6.9 µm) and Upper-level (6.2 µm) Water Vapor images [click to play animation | MP4]](https://cimss.ssec.wisc.edu/satellite-blog/wp-content/uploads/sites/5/2018/11/G17_WV_AK_B9_15NOV2018_2018319_150038_GOES-17_0001PANEL.GIF)
GOES-17 Low-level (7.3 µm), Mid-level (6.9 µm) and Upper-level (6.2 µm) Water Vapor images [click to play animation | MP4]
After sunrise, GOES-17 “Red” Visible (
0.64 µm) images
(below) provided a compelling view of the snow-covered Alaska Range
(which includes Denali at 20,320 feet / 6,194 meters), the Wrangell Mountains
(which includes Mt. Wrangell at 14,163 feet / 4,317 meters) and the Chugach Mountains
(which includes Mount Marcus Baker, 13,176 feet / 4,016 meters). In particular, note the long shadows cast by Denali and the Alaska Range in the upper left portion of the images.
GOES-17 “Red” Visible (0.64 µm) images, with hourly plots of surface reports [click to play animation | MP4]
For a short time a GOES-17
Mesoscale Domain Sector was positioned over Hawai’i, providing images at 1-minute intervals
(below).

GOES-17 “Red” Visible (0.64 µm) images, with hourly plots of surface observations [click to play animation | MP4]
Guam and the Northern Mariana Islands could be seen on the far western limb of Full Disk GOES-17 images
(below). A few isolated tropical thunderstorms could be seen developing and collapsing in the vicinity of the islands.
![GOES-17 "Red" Visible (0.64 µm) images, with hourly plots of surface observations [click to play animation | MP4]](https://cimss.ssec.wisc.edu/satellite-blog/wp-content/uploads/sites/5/2018/11/G17_VIS_GUAM_15NOV2018_2018319_204538_GOES-17_0001PANEL.GIF)
GOES-17 “Red” Visible (0.64 µm) images, with hourly plots of surface observations [click to play animation | MP4]
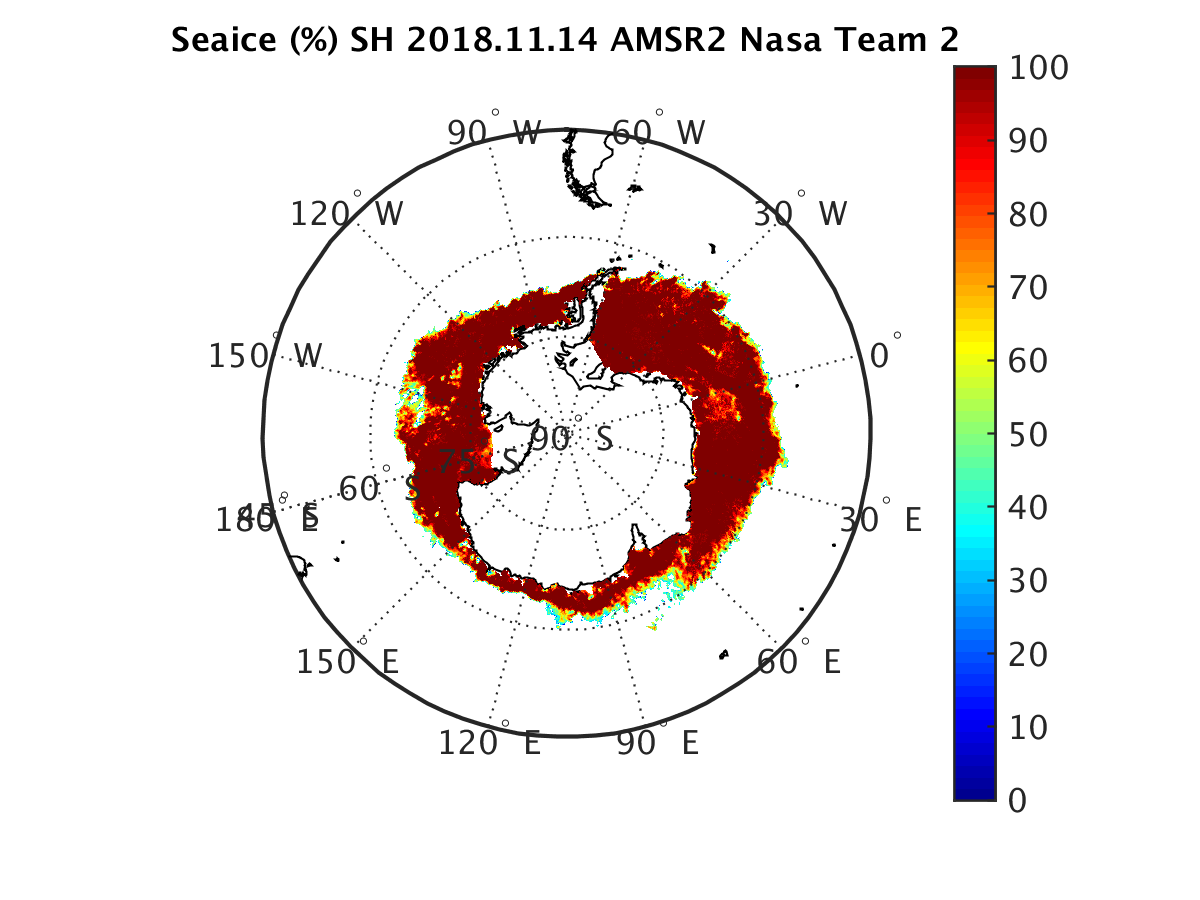
A portion of
West Antarctica could be seen on the far southern limb of GOES-17 Full Disk images, along with a storm system in the South Pacific Ocean
(below). Through gaps in the clouds, the northern edge of the Antarctic
sea ice (
source) was also evident in the Visible imagery.
![GOES-17 "Red" Visible (0.64 µm) images [click to play animation | MP4]](https://cimss.ssec.wisc.edu/satellite-blog/wp-content/uploads/sites/5/2018/11/G17_VIS_SH_15NOV2018_2018319_150038_GOES-17_0001PANEL.GIF)
GOES-17 “Red” Visible (0.64 µm) and “Clean” Infrared Window (10.3 µm) images [click to play animation | MP4]
Over the Lower 48 states, AWIPS images of 1-minute GOES-17 “Red” Visible (
0.64 µm) and Shortwave Infrared (
3.9 µm) data
(below) showed the smoke and thermal anomaly
(darker red pixels near the center of the images) associated with the ongoing
Camp Fire in northern California.
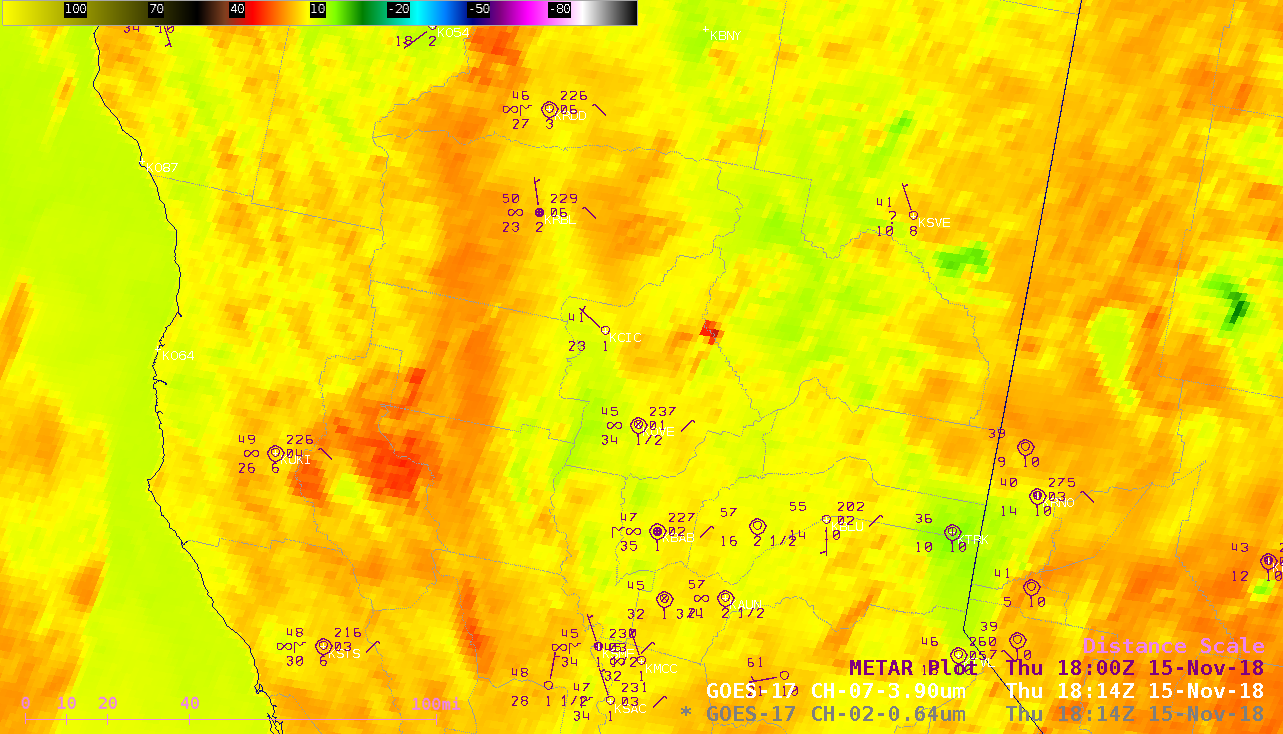
GOES-17 “Red” Visible (0.64 µm) and Shortwave Infrared (3.9 µm) images, with hourly plots of surface reports [click to play animation | MP4]
Farther to the south in central California, a comparison of 1-minute Shortwave Infrared images from GOES-16
(GOES-East) and GOES-17 revealed differences in the size and orientation of hot pixels of the
Adler/Mountaineer/Moses Fires burning northeast of Porterville KPTV in the
foothills of the Sierra Nevada. These differences were due to the view angle from the 2 satellites — 62 degrees from GOES-16 over the Atlantic Ocean, vs. only 41 degrees from GOES-17 over the Pacific Ocean. There was a navigational jump with GOES-17 from 1831-1837 UTC, so those images were removed from the animation.
![GOES-16 vs GOES-17 Shortwave Infrared (3.9 µm) images [click to play MP4 animation]](https://cimss.ssec.wisc.edu/satellite-blog/wp-content/uploads/sites/5/2018/11/ca_swir_overlap-20181115_201026.png)
GOES-16 vs GOES-17 Shortwave Infrared (3.9 µm) images [click to play MP4 animation]
View only this post
Read Less
![GOES-16 Upper-level (6.2 µm, top), Mid-level (6.9 µm, center) and Low-level (7.3 µm, bottom) Water Vapor images [click to play animation | MP4]](https://cimss.ssec.wisc.edu/satellite-blog/wp-content/uploads/sites/5/2018/11/181119_goes16_waterVapor_Fuego_anim.gif)
![GOES-16 Ash Height product [click to play animation | MP4]](https://cimss.ssec.wisc.edu/satellite-blog/wp-content/uploads/sites/5/2018/11/181119_goes16_Fuego_ash_height_anim.gif)
![GOES-16 Split Window difference (10.3-12.3 µm) image, with METAR surface reports [click to enlarge]](https://cimss.ssec.wisc.edu/satellite-blog/wp-content/uploads/sites/5/2018/11/181119_1400utc_goes16_splitWindow_mgsj_metar.png)
![GOES-16 Low-level (7.3 µm, left). Mid-level (6.9 µm, center) and Upper-level (6.2 µm, right) Water Vapor images [click to play animation | MP4]](https://cimss.ssec.wisc.edu/satellite-blog/wp-content/uploads/sites/5/2018/11/181117_goes16_waterVapor_Antares_launch_Wallops_anim.gif)
![GOES-16 Near-Infrared "Snow/Ice" (1.61 µm, left). Near-Infrared "Cloud Particle Size" (2.24 µm, center), Shortwave Infrared (3.9 µm, right) and "Clean" Infrared Window (10.3 µm) images [click to play animation | MP4]](https://cimss.ssec.wisc.edu/satellite-blog/wp-content/uploads/sites/5/2018/11/181117_goes16_nearInfrared_shortwaveInfrared_waterVapor_Antares_launch_Wallops_anim.gif)
![GOES-16 Near-Infrared "Snow/Ice" (1.61 µm, top left). Low-level Water Vapor (7.3 µm, top right), Mid-level Water Vapor (6.9 µm, bottom left) and Upper-level Water Vapor (6.2 µm, bottom right) images [click to play animation | MP4]](https://cimss.ssec.wisc.edu/satellite-blog/wp-content/uploads/sites/5/2018/11/181117_goes16_nearInfrared_waterVapor_Antares_launch_Wallops_anim.gif)
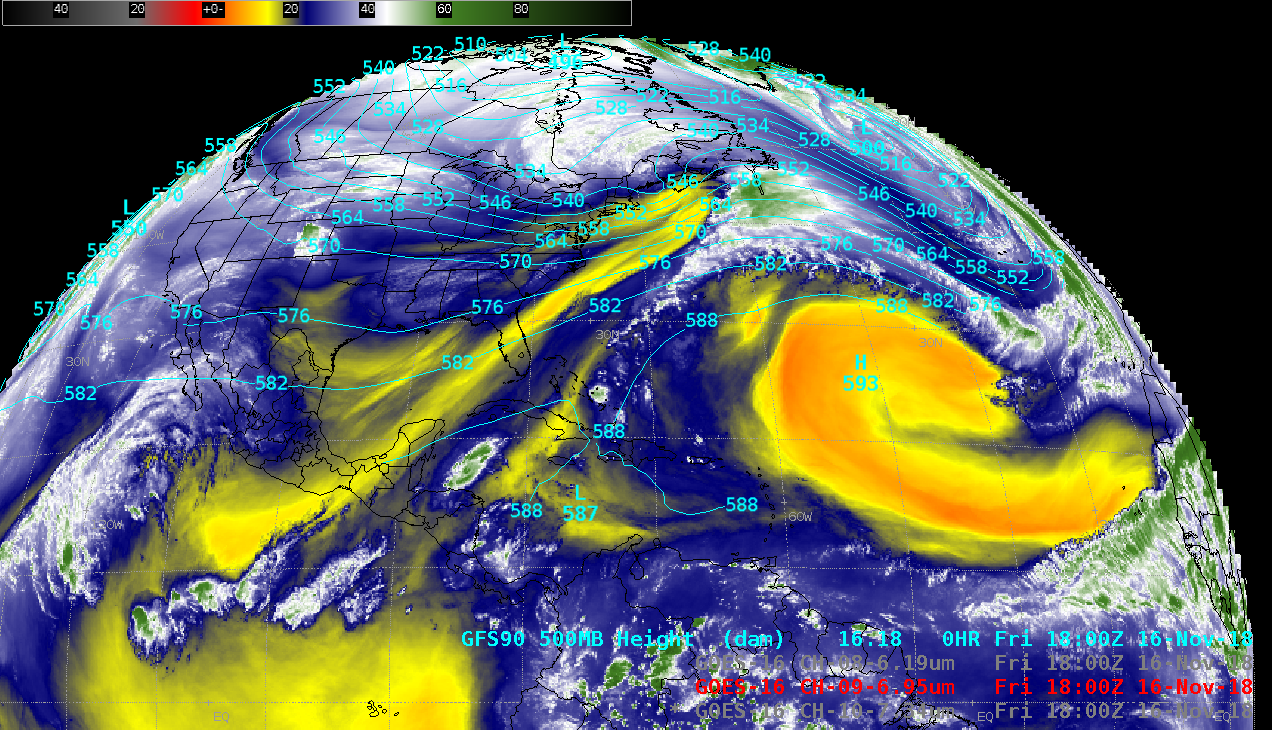
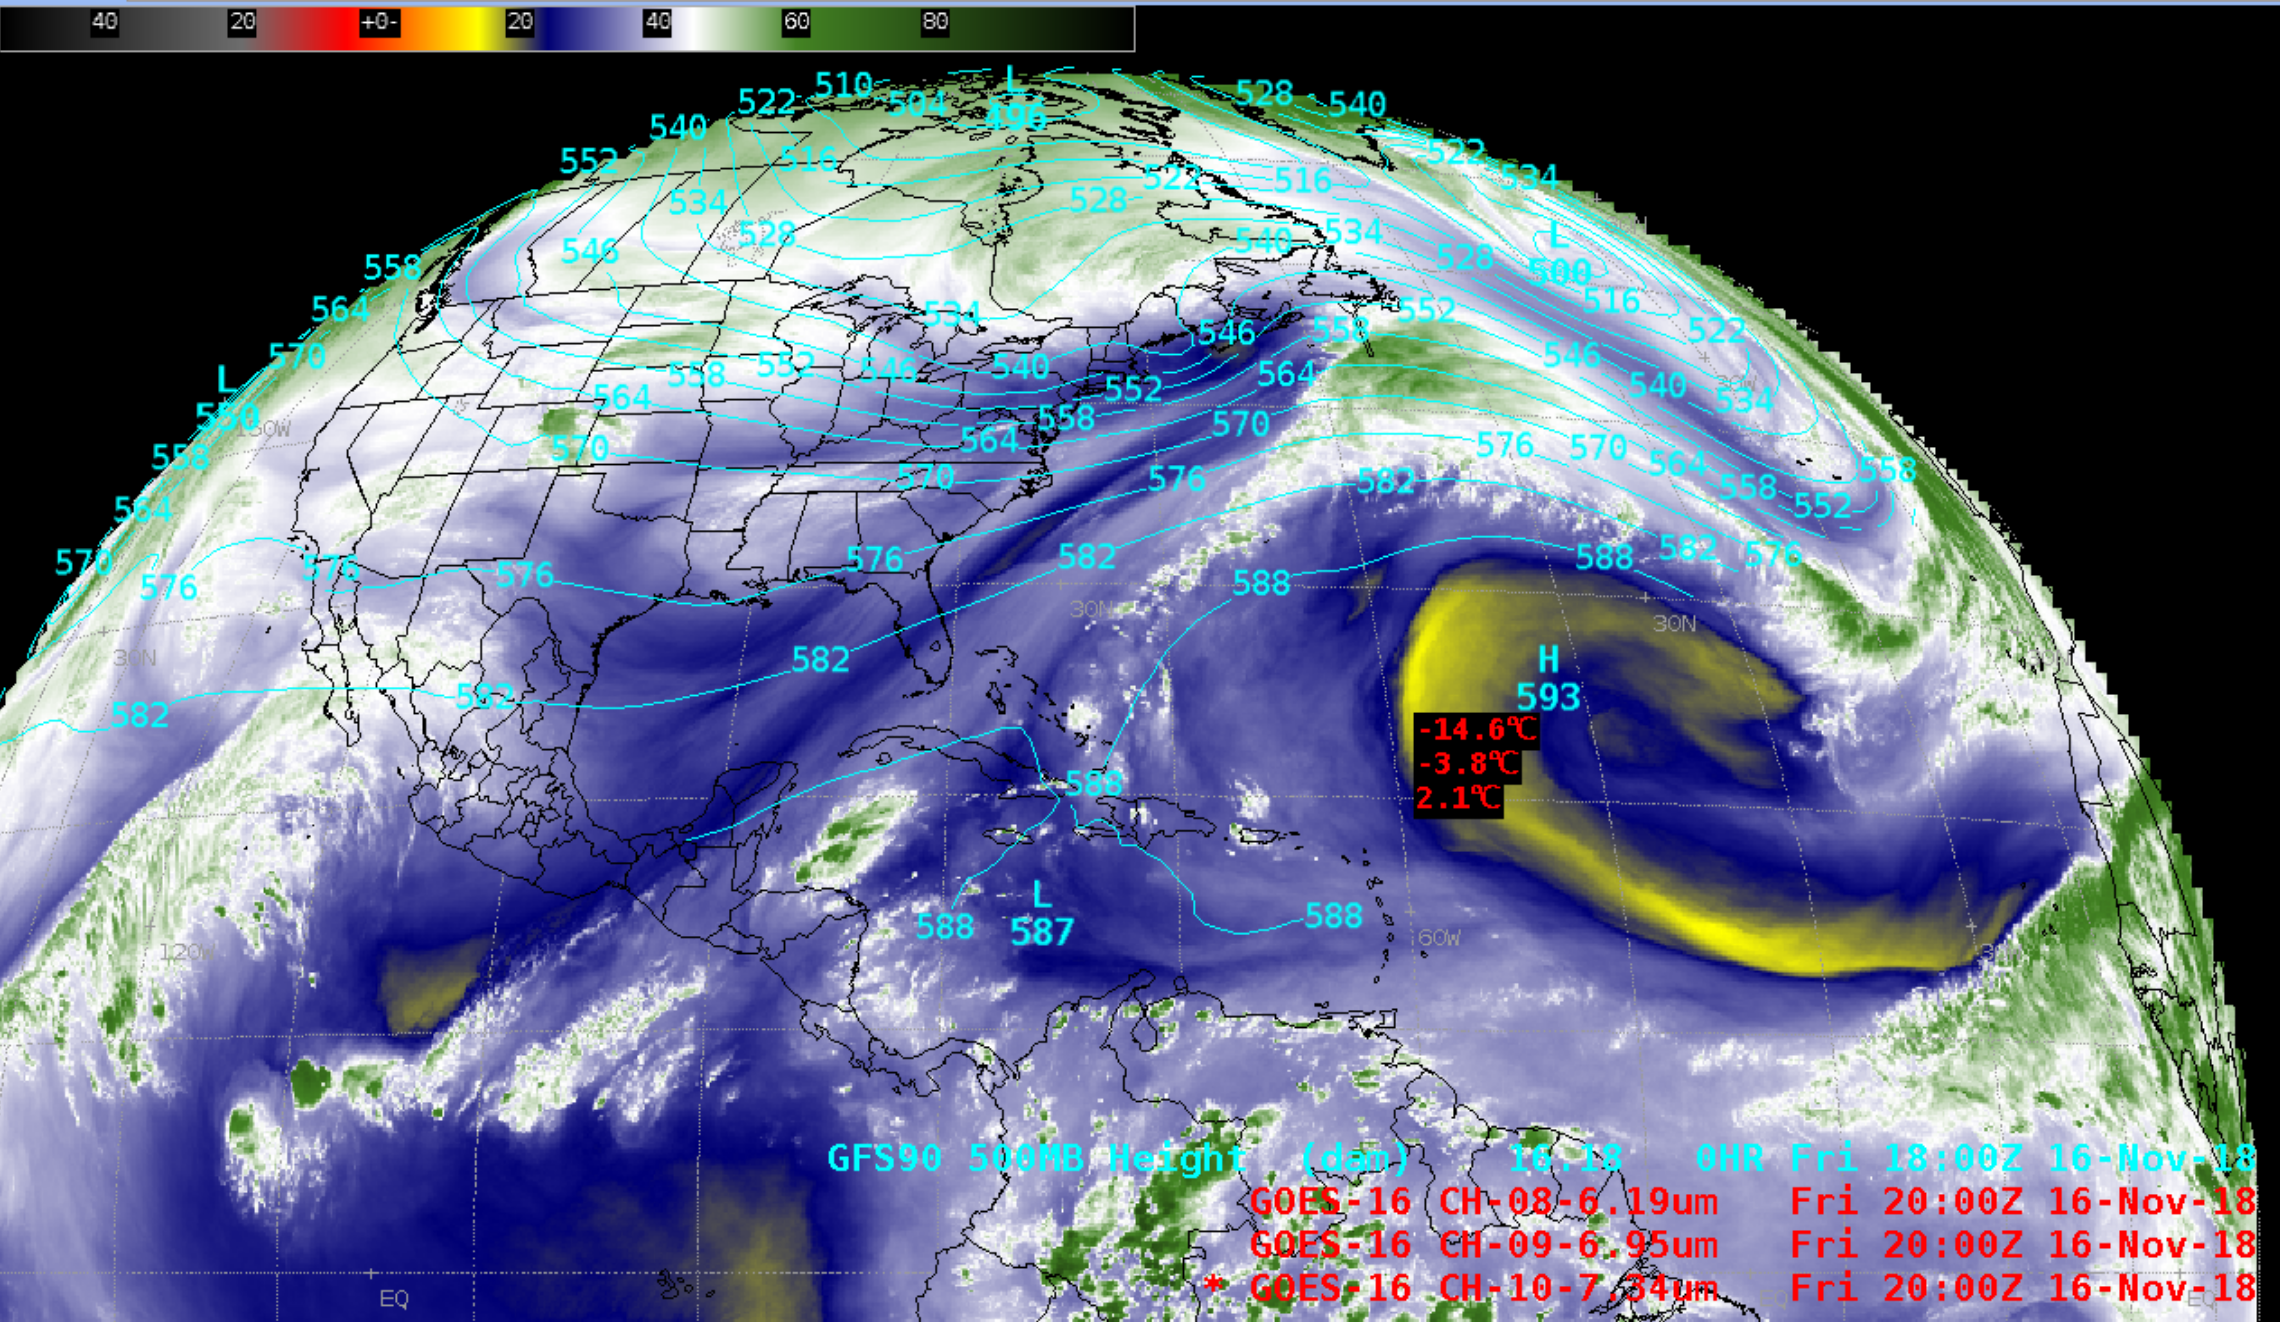
![GOES-16 Low-level (7.3 µm), Mid-level (6.9 µm) and Upper-level (6.2 µm) Water Vapor images [click to play animation | MP4]](https://cimss.ssec.wisc.edu/satellite-blog/wp-content/uploads/sites/5/2018/11/181116_goes16_waterVapor_Atlantic_ridge_anim.gif)
![GOES-16 Upper-level (6.2 µm) Water Vapor image at 1700 UTC, with a swath of NUCAPS sounding availability [click to enlarge]](https://cimss.ssec.wisc.edu/satellite-blog/wp-content/uploads/sites/5/2018/11/181116_17utc_nucaps_swath.png)
![NUCAPS sounding profile within the driest air [click to enlarge]](https://cimss.ssec.wisc.edu/satellite-blog/wp-content/uploads/sites/5/2018/11/181116_17utc_nucaps_sounding_dry_air.png)
![GOES-16 Upper-level Water Vapor + Total Precipitable Water [click to play animation | MP4]](https://cimss.ssec.wisc.edu/satellite-blog/wp-content/uploads/sites/5/2018/11/181116_goes16_waterVapor_totalPrecipitableWater_Atlantic_anim.gif)
![GOES-17 Low-level (7.3 µm), Mid-level (6.9 µm) and Upper-level (6.2 µm) Water Vapor images [click to play animation | MP4]](https://cimss.ssec.wisc.edu/satellite-blog/wp-content/uploads/sites/5/2018/11/181115_goes17_waterVapor_Full_Disk_anim.gif)
![GOES-17 Low-level (7.3 µm), Mid-level (6.9 µm) and Upper-level (6.2 µm) Water Vapor images [click to play animation | MP4]](https://cimss.ssec.wisc.edu/satellite-blog/wp-content/uploads/sites/5/2018/11/181115_goes17_waterVapor_Alaska_anim.gif)
![GOES-17 "Red" Visible (0.64 µm) images, with hourly plots of surface observations [click to play animation | MP4]](https://cimss.ssec.wisc.edu/satellite-blog/wp-content/uploads/sites/5/2018/11/181115_goes17_visible_Guam_anim.gif)
![GOES-17 "Red" Visible (0.64 µm) images [click to play animation | MP4]](https://cimss.ssec.wisc.edu/satellite-blog/wp-content/uploads/sites/5/2018/11/181115_goes17_visible_infrared_Antarctica_anim.gif)
