A sequence of GOES-16 (GOES-East) Fire Temperature RGB, Shortwave Infrared (3.9 µm), Fire Temperature, Fire Power and Fire Area products (above) displayed signatures of widespread fires — a combination of prescribed burns and agricultural fires — across parts of the Deep South on 19 November 2019. Fire Temperature, Fire Power and Fire Area products are... Read More
![GOES-16 Fire Temperature RGB, Shortwave Infrared (3.9 µm), Fire Temperature, Fire Power and Fire Area products [click to play animation | MP4]](https://cimss.ssec.wisc.edu/satellite-blog/wp-content/uploads/sites/5/2019/11/gulf_fire_t-20191119_173125.png)
GOES-16 Fire Temperature RGB, Shortwave Infrared (3.9 µm), Fire Temperature, Fire Power and Fire Area products [click to play animation | MP4]
A sequence of GOES-16
(GOES-East) Fire Temperature RGB, Shortwave Infrared (
3.9 µm), Fire Temperature, Fire Power and Fire Area products
(above) displayed signatures of widespread fires — a combination of prescribed burns and agricultural fires — across parts of the Deep South on
19 November 2019. Fire Temperature, Fire Power and Fire Area products are components of the GOES Fire Detection and Characterization Algorithm (
SHyMet |
ATBD).
GOES-16 “Red” Visible (0.64 µm) images, with and without plots of surface observations, are shown below. While most of the fires were too small/brief to produce large smoke plumes, a prominent plume was associated with one of the hottest and most long-lived fires — which was likely a prescribed burn — in the Chickasawhay State Wildlife Management Area (located east of Hattiesburg/Laurel Airport KPIB) in southeastern Mississippi.
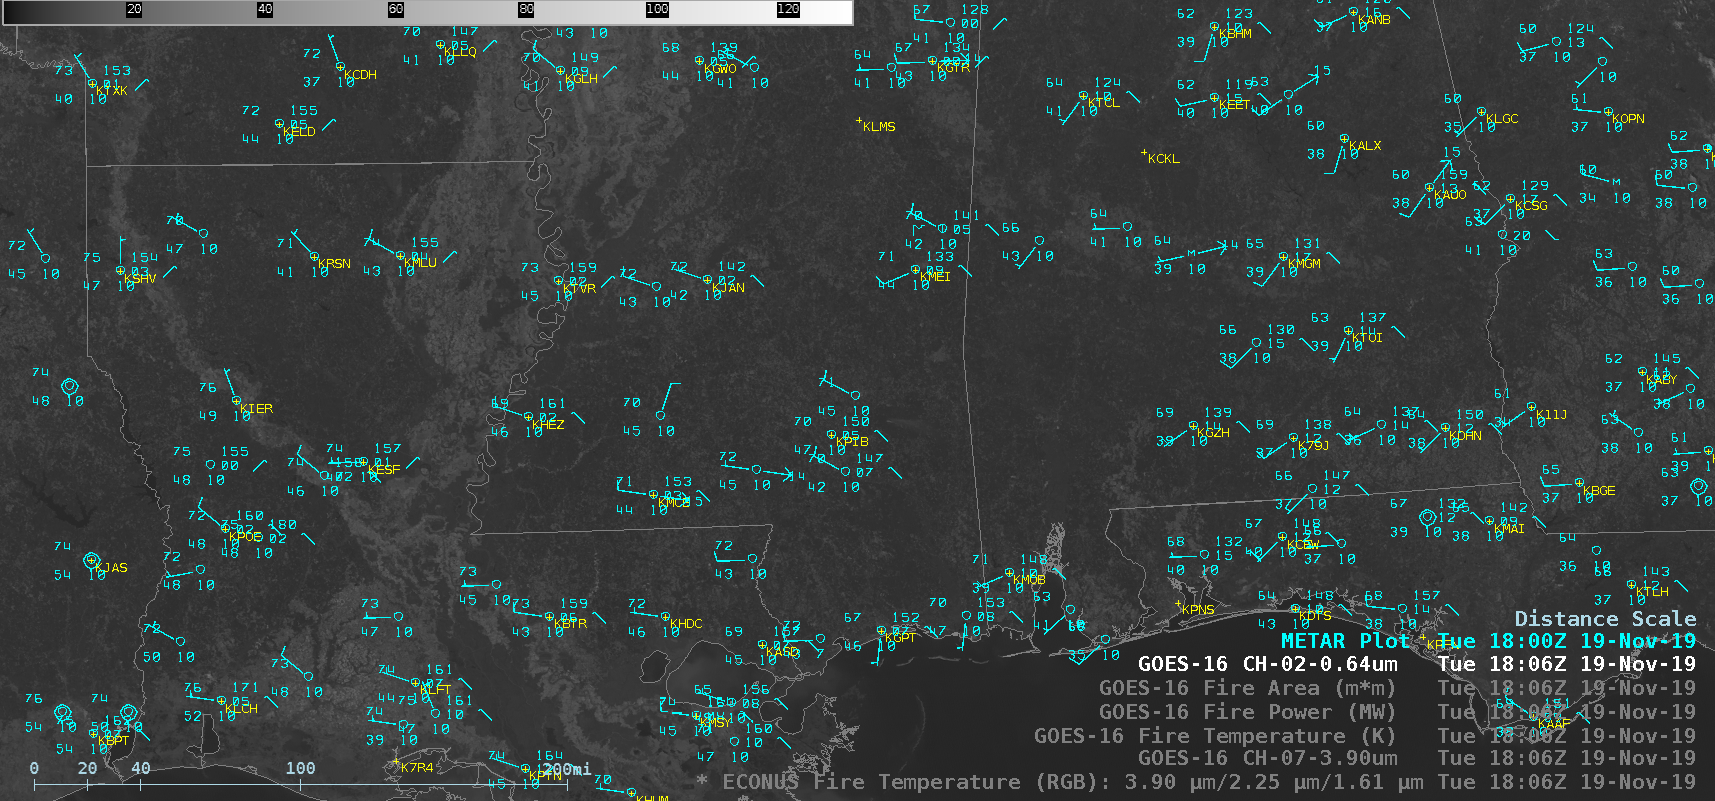
GOES-16 “Red” Visible (0.64 µm) images, with and without plots of surface observations [click to play animation | MP4]
There were no surface stations downwind of that Mississippi fire; however, one small smoke plume drifted over Lafayette in southern Louisiana (KLFT) near the end of the day, briefly reducing the visibility to 6 miles at 22 UTC (below).
![Time series of surface observation data from Lafayette Regional Airport in Louisiana [click to enlarge]](https://cimss.ssec.wisc.edu/satellite-blog/wp-content/uploads/sites/5/2019/11/191119_KLFT_SFCMG.GIF)
Time series of surface observation data from Lafayette Regional Airport in Louisiana [click to enlarge]
For the hot fire in southeastern Mississippi, GOES-16 Shortwave Infrared, Fire Temperature, Fire Power and Fire Area values are shown for the same hot fire pixel at 1716, 1731 and 1806 UTC
(below). Note that the individual parameter trends can be different for a given fire pixel — for example, even though the hottest 3.9 µm brightness temperature value was 58.8ºC at 1806 UTC, the peak Fire Temperature value was 1373.1 K at 1731 UTC. However, the time of the maximum Fire Power value of 213.6 MW coincided with the time of the hottest 3.9 µm brightness temperature value (1806 UTC).
![GOES-16 Shortwave Infrared (3.9 µm), Fire Temperature, Fire Power and Fire Area values at 1716 UTC [click to enlarge]](https://cimss.ssec.wisc.edu/satellite-blog/wp-content/uploads/sites/5/2019/11/191119_1716utc_goes16_MS_fire.png)
GOES-16 Shortwave Infrared (3.9 µm), Fire Temperature, Fire Power and Fire Area values at 1716 UTC [click to enlarge]
![GOES-16 Shortwave Infrared (3.9 µm), Fire Temperature, Fire Power and Fire Area values at 1731 UTC [click to enlarge]](https://cimss.ssec.wisc.edu/satellite-blog/wp-content/uploads/sites/5/2019/11/191119_1731utc_goes16_MS_fire.png)
GOES-16 Shortwave Infrared (3.9 µm), Fire Temperature, Fire Power and Fire Area values at 1731 UTC [click to enlarge]
![GOES-16 Shortwave Infrared (3.9 µm), Fire Temperature, Fire Power and Fire Area values at 1806 UTC [click to enlarge]](https://cimss.ssec.wisc.edu/satellite-blog/wp-content/uploads/sites/5/2019/11/191119_1806utc_goes16_MS_fire.png)
GOES-16 Shortwave Infrared (3.9 µm), Fire Temperature, Fire Power and Fire Area values at 1806 UTC [click to enlarge]
View only this post
Read Less
![Himawari-8 “Red” Visible (0.64 µm, top), Shortwave Infrared (3.9 µm, middle) and “Clean” Infrared Window (10.4 µm, bottom) [click to play animation | MP4]](https://cimss.ssec.wisc.edu/satellite-blog/wp-content/uploads/sites/5/2019/11/191122_himawari8_visible_shortwaveInfrared_longwaveInfraredWindow_Australia_pyroCb_anim.gif)
![VIIRS True Color RGB and Infrared Window (11.45 µm) images from Suomi NPP and NOAA-20 [click to enlarge]](https://cimss.ssec.wisc.edu/satellite-blog/wp-content/uploads/sites/5/2019/11/191122_noaa20_suomiNPP_viirs_trueColorRGB_infraredWindow_Australia_pyrocbs_anim.gif)
![Plot of rawinsonde data from Williamtown, New South Wales [click to enlarge]](https://cimss.ssec.wisc.edu/satellite-blog/wp-content/uploads/sites/5/2019/11/191122_00UTC_YSWM_RAOB.GIF)
![GOES-16 Fire Temperature RGB, Shortwave Infrared (3.9 µm), Fire Temperature, Fire Power and Fire Area products [click to play animation | MP4]](https://cimss.ssec.wisc.edu/satellite-blog/wp-content/uploads/sites/5/2019/11/191119_goes16_fireRGB_shortwaveInfrared_fireTemperature_firePower_fireArea_Gulf_Coast_anim.gif)

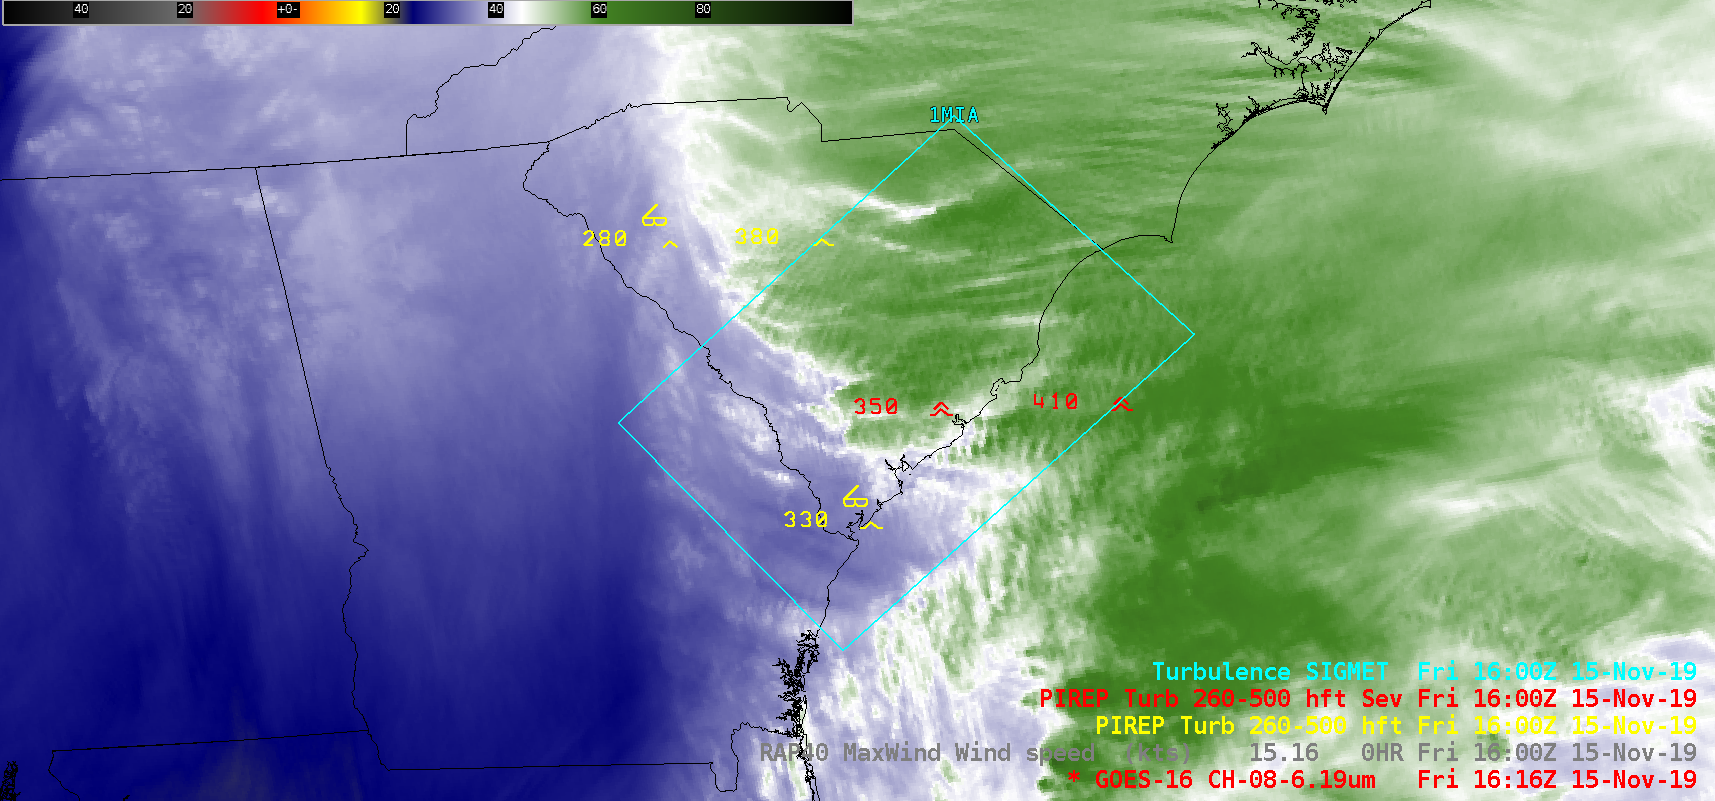
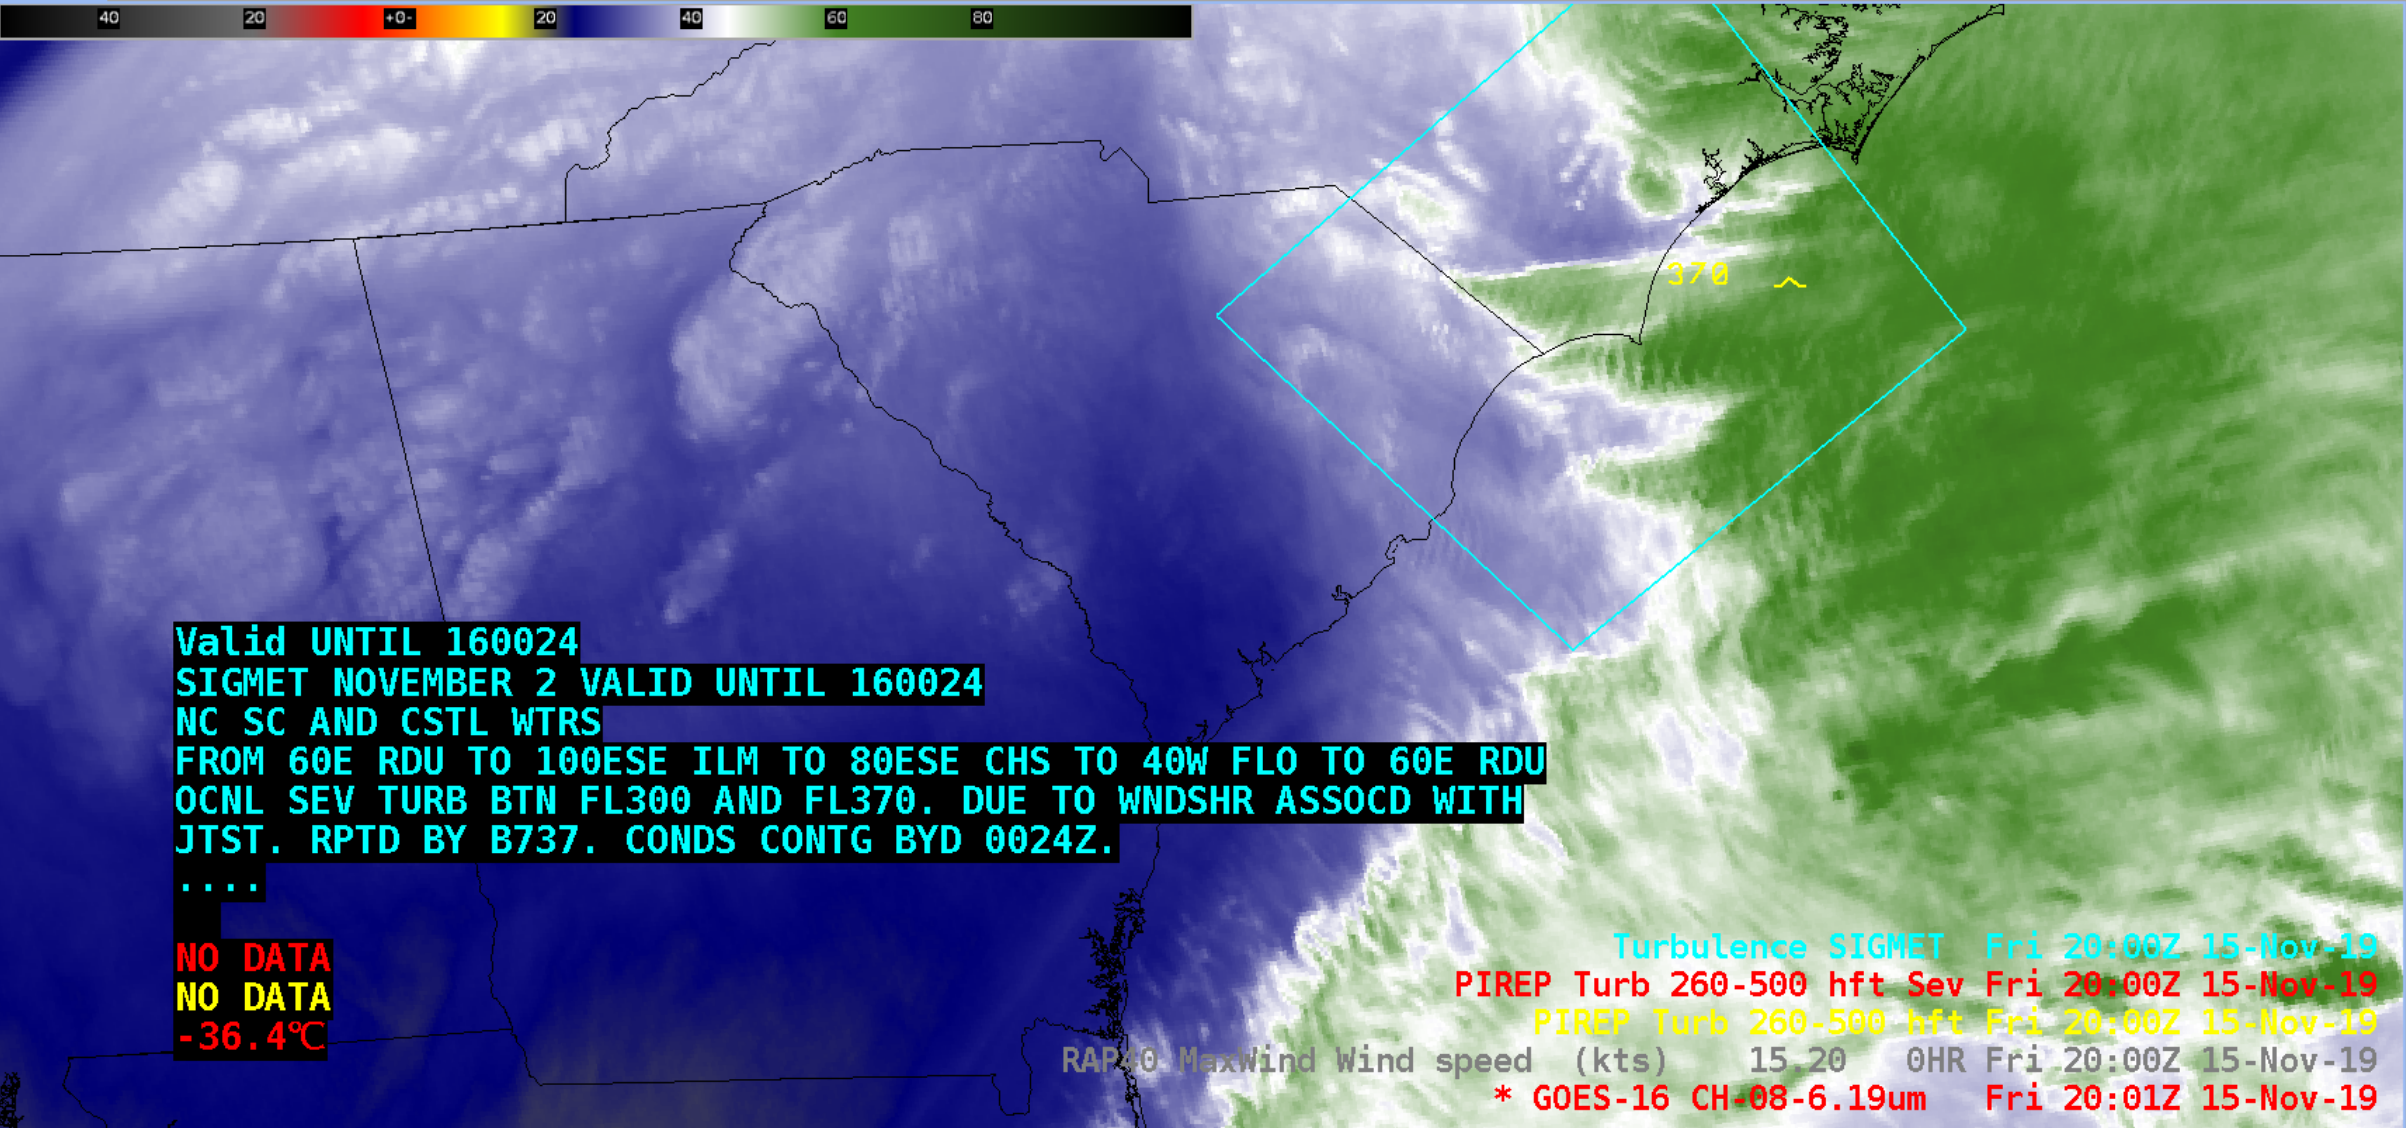
![GOES-16 Upper-level Water Vapor (6.2 µm) images, with plots of pilot reports and SIGMET boundaries [click to play animation | MP4]](https://cimss.ssec.wisc.edu/satellite-blog/wp-content/uploads/sites/5/2019/11/191115_goes16_waterVapor_pireps_sigmets_anim.gif)
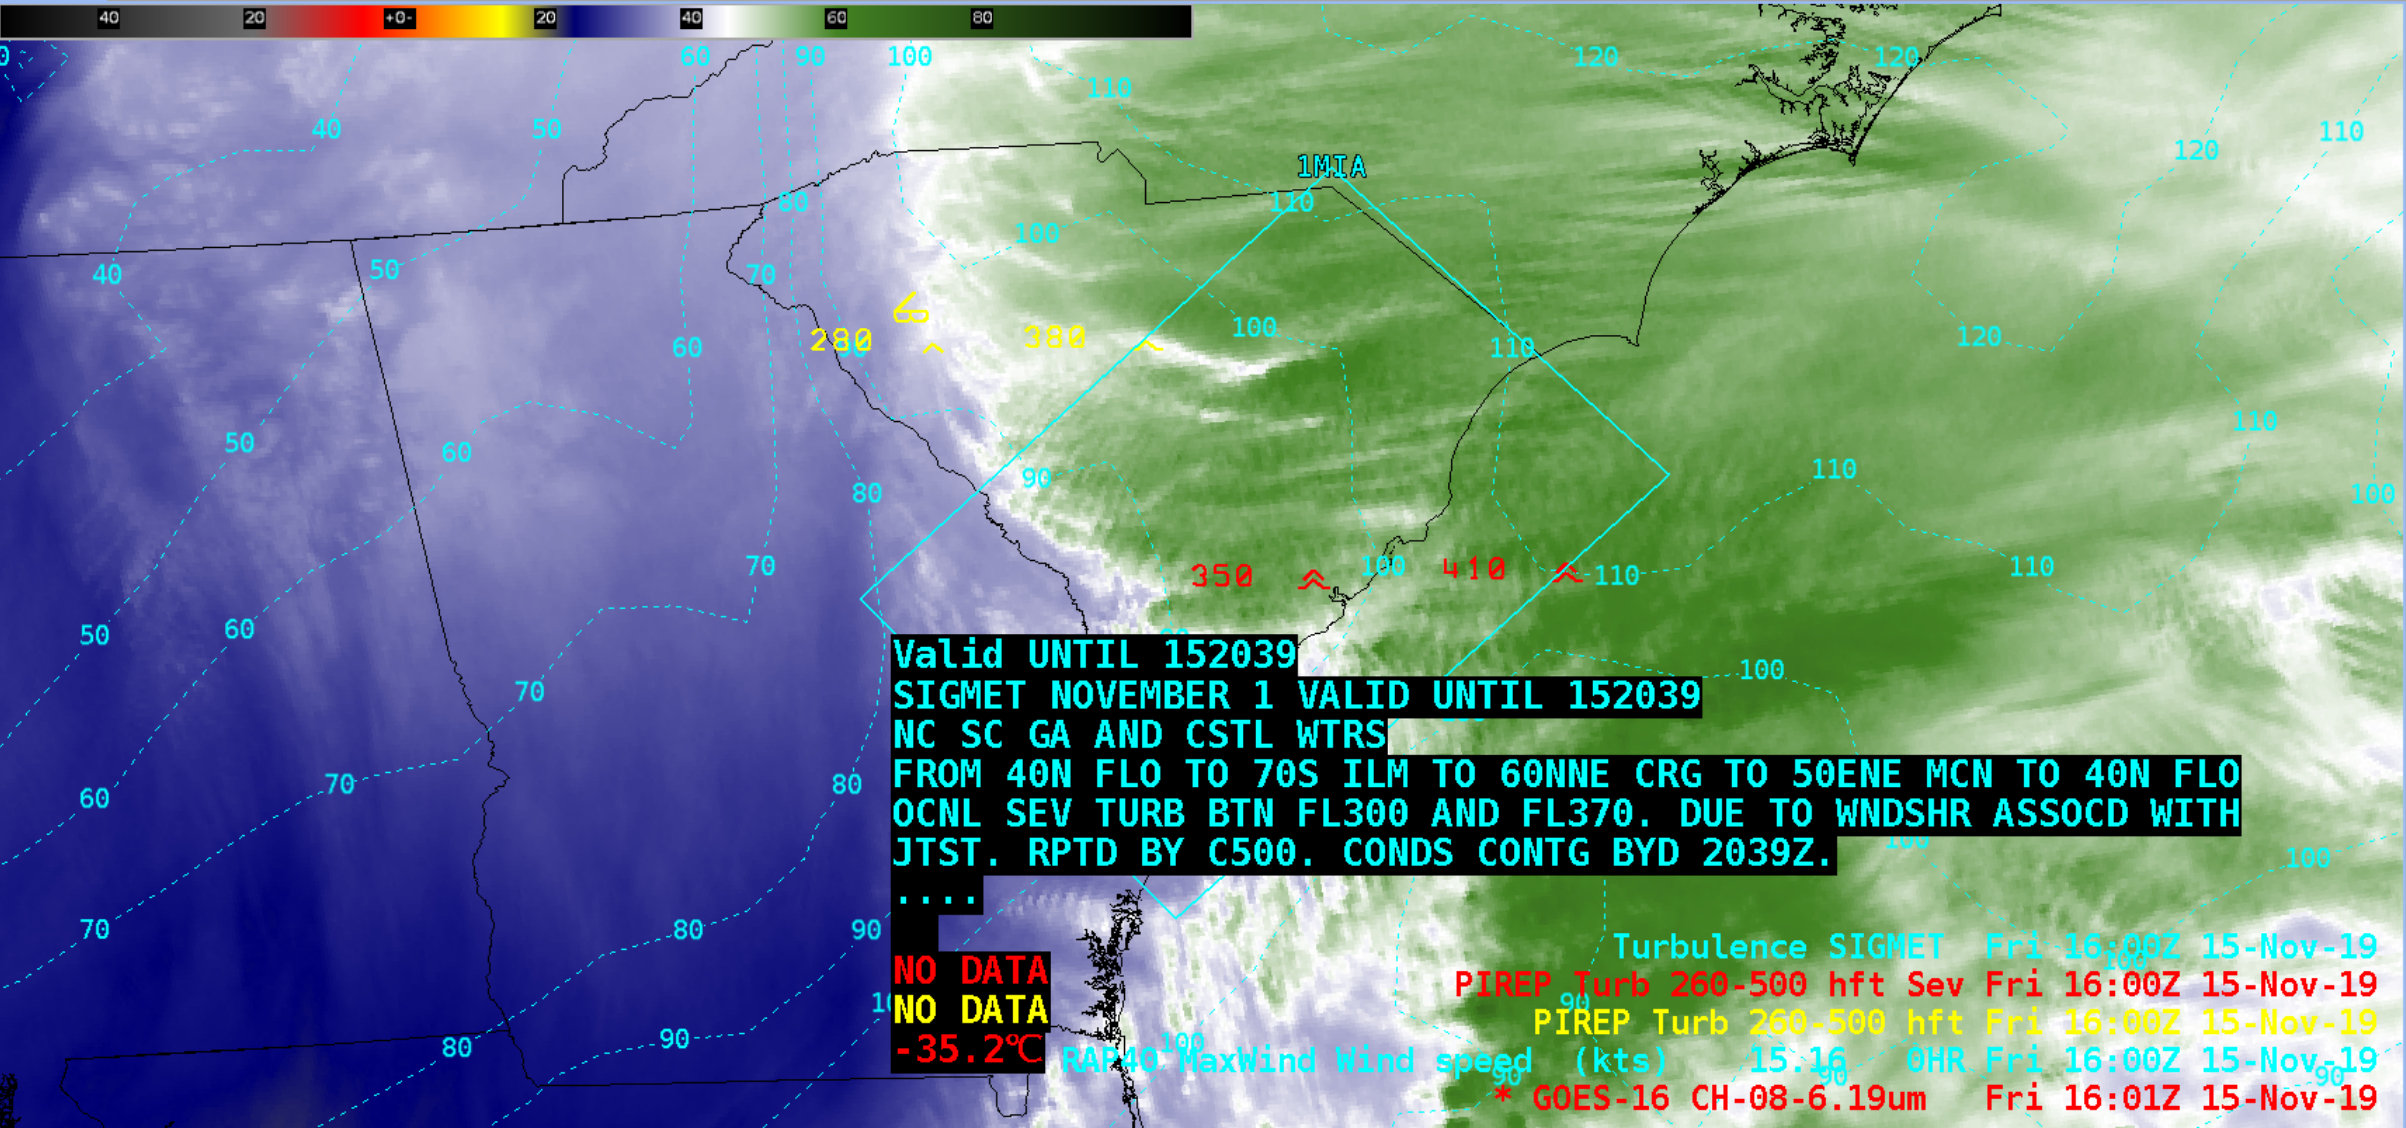
![GOES-16 Upper-level Water Vapor (6.2 µm) images, with plots of pilot reports, SIGMET boundaries, and isotachs of RAP40 model maximum wind [click to play animation | MP4]](https://cimss.ssec.wisc.edu/satellite-blog/wp-content/uploads/sites/5/2019/11/191115_goes16_waterVapor_pireps_sigmets_rap40maxWinds_anim.gif)
![Terra MODIS Visible (0.65 µm) image, with plots of pilot reports and SIGMET boundaries [click to enlarge]](https://cimss.ssec.wisc.edu/satellite-blog/wp-content/uploads/sites/5/2019/11/191115_1600utc_modis_vis_pireps-20191115_160124.png)
![NOAA-20 VIIRS True Color RGB and Infrared Window (11.45 µm) images, with pilot reports of turbulence [click to enlarge]](https://cimss.ssec.wisc.edu/satellite-blog/wp-content/uploads/sites/5/2019/11/191115_1740utc_noaa20_truecolor_infrared_pireps_anim.gif)

