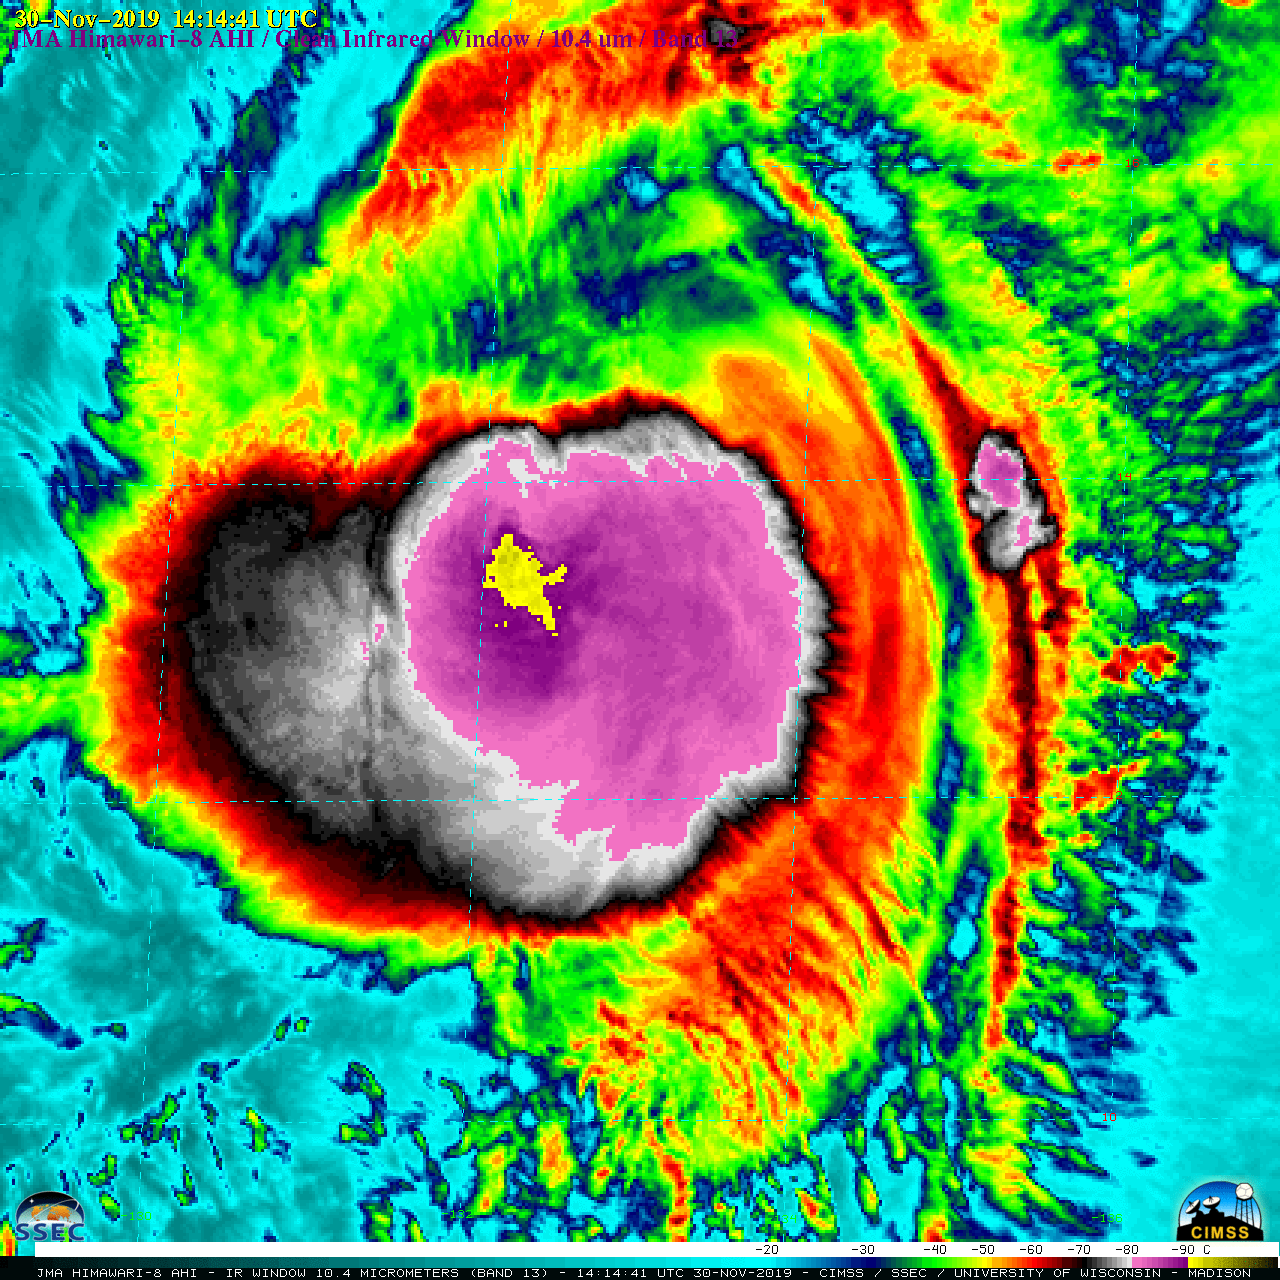
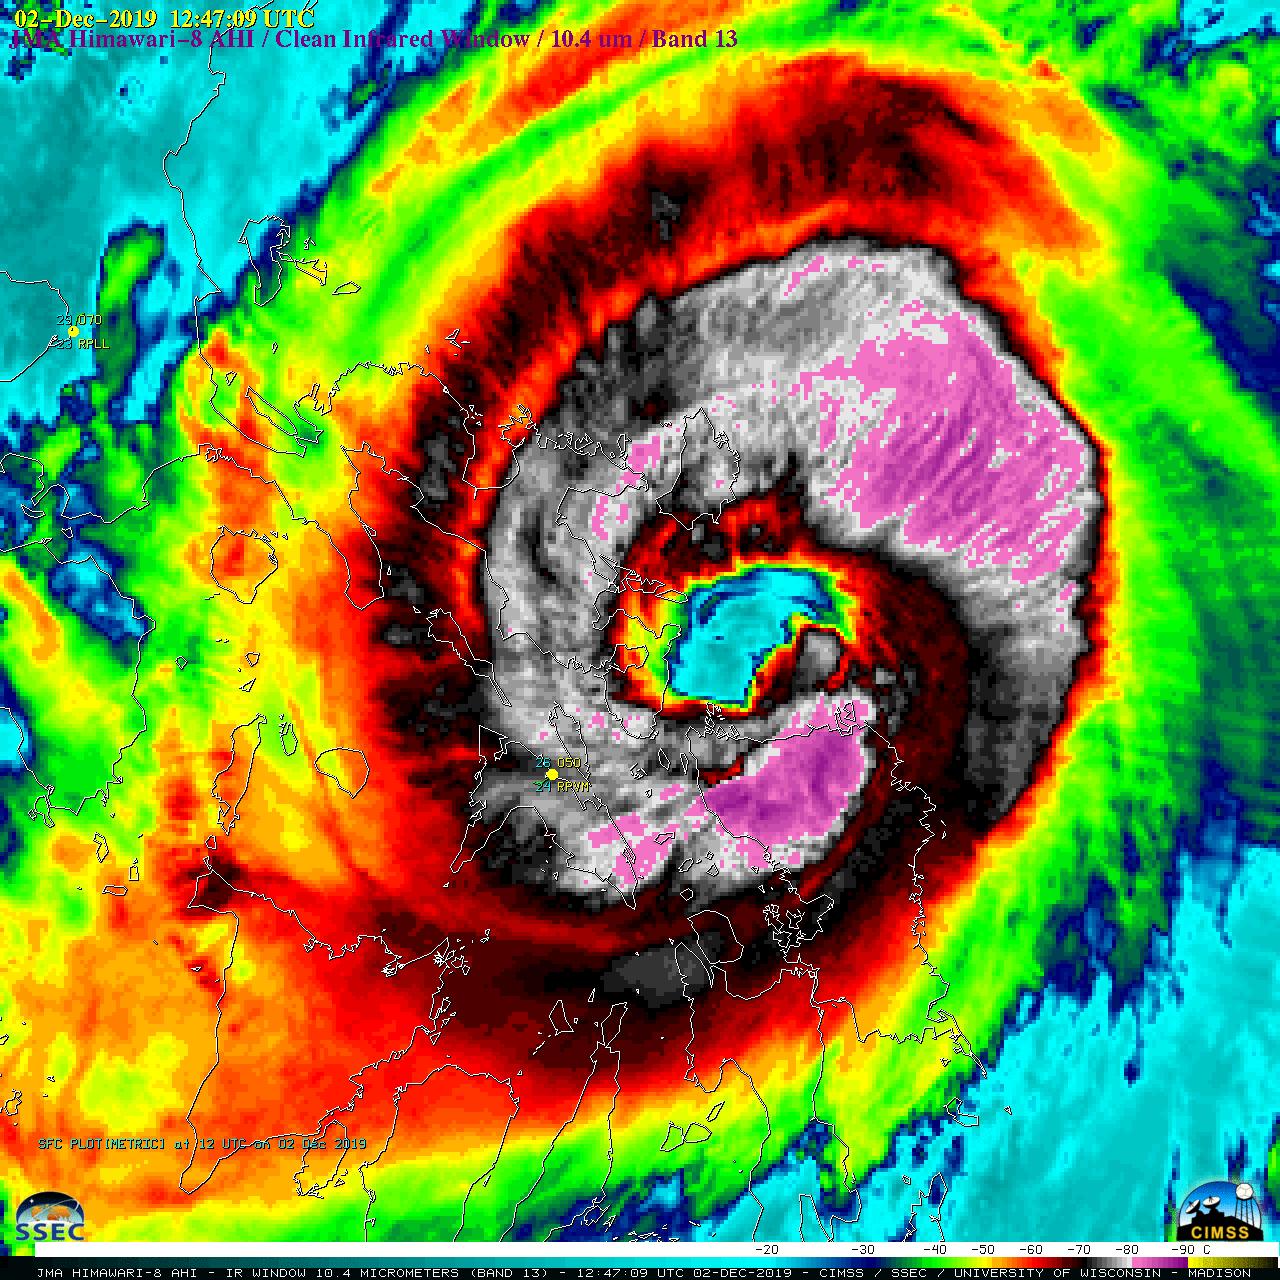
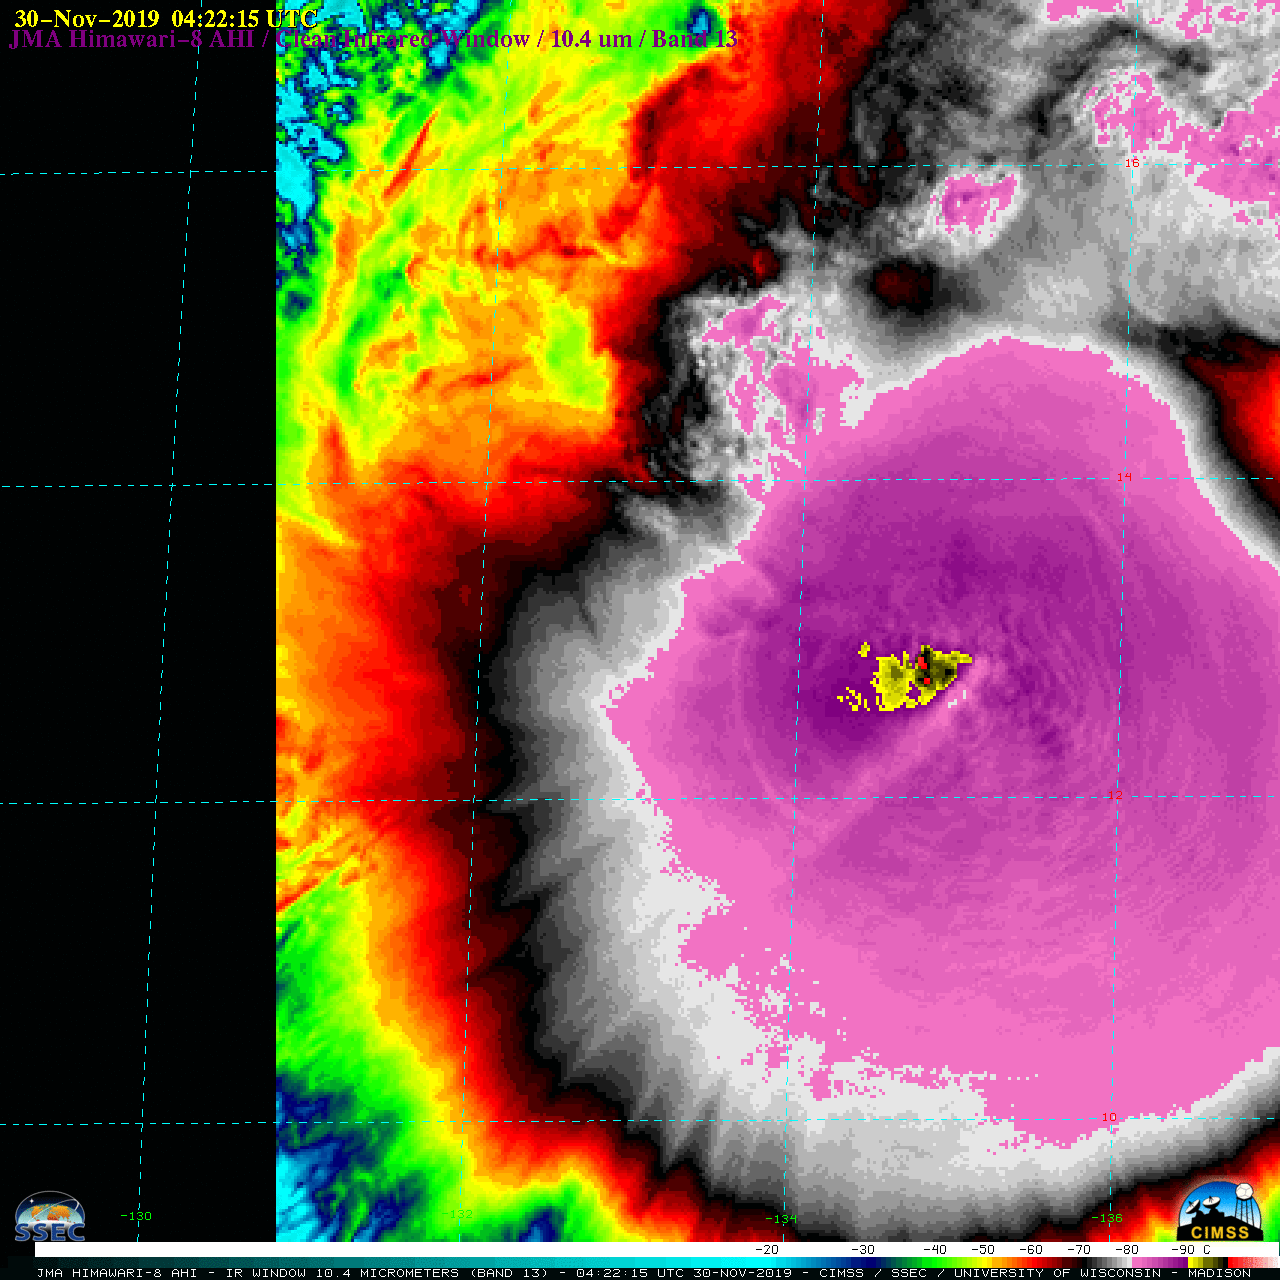
2.5-minute interval JMA Himawari-8 AHI “Clean” Infrared Window (10.4 µm) images (above) showed a large canopy of cold cloud-top infrared brightness temperatures (BTs) associated with Category 1 Typhoon Kammuri in the West Pacific Ocean on 30 November 2019. Between 00 UTC and 05 UTC, many of the pulsing overshooting tops exhibited... Read More
![Himawari-8 "Clean" Infrared Window (10.4 µm) images [click to play animation | MP4]](https://cimss.ssec.wisc.edu/satellite-blog/wp-content/uploads/sites/5/2019/11/HIM08_IR100_KAMMURI_30NOV2019_B13_2019334_141441_HIMAWARI-8_0001PANEL_FRAME00342.GIF)
Himawari-8 “Clean” Infrared Window (10.4 µm) images [click to play animation | MP4]
2.5-minute interval
JMA Himawari-8
AHI “Clean” Infrared Window (10.4 µm) images
(above) showed a large canopy of cold cloud-top infrared brightness temperatures (BTs) associated with Category 1
Typhoon Kammuri in the West Pacific Ocean on 30 November 2019. Between 00 UTC and 05 UTC, many of the pulsing overshooting tops exhibited BTs -100ºC or colder
(shades of red embedded in black on the coldest end of the scale).
Plots of the coldest overshooting top 10.4 µm brightness temperatures on Himawari-8 Target Sector (2.5-minute interval) and Full Disk (10-minute interval) images during the 0002-0502 UTC time period on 30 November (below) showed that the closest (in time**) Full Disk image BTs were often within a degree C of the Target Sector images — but the magnitude of rapid fluctuations of BT seen in the 2.5-minute data were well not captured by the 10-minute data. For the 4 Target Sector images exhibiting BTs of -103ºC and colder (0112, 0127, 0204 and 0259 UTC) only one of the closely-corresponding Full Disk images exhibited a similarly cold BT (0110 UTC, with -103.0ºC). The coldest Target Sector BT was -103.55ºC at 02:59:44 UTC, while the coldest Full Disk BT was -103.0ºC at 01:13:34 UTC.
**The actual time that closely-corresponding Target Sector and Full Disk scans were imaging Kammuri differed by about 1 minute and 15 seconds — for example, the 01:12:15 UTC Target Sector scanned Kammuri’s coldest overshooting tops at 01:12:19, while the 01:10:00 Full Disk scanned those same overshooting tops at 01:13:34 UTC.
![Plots of coldest Himawari-8 10.4 µm brightness temperatures on 2.5-minute Target Sector (blue) and 10-minute Full Disk (green) images [click to enlarge]](https://cimss.ssec.wisc.edu/satellite-blog/wp-content/uploads/sites/5/2019/11/191130_Himawari8_Kammuri_IRBT.png)
Plots of coldest Himawari-8 infrared (10.4 µm) brightness temperatures on 2.5-minute Target Sector (blue) and 10-minute Full Disk (green) images [click to enlarge]
NOAA-20 VIIRS True Color RGB and Infrared Window (11.45 µm) images at 0421 UTC as viewed using
RealEarth (below) revealed an area of very cold cloud-top infrared BTs (highlighted by the yellow region near the center of the storm). The coldest BT within that yellow area was
-109.35ºC — which could qualify as the coldest cloud-top temperature on record as sensed by a meteorological satellite (
Weather Underground). In addition, on the plot of Himawari-8 infrared BTs shown above it can be seen that the previous record for coldest documented BT (
-102.2ºC with Tropical Cyclone Hilda in 1990) was eclipsed on a total of 9 Target Sector and 4 Full Disk images.
![NOAA-20 VIIRS True Color RGB and Infrared Window (11.45 µm) images at 0420 UTC [click to enlarge]](https://cimss.ssec.wisc.edu/satellite-blog/wp-content/uploads/sites/5/2019/11/191130_0420utc_noaa20_trueColorRGB_infraredWindow_Typhoon_Kammuri_anim.gif)
NOAA-20 VIIRS True Color RGB and Infrared Window (11.45 µm) images at 0421 UTC [click to enlarge]
The NOAA-20 VIIRS Infrared image at 0421 UTC is shown below with 2 different color enhancements — the darker blue colors of the 160-to-200 K enhancement help to highlight the colder BT regions (including the coldest 163.8 K or -109.35ºC pixel).
![NOAA-20 VIIRS Infrared Window (11.45 µm), with different color enhancements (credit: William Straka) [click to enlarge]](https://cimss.ssec.wisc.edu/satellite-blog/wp-content/uploads/sites/5/2019/11/191130_0420utc_noaa20_viirs_infrared_Kammuri_anim.gif)
NOAA-20 VIIRS Infrared Window (11.45 µm) image at 0421 UTC, with 2 different color enhancements (credit: William Straka, CIMSS) [click to enlarge]
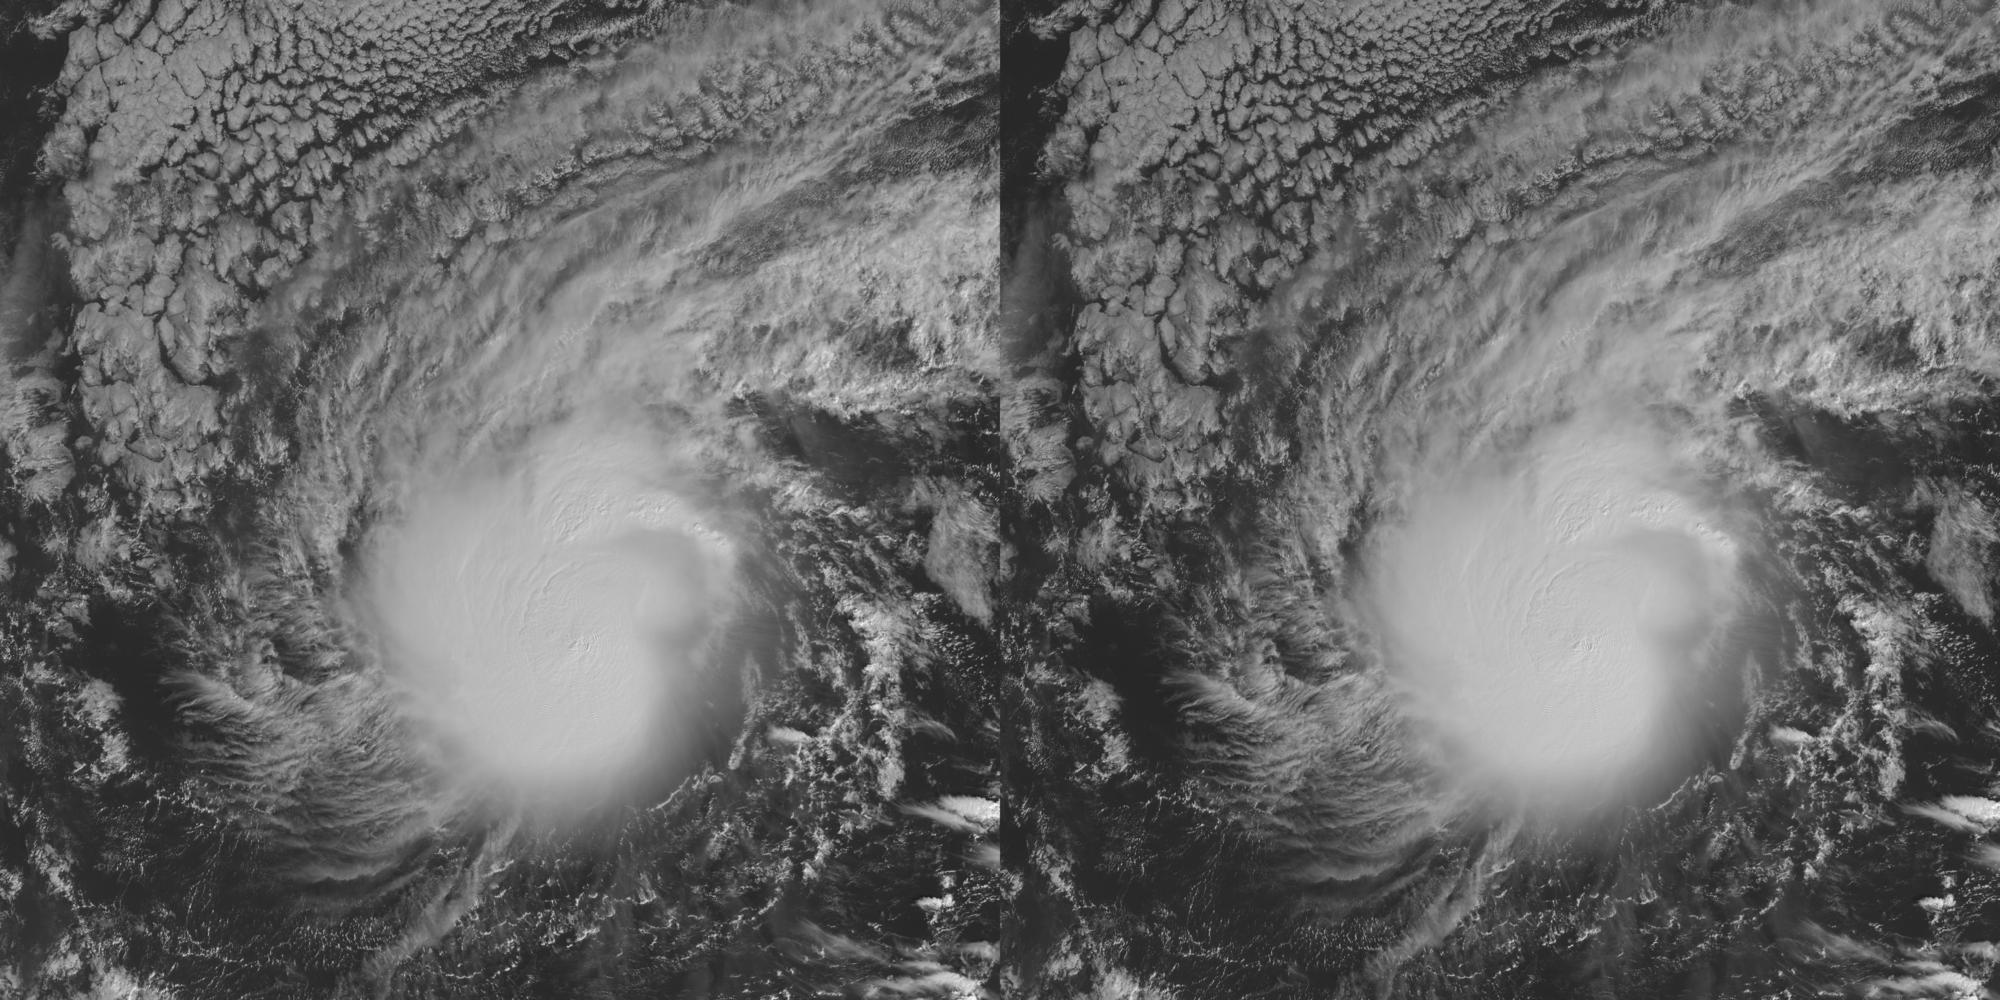
The Himawari-8 Infrared image closest (time-wise) to the NOAA-20 image was at
04:22:15 UTC, and its coldest cloud-top BT was -102.5ºC. In a toggle between magnified Himawari-8 Visible and Infrared images at that time
(below), the -102.5ºC BT was located within the northernmost cluster of red pixels (where shadowing and texture in the Visible image highlighted the overshooting top).
![Himawari-8 Visible (0.64 µm) and Infrared (10.4 µm) images at 0422 UTC [click to enlarge]](https://cimss.ssec.wisc.edu/satellite-blog/wp-content/uploads/sites/5/2019/11/191130_0422utc_himawari8_visible_infrared_Kammuri_overshooting_tops_anim.gif)
Himawari-8 Visible (0.64 µm) and Infrared (10.4 µm) images at 0422 UTC [click to enlarge]
The nearest upper air site was Babelthuop Airport/Koror on Palau Island, located south of the storm — the coldest temperature in their 00 UTC
rawinsonde data (below) was -81.9ºC at an altitude of 16.7 km. Assuming that the overshooting top cooled at a lapse rate of around 7.5ºC per km of ascent beyond the -81.9ºC tropopause (
reference), the altitude of the coldest -109.35ºC cloud top was likely near 19.5 km.
![Plots of 00 UTC and 12 UTC rawinsonde data from Koror, Palau Island [click to enlarge]](https://cimss.ssec.wisc.edu/satellite-blog/wp-content/uploads/sites/5/2019/11/191130_PTRO_RAOBS.GIF)
Plots of 00 UTC and 12 UTC rawinsonde data from Koror, Palau Island [click to enlarge]
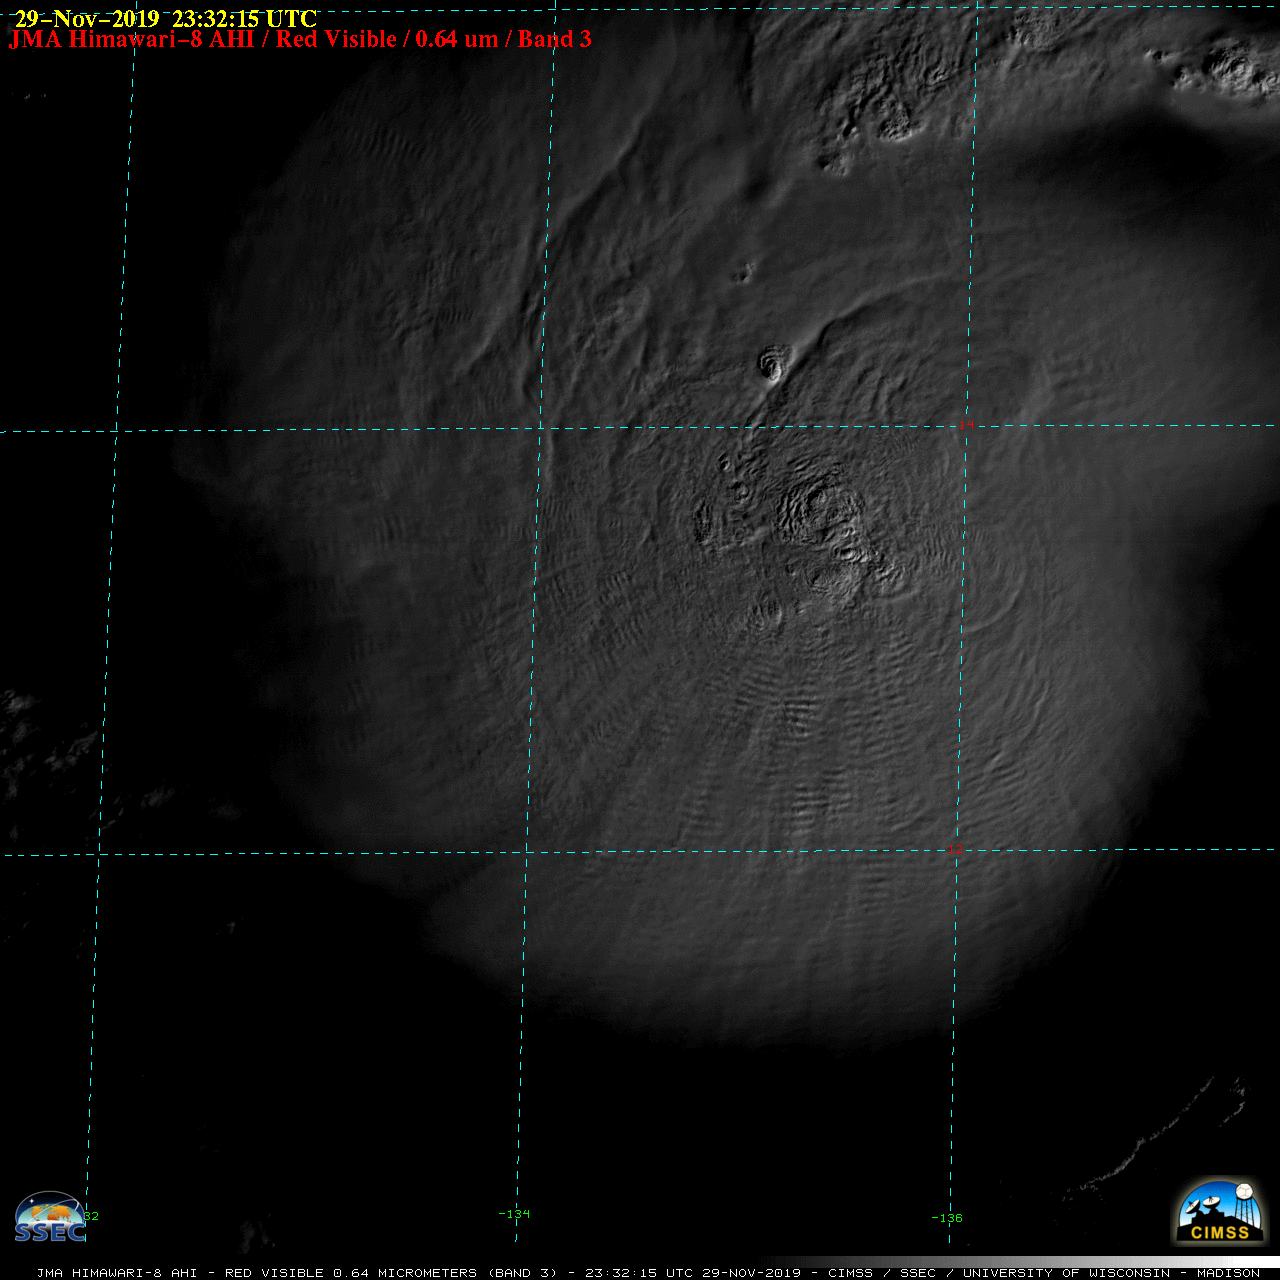
During the daylight hours on 30 November, Himawari-8 “Red” Visible (0.64 µm) images
(below) revealed widespread cloud-top gravity waves which were moving outward away from intense convection with overshooting tops near the storm center. Many of these gravity waves were propagating along the tops of tendrils of transverse banding — especially within the southern semicircle of Kammuri.
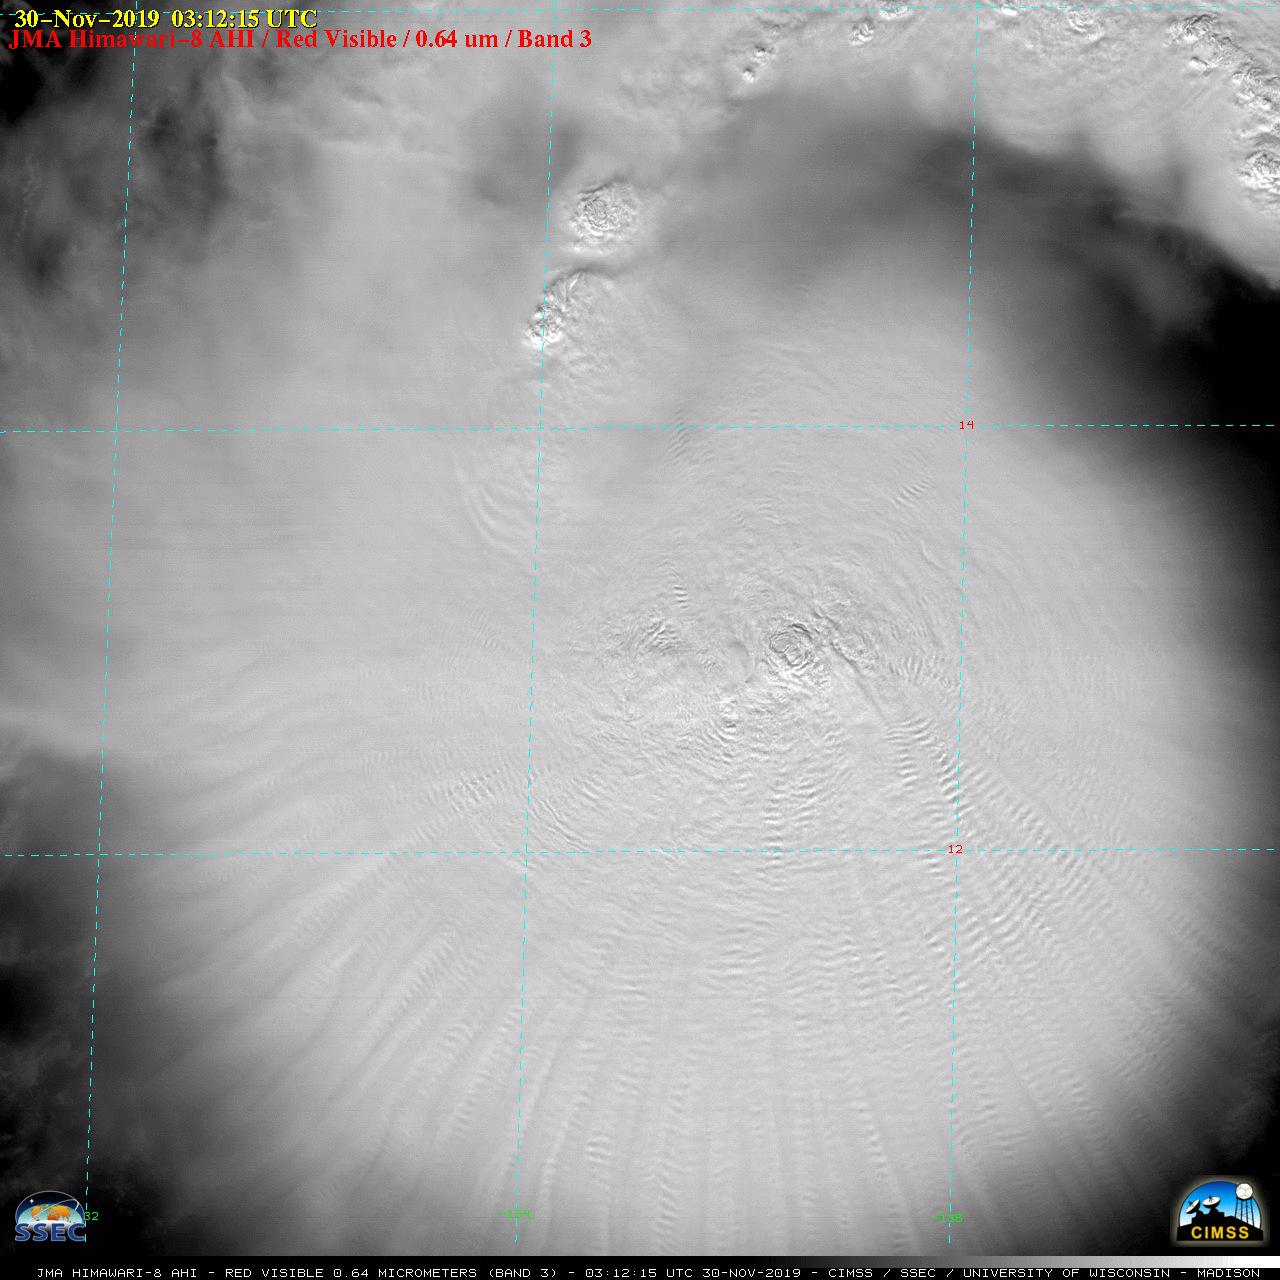
Himawari-8 “Red” Visible (0.64 µm) images [click to play animation | MP4]
—————————
![Suomi NPP VIIRS Day/Night Band (0.7 µm) and Infrared Window (11.45 µm) images at 1604 UTC [click to enlarge]](https://cimss.ssec.wisc.edu/satellite-blog/wp-content/uploads/sites/5/2019/11/191130_1604utc_suomiNPP_dayNightBand_infraredWindow_Kammuri_anim.gif)
Suomi NPP VIIRS Day/Night Band (0.7 µm) and Infrared Window (11.45 µm) images at 1604 UTC (credit: William Straka, CIMSS) [click to enlarge]
Suomi NPP VIIRS Day/Night Band (0.7 µm) and Infrared Window (11.45 µm) images from Suomi NPP at 1604 UTC
(above) and NOAA-20 at 1654 UTC
(below) showed mesospheric airglow waves propagating southward in the DNB images.
![NOAA-20 Day/Night Band (0.7 µm) and Infrared Window (11.45 µm) images at 1654 UTC (credit: William Straka, CIMSS) [click to enlarge]](https://cimss.ssec.wisc.edu/satellite-blog/wp-content/uploads/sites/5/2019/11/191130_1654utc_noaa20_dayNightBand_infraredWindow_Kammuri_anim.gif)
NOAA-20 Day/Night Band (0.7 µm) and Infrared Window (11.45 µm) images at 1654 UTC (credit: William Straka, CIMSS) [click to enlarge]
—————————
![6.9 µm) images, with contours of Deep-Layer Wind Shear [click to enlarge]](https://cimss.ssec.wisc.edu/satellite-blog/wp-content/uploads/sites/5/2019/11/191130_Himawari8_waterVapor_deepLayerWindShear_Kammuri_anim.gif)
Himawari-8 Water Vapor (6.2 µm) images, with contours of Deep-Layer Wind Shear [click to enlarge]
Himawari-8 Water Vapor (6.2 µm) images with contours of
Deep-Layer Wind Shear (above) indicated that Kammuri was moving through an environment of low to moderate shear. Himawari-8 Water Vapor images with plots of satellite-derived
Atmospheric Motion Vectors (below) showed a well-defined outflow channel north of the tropical cyclone.
![Himawari-8 Water Vapor (6.9 µm) images, with Derived Motion Winds [click to enlarge]](https://cimss.ssec.wisc.edu/satellite-blog/wp-content/uploads/sites/5/2019/11/191130_Himawari8_waterVapor_derivedMotionWinds_Kammuri_anim.gif)
Himawari-8 Water Vapor (6.2 µm) images, with plots of Derived Motion Winds [click to enlarge]
Himawari-8 (courtesy JMA) and GEO-KOMPSAT-2A or GK2A (courtesy KMA) visible imagery were combined to create stereoscopic imagery of the storm on 30 November, as shown below from 2100 UTC on 29 November to 0820 UTC on 30 December. View the 3-dimensional image by crossing your eyes and focusing on the third image that becomes apparent in between the two images shown.
Visible (0.64 µm) Imagery from Himawari-8 (left) and GK2A (right) from 2100 UTC on 29 November to 0820 UTC on 30 November 2019 (Click to animate)
10-minute Full Disk images of GK2A Cloud Top Temperature and Cloud Top Height products (source) are shown below. A large canopy of CTT values as cold as -80ºC and CTH values up to 15 km were seen associated with Typhoon Kammuri during the period 0000-0500 UTC.
![KMA GK2A Cloud Top Temperature product [click to play animation | MP4]](https://cimss.ssec.wisc.edu/satellite-blog/wp-content/uploads/sites/5/2019/11/gk2a_ami_le2_ctps-ctt_fd020ge_201911300300.srv.png)
KMA GK2A Cloud Top Temperature product [click to play animation | MP4]
![KMA GK2A Cloud Top Height product [click to play animation | MP4]](https://cimss.ssec.wisc.edu/satellite-blog/wp-content/uploads/sites/5/2019/11/gk2a_ami_le2_ctps-cth_fd020ge_201911300300.srv.png)
KMA GK2A Cloud Top Height product [click to play animation | MP4]
View only this post
Read Less
![VIIRS True Color RGB and Infrared Window (11.45 µm) images from NOAA-20 and Suomi NPP [click to enlarge]](https://cimss.ssec.wisc.edu/satellite-blog/wp-content/uploads/sites/5/2019/12/191209_noaa20_suomiNPP_viirs_trueColorRGB_Infrared_White_Island_New_Zealand_volcanic_eruption_anim.gif)
![Sentinel-5 TROPOMI Vertical Column SO2 (credit: Bob Carp, SSEC) [click to enlarge]](https://cimss.ssec.wisc.edu/satellite-blog/wp-content/uploads/sites/5/2019/12/191209_0206utc_tropomi_so2.jpg)

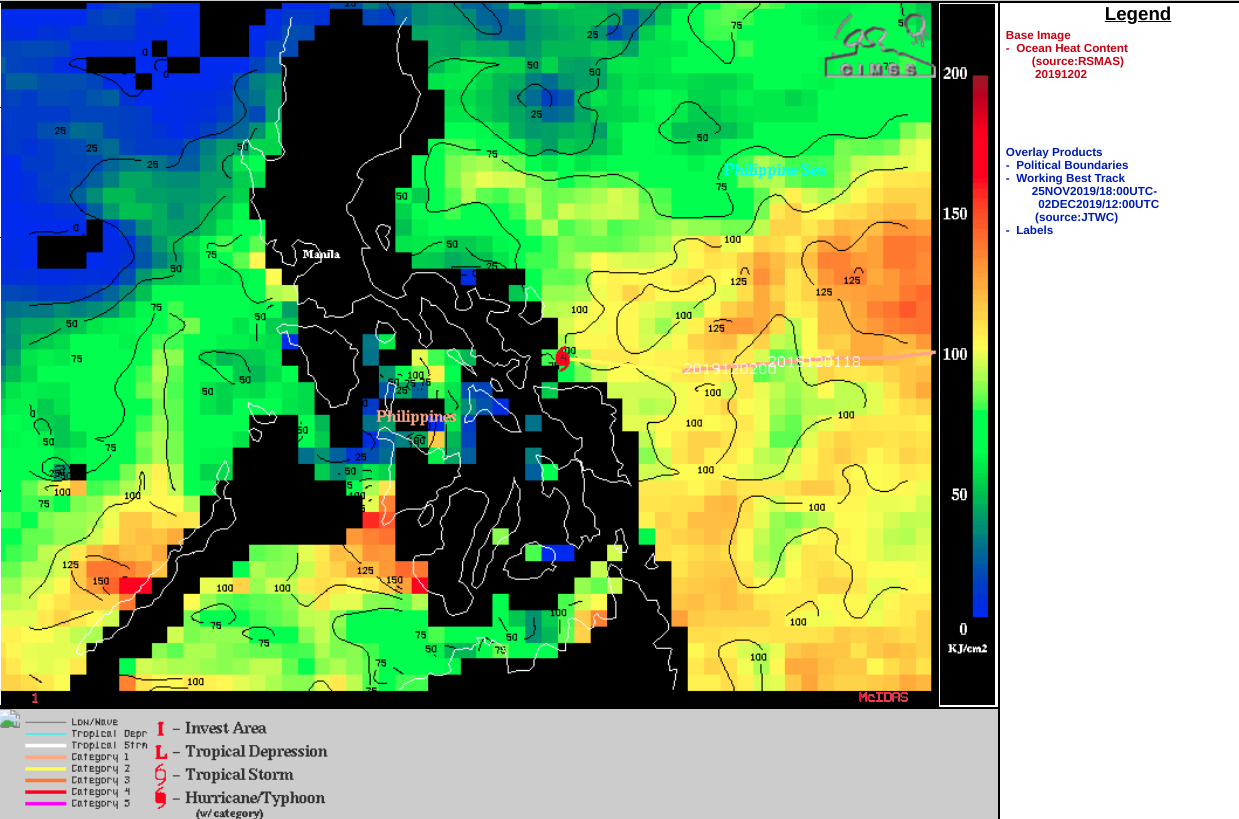
![VIIRS Infrared Window (11.45 µm) from Suomi NPP at 1707 UTC and NOAA-20 at 1757 UTC [click to enlarge]](https://cimss.ssec.wisc.edu/satellite-blog/wp-content/uploads/sites/5/2019/12/191202_1707utc_suomiNPP_1757utc_noaa20_viirs_infrared_Typhoon_Kammuri_anim.gif)
![GCOM-W1 AMSR2 Microwave (85 GHz) image at 1725 UTC [click to enlarge]](https://cimss.ssec.wisc.edu/satellite-blog/wp-content/uploads/sites/5/2019/12/191202_1725utc_gcomW1_amsr2_microwave_Kammuri.png)
![Himawari-8 "Clean" Infrared Window (10.4 µm) images [click to play animation | MP4]](https://cimss.ssec.wisc.edu/satellite-blog/wp-content/uploads/sites/5/2019/11/191130_himawari8_infrared_Tyhoon_Kammuri_v2_anim.gif)

![KMA GK2A Cloud Top Temperature product [click to play animation | MP4]](https://cimss.ssec.wisc.edu/satellite-blog/wp-content/uploads/sites/5/2019/11/191130_gk2a_cloudTopTemperature_anim.gif)
![KMA GK2A Cloud Top Height product [click to play animation | MP4]](https://cimss.ssec.wisc.edu/satellite-blog/wp-content/uploads/sites/5/2019/11/191130_gk2a_cloudTopHeight_anim.gif)
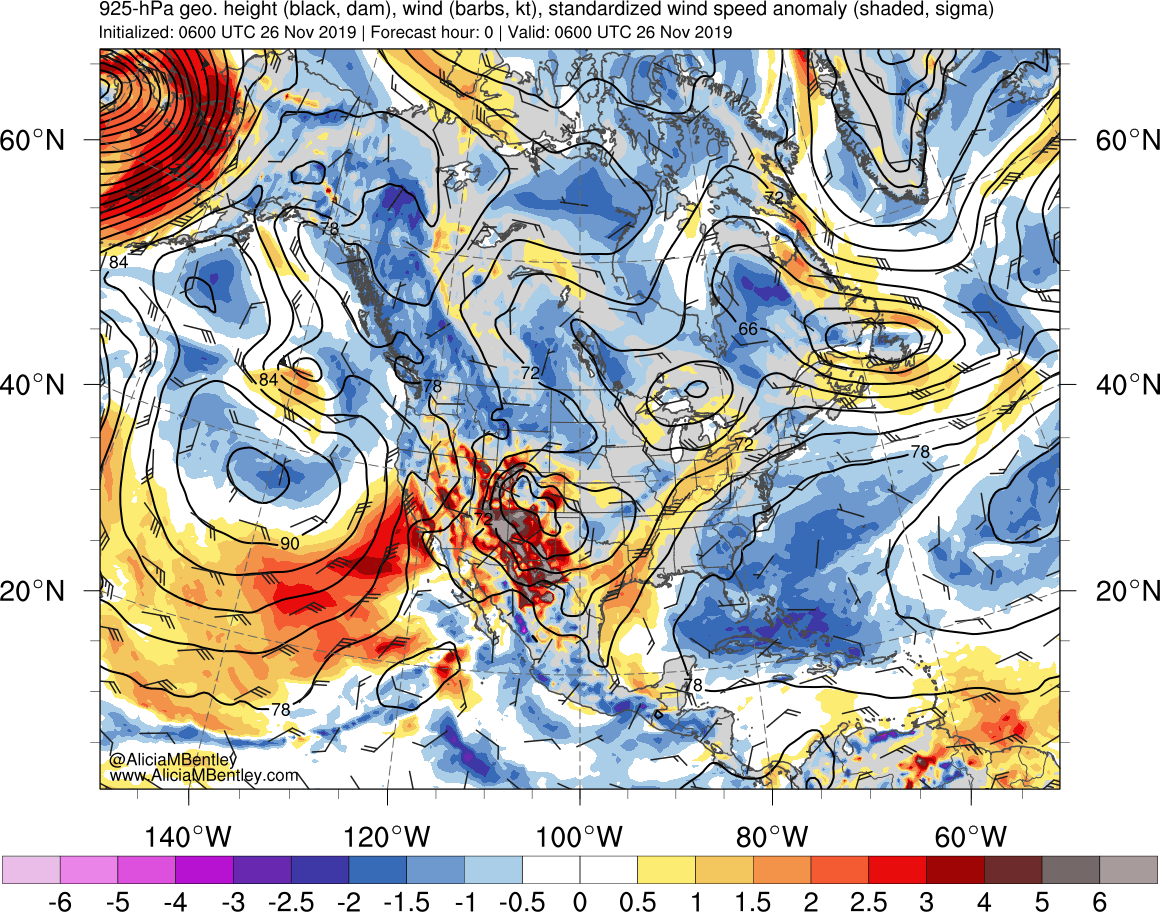
![GOES-17 Low-level (7.3 µm), Mid-level (6.9 µm) and Upper-level (6.2 µm) Water Vapor images, with 3-hourly plots of surface fronts [click to play animation | MP4]](https://cimss.ssec.wisc.edu/satellite-blog/wp-content/uploads/sites/5/2019/11/191126_goes17_waterVapor_PacNW_anim.gif)
![GOES-17 "Red" Visible (0.64 µm) images, with 3-hourly plots of surface fronts [click to play animation | MP4]](https://cimss.ssec.wisc.edu/satellite-blog/wp-content/uploads/sites/5/2019/11/191126_goes17_visible_PacNW_anim.gif)

![GOES-17 "Red" Visible (0.64 µm) images [click to play animation | MP4]](https://cimss.ssec.wisc.edu/satellite-blog/wp-content/uploads/sites/5/2019/11/191126_goes17_visible_1minute_PacNW_anim.gif)
![NOAA-15 AVHRR Shortwave Infrared (3.7 µm) image at 0217 UTC [click to enlarge]](https://cimss.ssec.wisc.edu/satellite-blog/wp-content/uploads/sites/5/2019/11/191127_0217utc_noaa15_shortwaveInfrared_observations_windGusts_OR_CA_anim.gif)
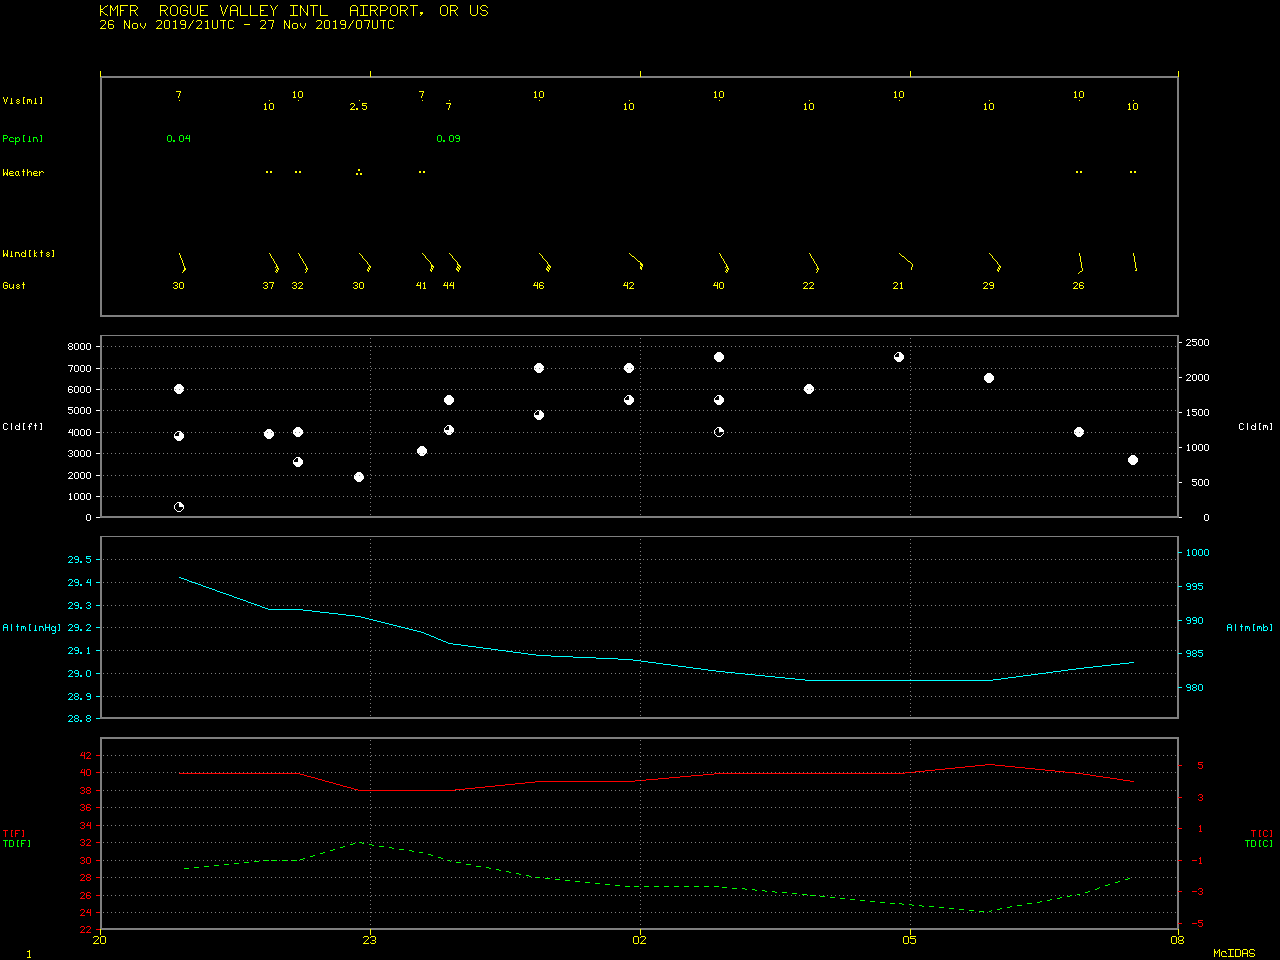
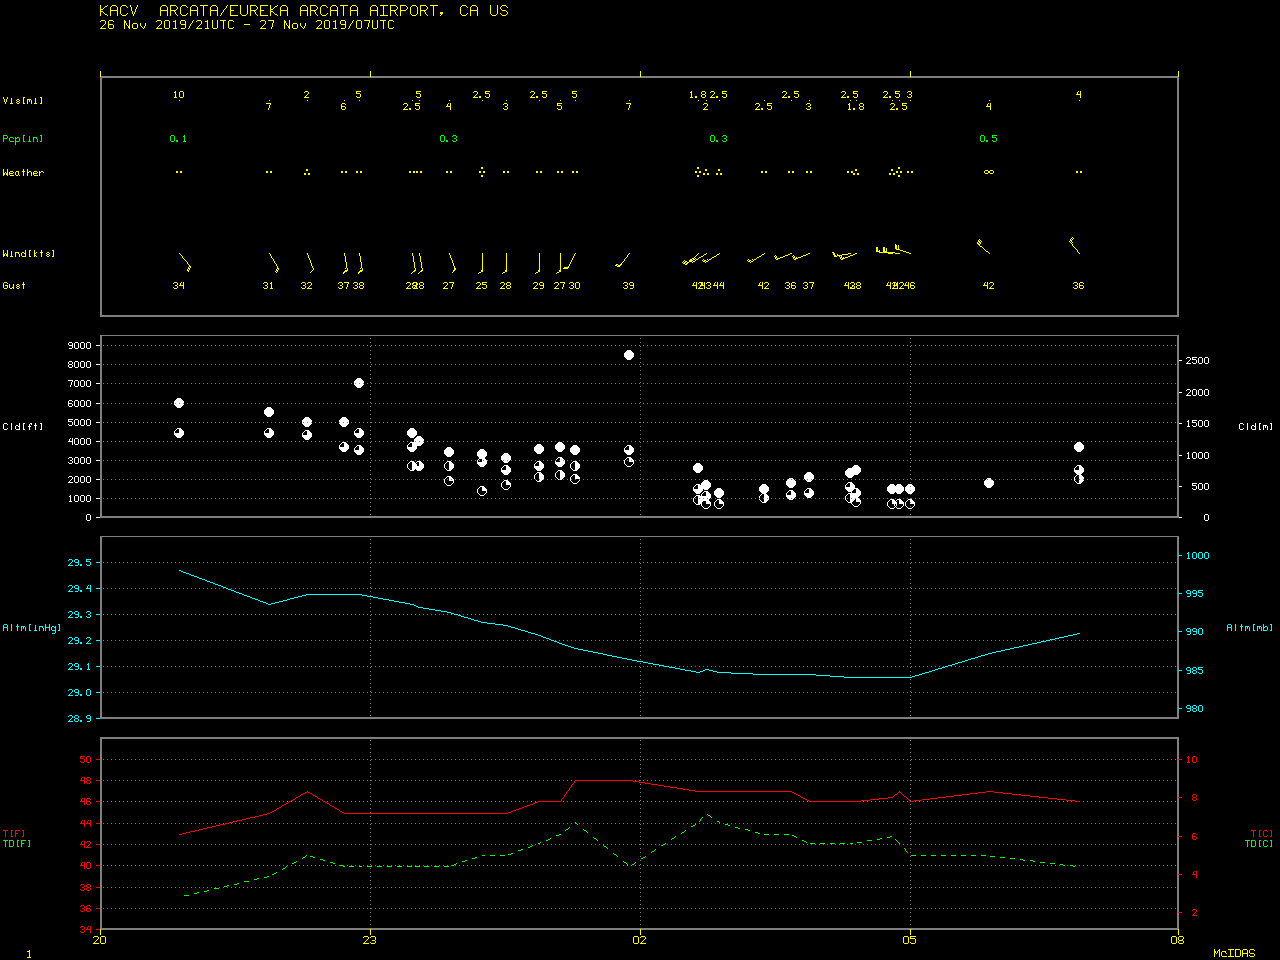
![Time series of surface data at Crescent City, California [click to enlarge]](https://cimss.ssec.wisc.edu/satellite-blog/wp-content/uploads/sites/5/2019/11/191126_KCEC_SFCMG.GIF)
