JMA Himawari-8 “Red” Visible (0.64 µm), Shortwave Infrared (3.9 µm) and Longwave Infrared Window (10.4 µm) imagery (below) showed the evolution of smoke plumes, hot 3.9 µm fire thermal anomalies (red pixels) and cloud-top infrared brightness temperatures of isolated pyrocumulus associated with bush fires that were burning in far eastern... Read More
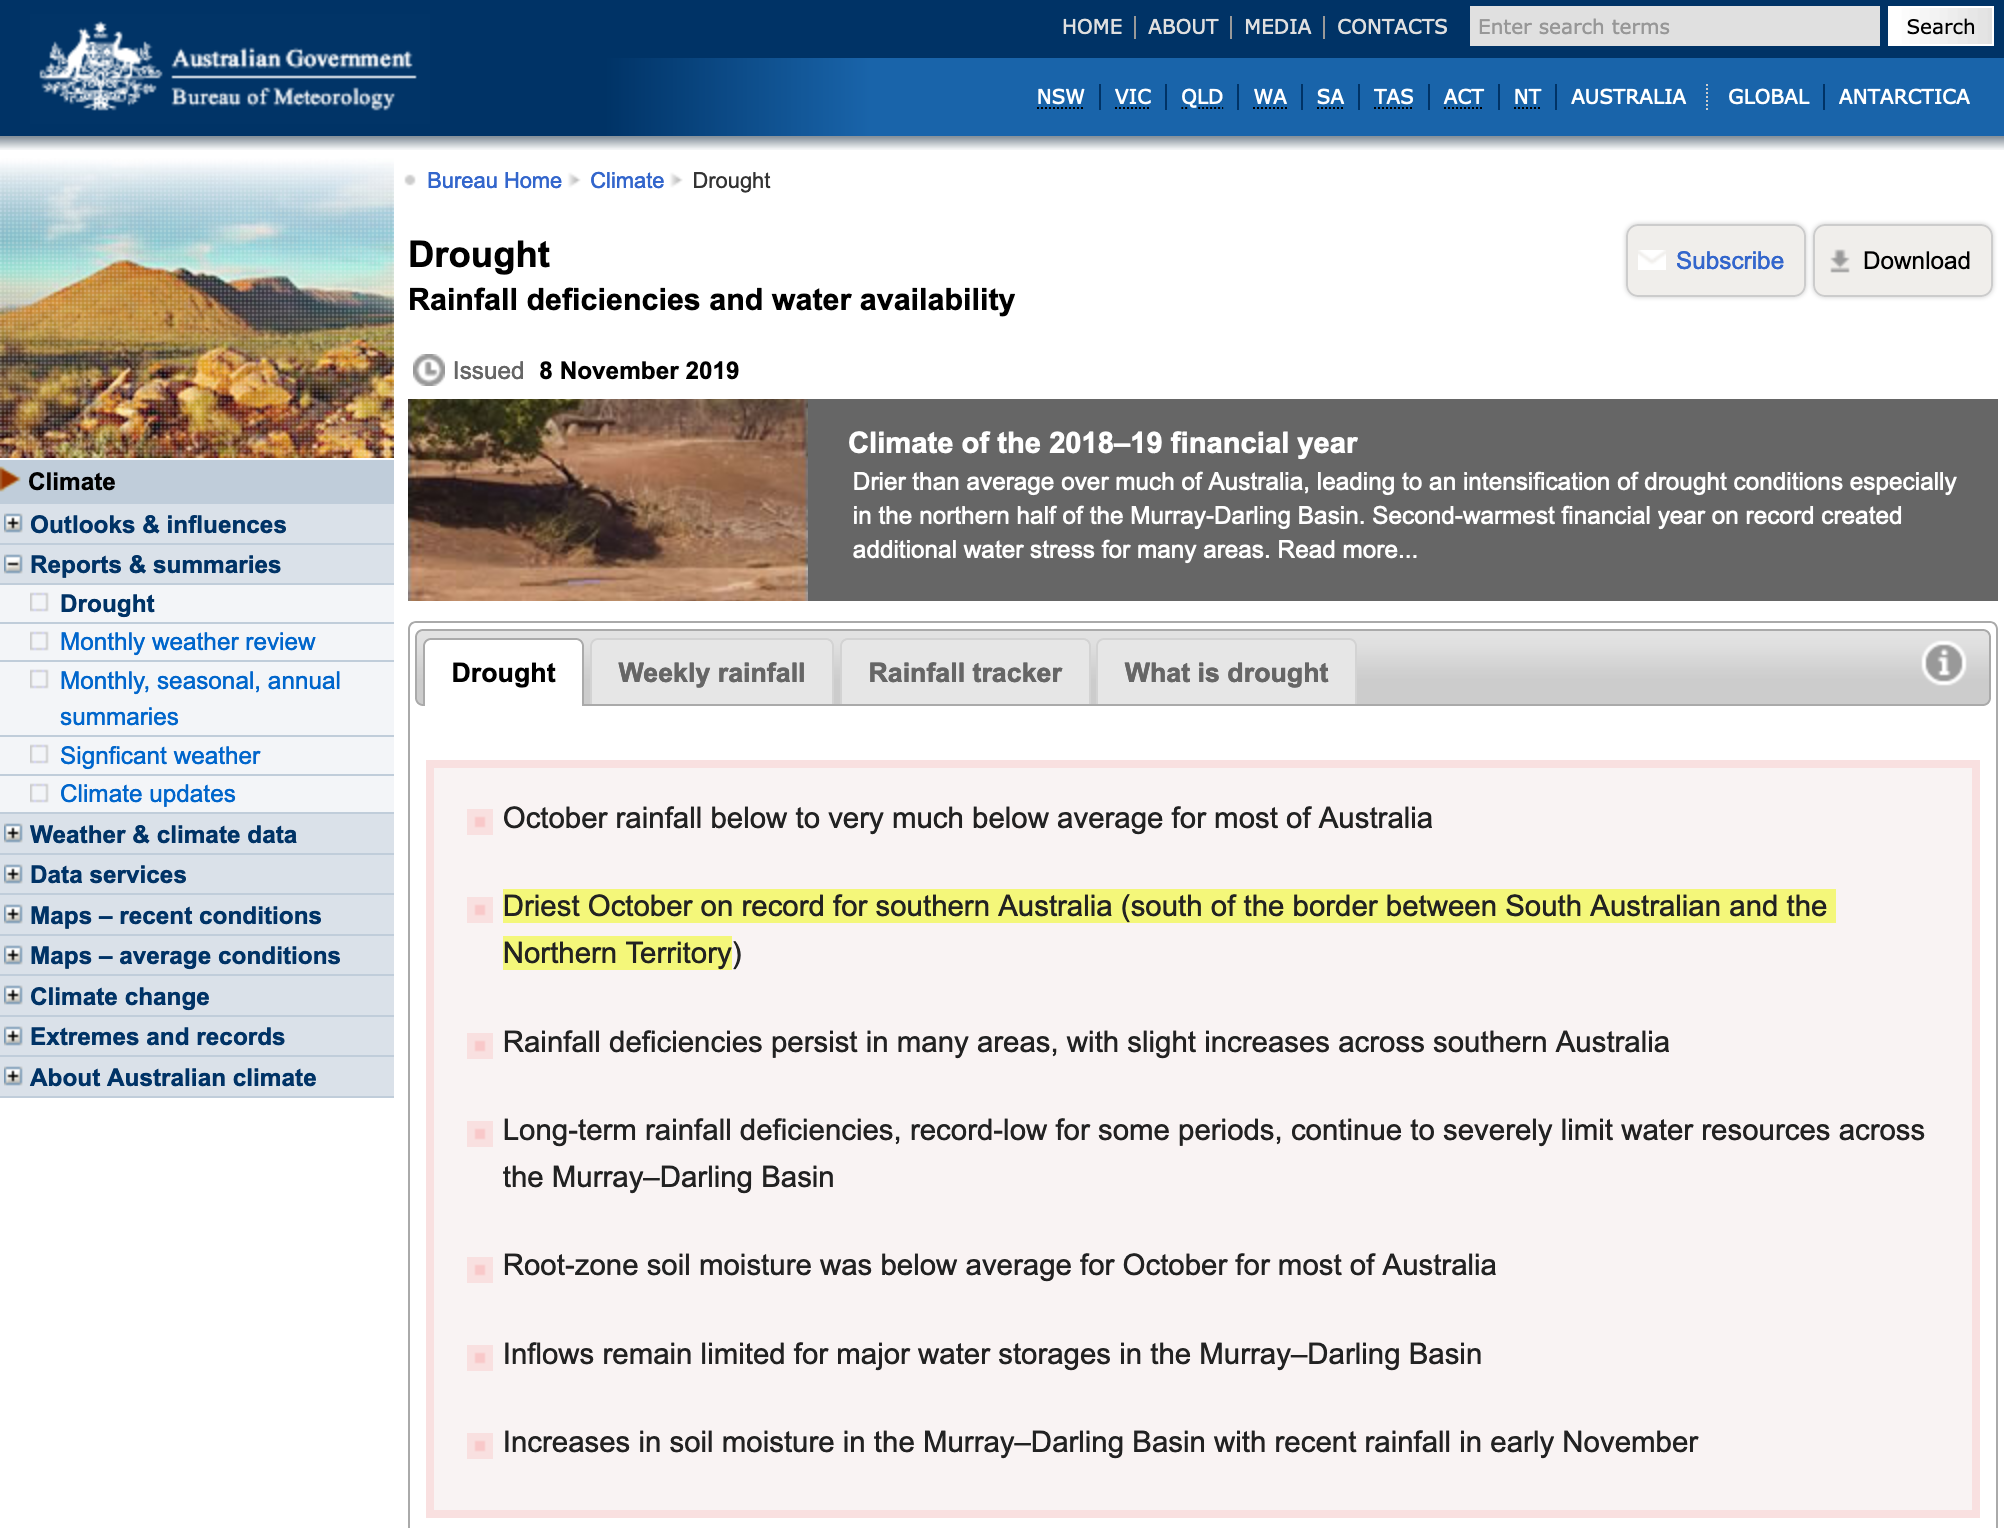
JMA Himawari-8 “Red” Visible (0.64 µm), Shortwave Infrared (3.9 µm) and Longwave Infrared Window (10.4 µm) imagery (below) showed the evolution of smoke plumes, hot 3.9 µm fire thermal anomalies (red pixels) and cloud-top infrared brightness temperatures of isolated pyrocumulus associated with bush fires that were burning in far eastern parts of New South Wales and Queensland, Australia from 1900 UTC on 07 November to 0800 UTC on 08 November 2019. With strong northwesterly surface winds, many of the fire thermal anomalies exhibited rapid southeastward runs toward the coast. That region of Australia had just experienced severe to record 3-month rainfall deficiencies — which included the driest October on record for the southern third of the country.
Himawari-8 “Red” Visible (0.64 µm) images, with hourly plots of surface reports [click to play animation | MP4]
![Himawari-8 Shortwave Infrared (3.9 µm) images, with hourly plots of surface reports [click to play animation | MP4]](https://cimss.ssec.wisc.edu/satellite-blog/wp-content/uploads/sites/5/2019/11/HIM08_SWIR_AUS_08OCT2019_B7_2019312_053000_HIMAWARI-8_0001PANEL_FRAME00061.GIF)
Himawari-8 Shortwave Infrared (3.9 µm) images, with hourly plots of surface reports [click to play animation | MP4]
![Himawari-8 Longwave Infrared Window (10.4 µm) images, with hourly plots of surface reports [click to play animation | MP4]](https://cimss.ssec.wisc.edu/satellite-blog/wp-content/uploads/sites/5/2019/11/HIM08_IR_AUS_08OCT2019_B13_2019312_053000_HIMAWARI-8_0001PANEL_FRAME00061.GIF)
Himawari-8 Longwave Infrared Window (10.4 µm) images, with hourly plots of surface reports [click to play animation | MP4]
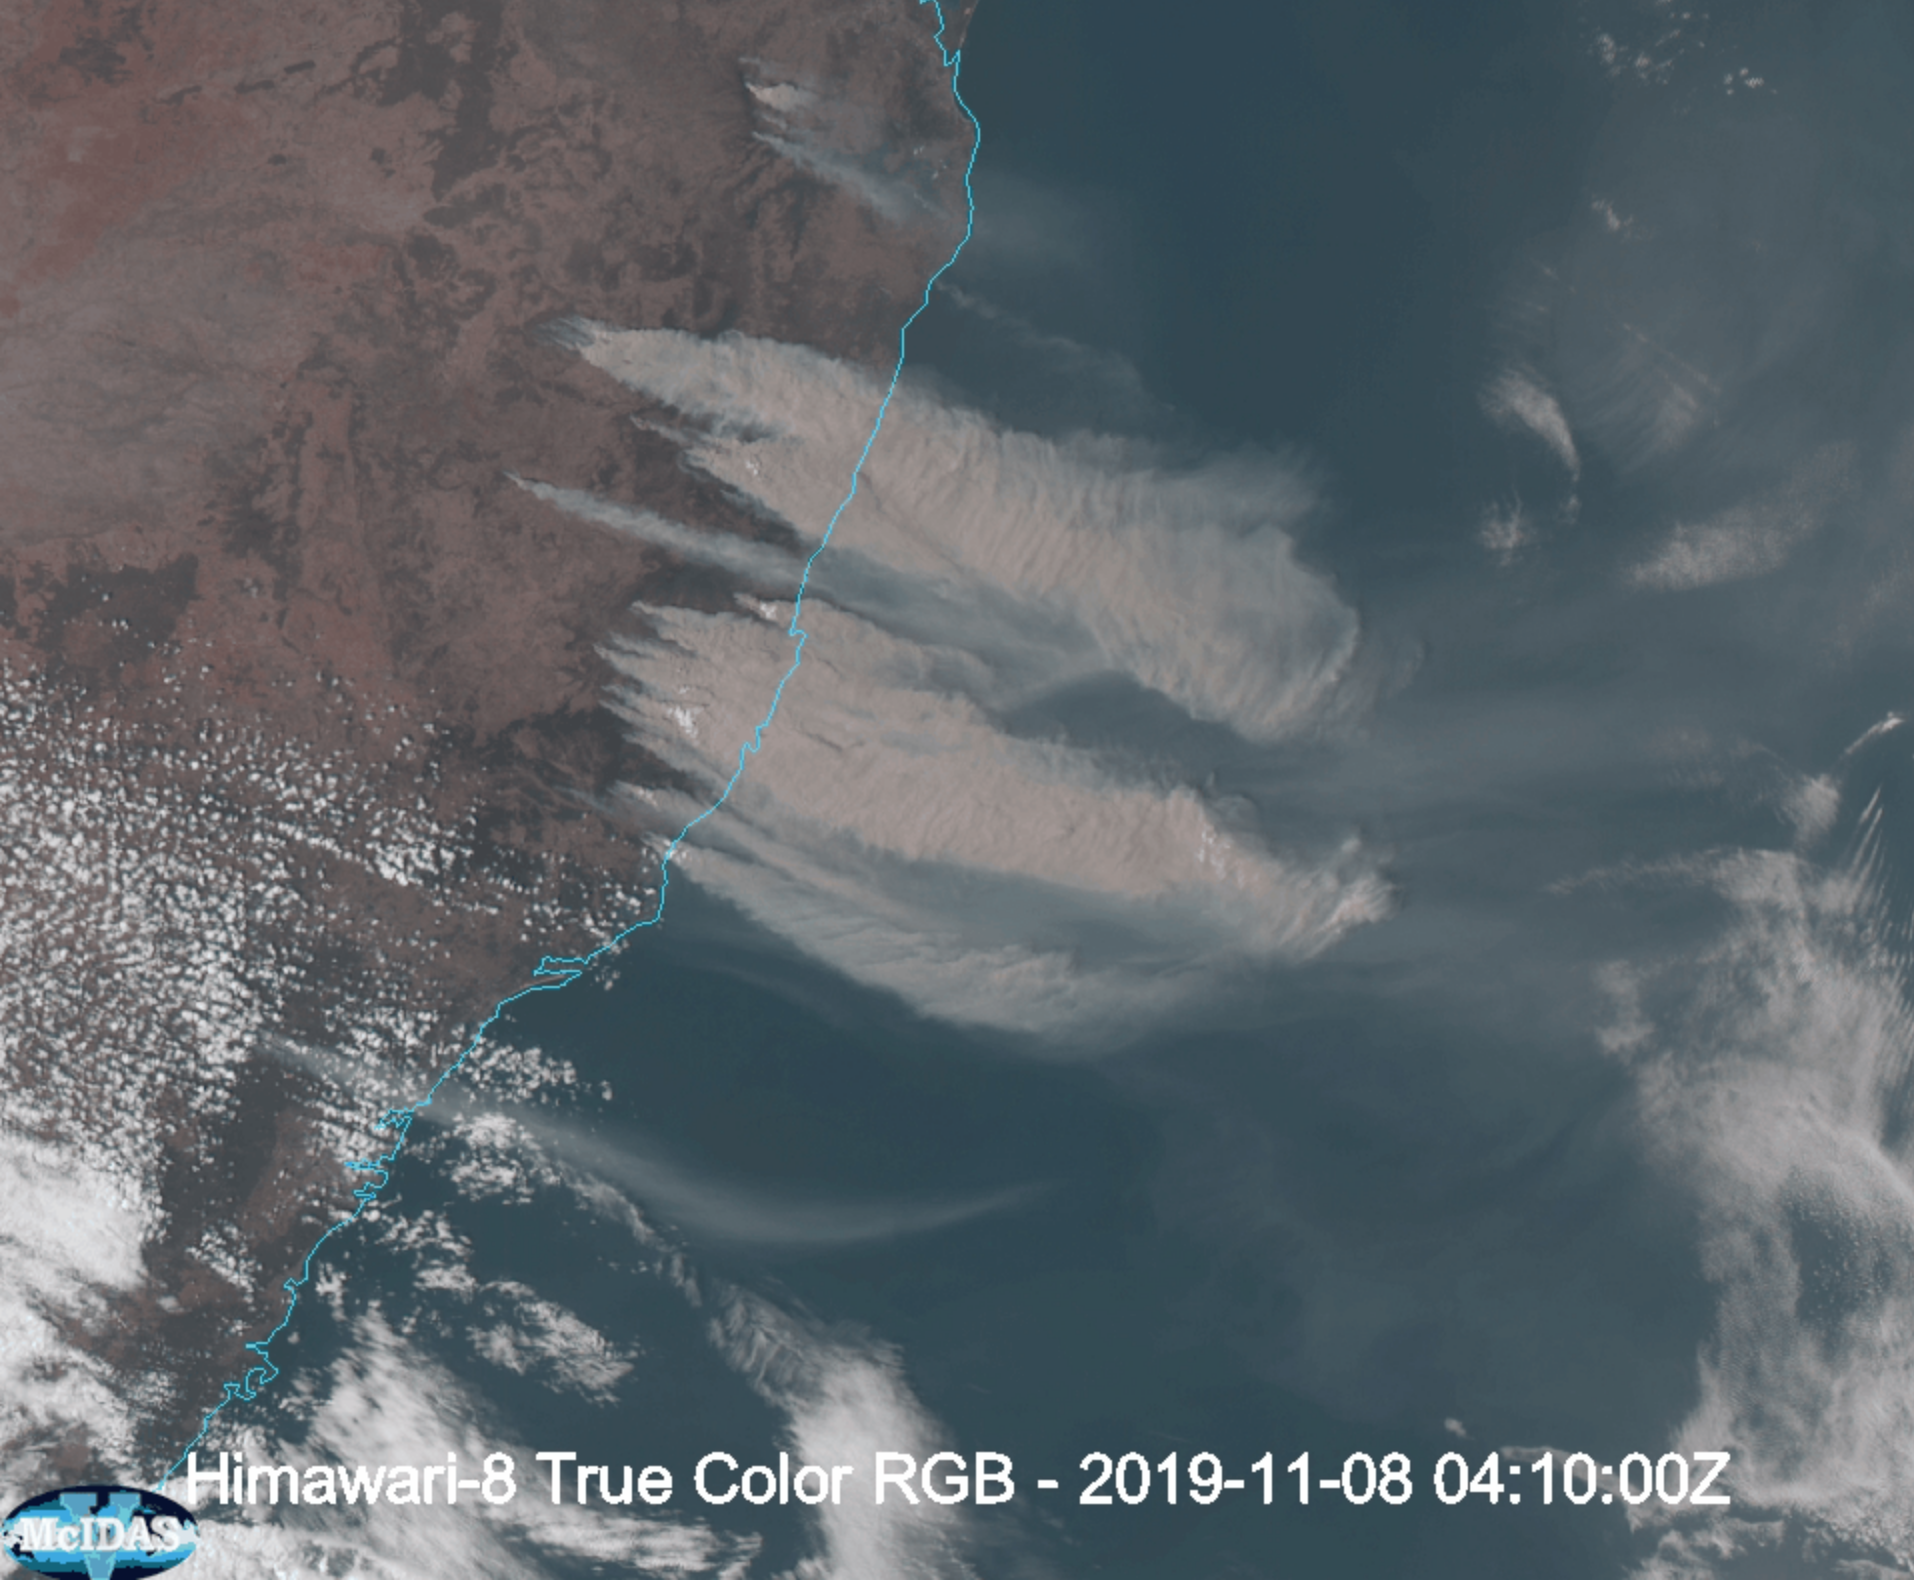
Himawari-8 True Color Red-Green-Blue (RGB) images created using
McIDAS-V (below) provided another view of the dense smoke plumes from 0000-0610 UTC. Toward the end of the animation — in the upper left portion of the satellite scene — plumes of blowing dust could be seen moving eastward from farther inland.
![Himawari-8 True Color RGB images (credit: Bob Carp, SSEC) [click to play animation | MP4]](https://cimss.ssec.wisc.edu/satellite-blog/wp-content/uploads/sites/5/2019/11/191108_0410utc_himawari8_truecolor.png)
Himawari-8 True Color RGB images (credit: Bob Carp, SSEC) [click to play animation | MP4]
A combination of Suomi NPP VIIRS True Color RGB and Shortwave Infrared (4.1 µm) imagery at 0328 UTC
(below) revealed hot thermal signatures of the fires
(yellow to red enhancement) at the source of the smoke plumes.
![Suomi NPP VIIRS True Color RGB + Shortwave Infrared (4.1 µm) imagery at 0328 UTC [click to enlarge]](https://cimss.ssec.wisc.edu/satellite-blog/wp-content/uploads/sites/5/2019/11/191108_0328utc_suomiNPP_viirs_trueColorRGB_shortwaveInfrared.jpg)
Suomi NPP VIIRS True Color RGB + Shortwave Infrared (4.1 µm) imagery at 0328 UTC (credit: Bob Carp, SSEC) [click to enlarge]
A toggle between a Suomi NPP VIIRS True Color RGB image and a display of Sentinel-5
TROPOMI Tropospheric Vertical Column NO2
(below) indicated high NO2 concentrations immediately downwind of these fires.
![Suomi NPP VIIRS True Color RGB image + TROPOMI Tropospheric Vertical Column NO2 [click to enlarge]](https://cimss.ssec.wisc.edu/satellite-blog/wp-content/uploads/sites/5/2019/11/NPP_TROPOMI_NO2.gif)
Suomi NPP VIIRS True Color RGB image + Sentinel-5 TROPOMI Tropospheric Vertical Column NO2 (credit: Bob Carp, SSEC) [click to enlarge]
The dense smoke plumes were also evident in a sequence of 3 VIIRS True Color RGB images from NOAA-20 and Suomi NPP, as visualized using
RealEarth (below).
![NOAA-20 and Suomi NPP VIIRS True Color RGB images [click to enlarge]](https://cimss.ssec.wisc.edu/satellite-blog/wp-content/uploads/sites/5/2019/11/191108_noaa20_suomiNPP_viirs_trueColorRGB_Australia_brushfires_anim.gif)
VIIRS True Color RGB images from NOAA-20 and Suomi NPP [click to enlarge]
Smoke reduced the surface visibility to 3 miles or less at Grafton (YGFN) from 03-05 UTC
(below).
![Time series of surface report data from Grafton, New South Wales [click to enlarge]](https://cimss.ssec.wisc.edu/satellite-blog/wp-content/uploads/sites/5/2019/11/191108_YGFN_SFCMG.GIF)
Time series of surface report data from Grafton, New South Wales [click to enlarge]
View only this post
Read Less
![EUMETSAT Meteosat-11 Visible (0.8 µm) images, with hourly plots of surface reports [click to play animation | MP4]](https://cimss.ssec.wisc.edu/satellite-blog/wp-content/uploads/sites/5/2019/11/191111_meteosat11_visible_Medicane_anim.gif)
![VIIRS True Color RGB and Infrared Window (11.45 µm) images from NOAA-20 and Suomi NPP [click to enlarge]](https://cimss.ssec.wisc.edu/satellite-blog/wp-content/uploads/sites/5/2019/11/191111_noaa20_suomiNPP_viirs_trueColorRGB_infraredWindow_Medicane_Trudy_anim.gif)
![Time series of surface observation data from Menorca, Spain [click to enlarge]](https://cimss.ssec.wisc.edu/satellite-blog/wp-content/uploads/sites/5/2019/11/191111_LEMH_SFCMG.GIF)
![Time series of surface observation data from Jijel, Algeria [click to enlarge]](https://cimss.ssec.wisc.edu/satellite-blog/wp-content/uploads/sites/5/2019/11/191111_DAAV_SFCMG.GIF)
![Himawari-8 Shortwave Infrared (3.9 µm) images, with hourly plots of surface reports [click to play animation | MP4]](https://cimss.ssec.wisc.edu/satellite-blog/wp-content/uploads/sites/5/2019/11/191108_himawari8_shortwaveInfrared_Australia_fires_anim.gif)
![Himawari-8 Longwave Infrared Window (10.4 µm) images, with hourly plots of surface reports [click to play animation | MP4]](https://cimss.ssec.wisc.edu/satellite-blog/wp-content/uploads/sites/5/2019/11/191108_himawari8_longwaveInfraredWindow_Australia_fires_anim.gif)
![Himawari-8 True Color RGB images (credit: Bob Carp, SSEC) [click to play animation | MP4]](https://cimss.ssec.wisc.edu/satellite-blog/wp-content/uploads/sites/5/2019/11/191108_himawari8_trueColorRGB_anim.gif)
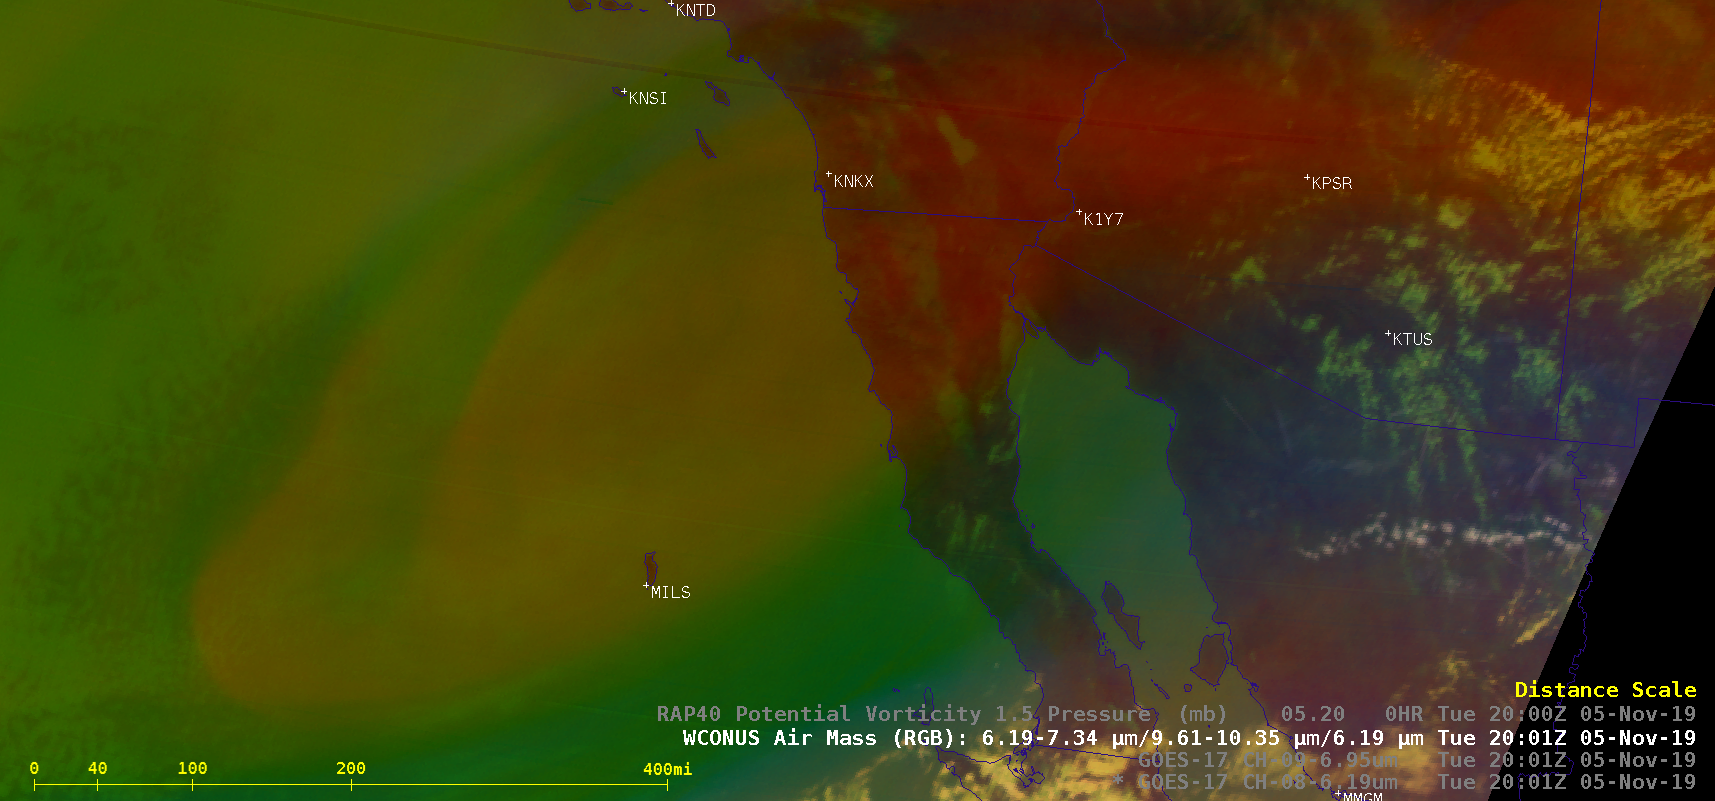
![GOES-17 Upper-level Water Vapor (6.2 µm), Mid-level Water Vapor (6.9 µm) and Air Mass RGB images, with and without contours of PV1.5 pressure [click to play animation |MP4]](https://cimss.ssec.wisc.edu/satellite-blog/wp-content/uploads/sites/5/2019/11/191105_goes17_waterVapor_airmassRGB_Baja_pv_anomaly_anim.gif)
![GOES-17 Upper-level Water Vapor (6.2 µm) images, with plots of available NOAA-20 NUCAPS soundings [click to enlarge]](https://cimss.ssec.wisc.edu/satellite-blog/wp-content/uploads/sites/5/2019/11/baja_wv8_dt_nucaps-20191105_205119.png)
![NUCAPS sounding profile for Point 1 [click to enlarge]](https://cimss.ssec.wisc.edu/satellite-blog/wp-content/uploads/sites/5/2019/11/191105_20utc_nucaps_dt.png)
![NUCAPS sounding profile for Point 2 [click to enlarge]](https://cimss.ssec.wisc.edu/satellite-blog/wp-content/uploads/sites/5/2019/11/191105_20utc_nucaps_dry.png)
![Sequence of individual GOES-16 ABI spectral bands, from 1358-1406 UTC [click to play animation | MP4]](https://cimss.ssec.wisc.edu/satellite-blog/wp-content/uploads/sites/5/2019/11/191102_goes16_Wallops_Antares_rocket_launch_anim.gif)
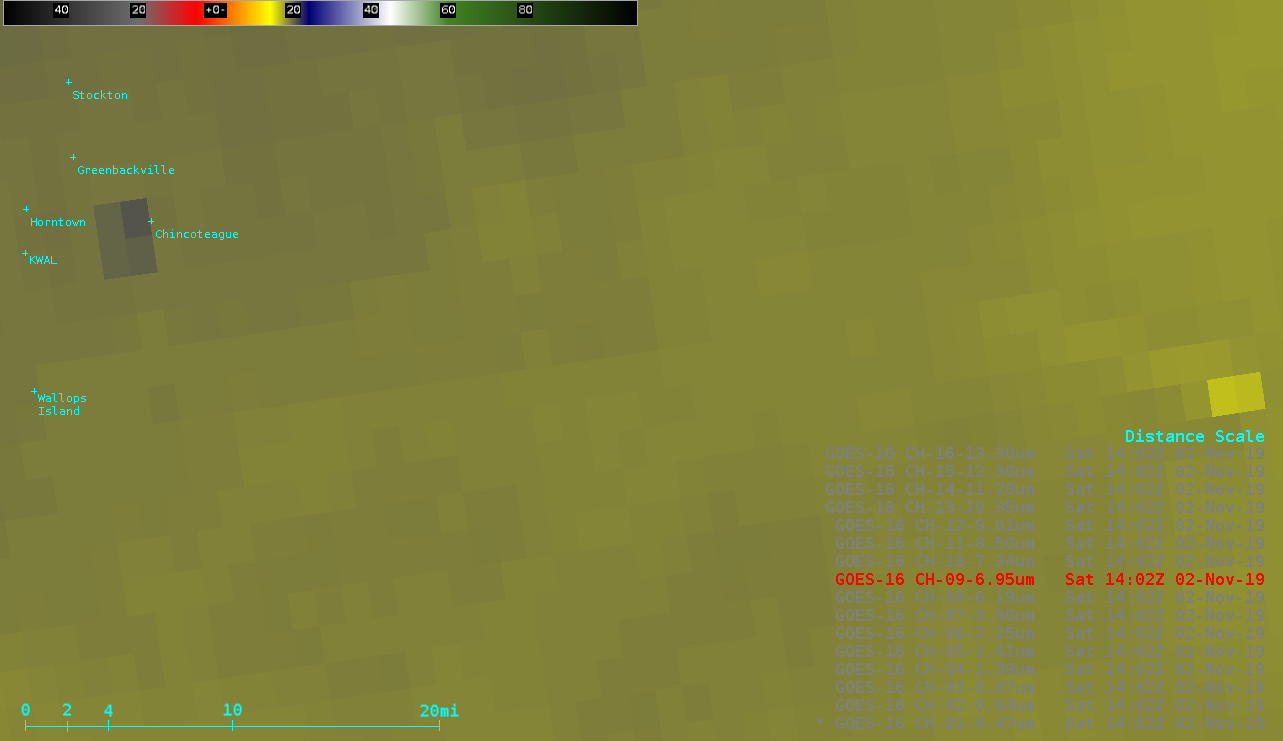
![GOES-16 Shortwave Infrared (3.9 µm) and Water Vapor (6.2 µm, 6.9 µm and 7.3 µm) images at 1402 UTC [click to enlarge]](https://cimss.ssec.wisc.edu/satellite-blog/wp-content/uploads/sites/5/2019/11/191102_1402utc_goes16_shortwaveInfrared_waterVapor_Wallops_Antares_thermal_signature_anim.gif)
![16-panel images of GOES-16 ABI spectral bands from 1400-1406 UTC [click to play animation]](https://cimss.ssec.wisc.edu/satellite-blog/wp-content/uploads/sites/5/2019/11/191102_goes16_abi16panel_Wallops_Antares_rocket_launch_anim.gif)
![GOES-16 Cloud Top Temperature and Cloud Top Phase products [click to enlarge]](https://cimss.ssec.wisc.edu/satellite-blog/wp-content/uploads/sites/5/2019/11/191102_goes16_cloudTopTemperature_cloudTopPhase_Wallops_Antares_rocket_launch_anim.gif)
![Plot of 12 UTC rawinsonde data from Wallops Flight Facility, Virginia [click to enlarge]](https://cimss.ssec.wisc.edu/satellite-blog/wp-content/uploads/sites/5/2019/11/191102_12UTC_KWAL_RAOB.GIF)
