GOES-16 (GOES-East) “Clean” Infrared Window (10.35 µm) images (above) showed pockets of cold surface brightness temperatures — darker blue represented the -30 to -35ºC (-22 to -31ºF) range — over parts of North Dakota during the 4 hours leading up to sunrise on 10 December 2019. As of 12 UTC, the coldest locations... Read More
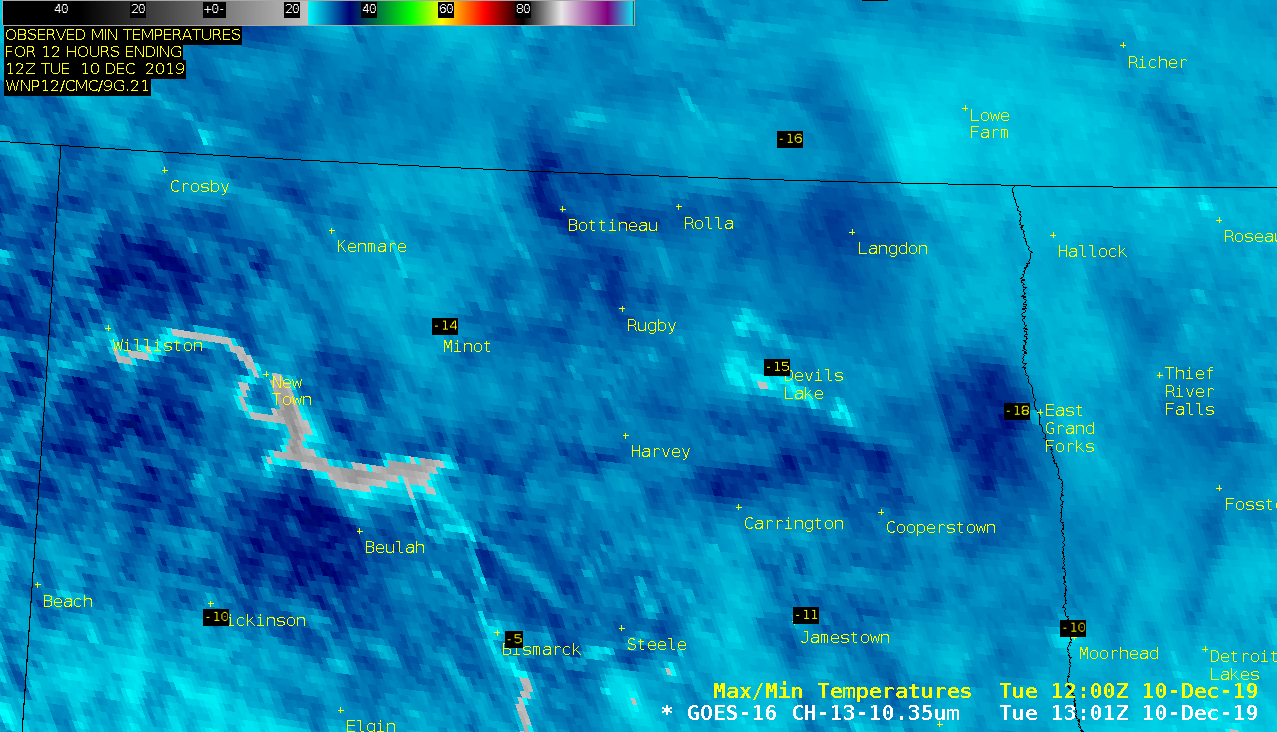
GOES-16 “Clean” Infrared Window (10.35 µm) images, with select minimum temperatures as of 12 UTC [click to play animation | MP4]
GOES-16
(GOES-East) “Clean” Infrared Window (
10.35 µm) images
(above) showed pockets of cold surface brightness temperatures — darker blue represented the -30 to -35ºC (-22 to -31ºF) range — over parts of North Dakota during the 4 hours leading up to sunrise on
10 December 2019. As of 12 UTC, the coldest locations in the US (including
Alaska) were Rugby and Watford City, North Dakota with -22ºF; however, Grand Forks International Airport later dropped to -25ºF at 1245 UTC.
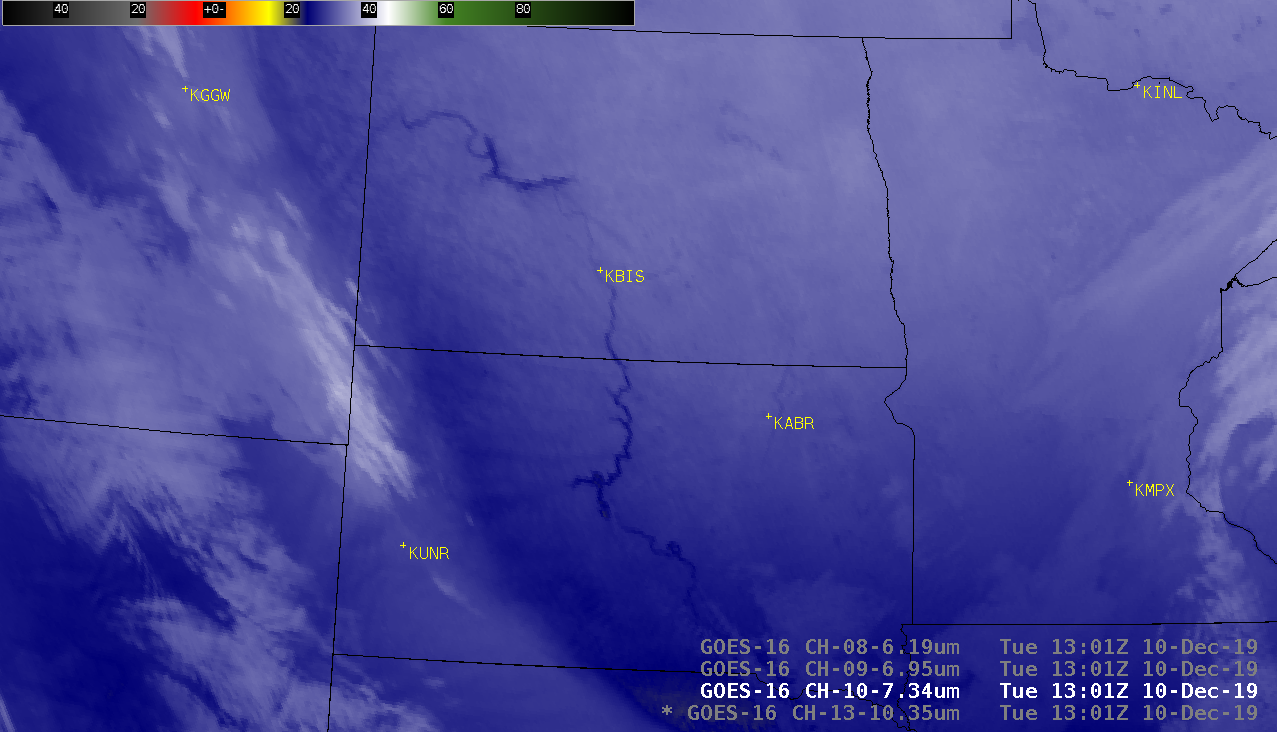
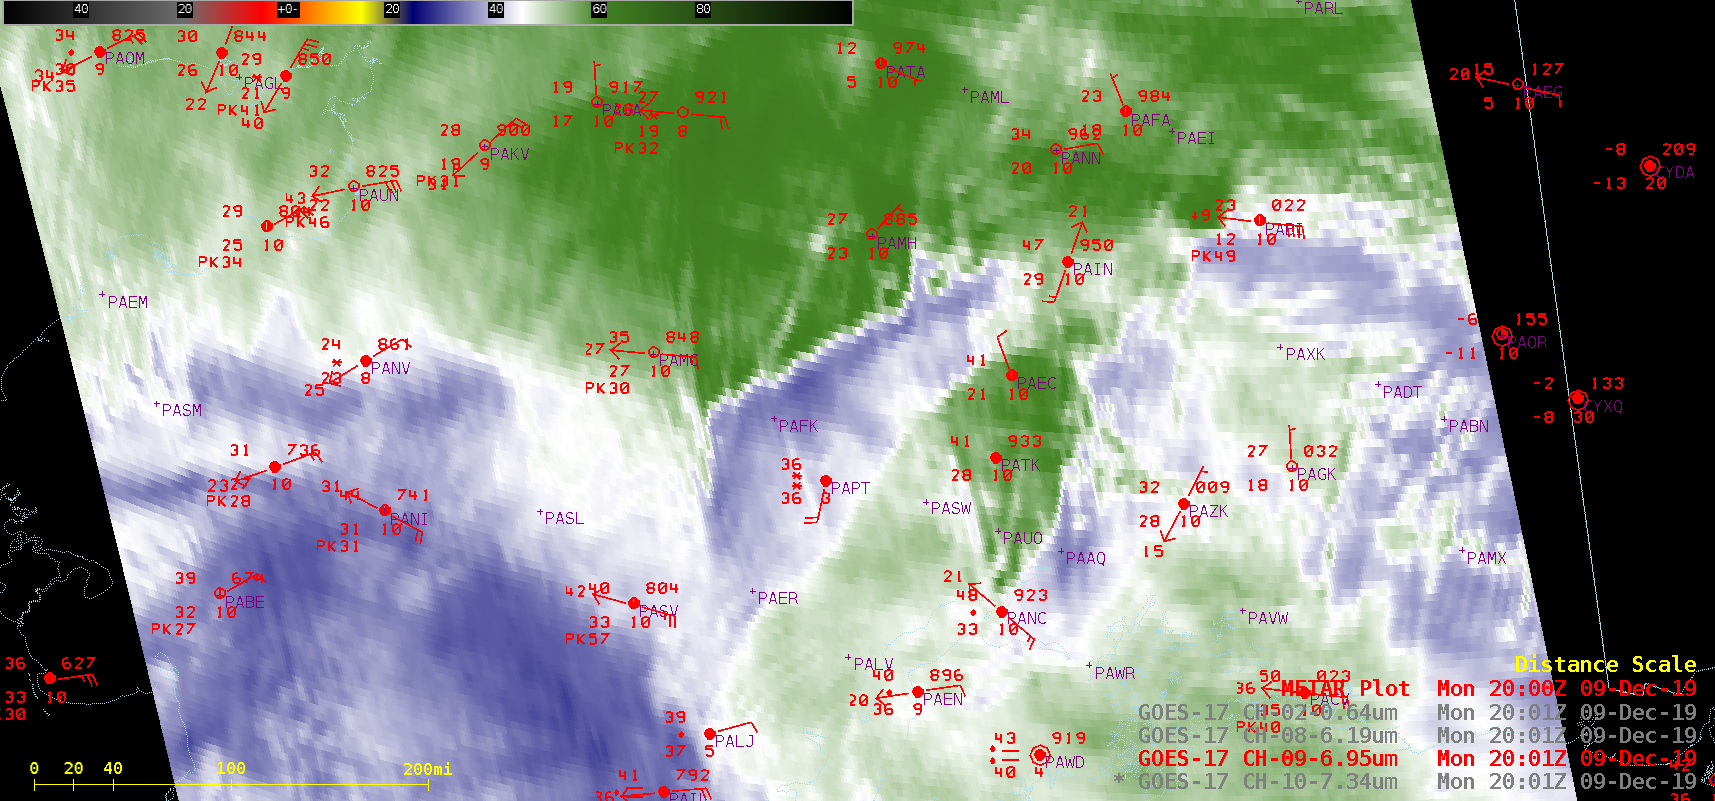
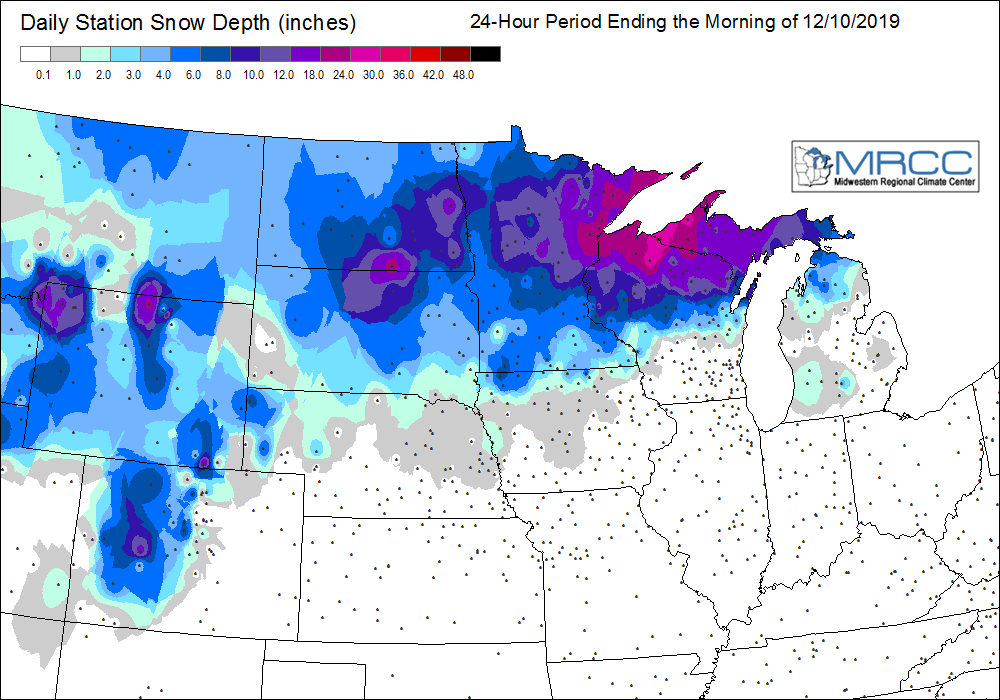
With the cold and dry arctic air mass in place across the Upper Midwest, GOES-16 Low-level (7.3 µm) and Mid-level (6.9 µm) Water Vapor imagery (below) was able to sense the thermal contrast between cold, snow-covered land surfaces and the still-unfrozen reservoirs along the Missouri River in North Dakota and South Dakota.
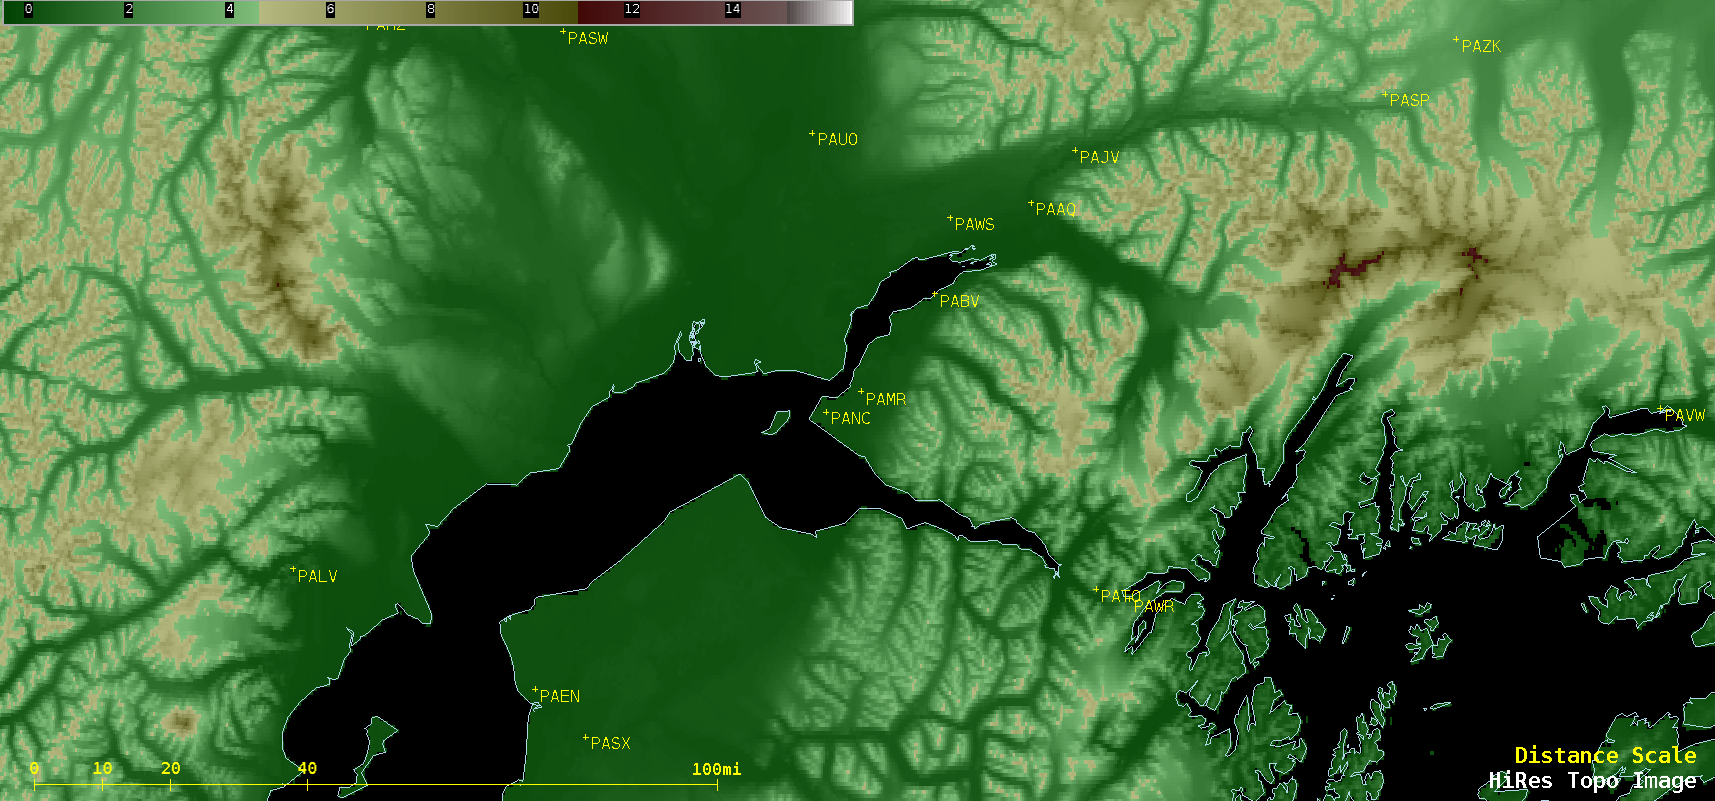
![GOES-16 Low-level (7.3 µm) and Mid-level (6.9 µm) images, with rawinsonde sites indicated in yellow [click to play animation | MP4]](https://cimss.ssec.wisc.edu/satellite-blog/wp-content/uploads/sites/5/2019/12/nd_wv10-20191210_130115.png)
GOES-16 Low-level (7.3 µm) and Mid-level (6.9 µm) images, with rawinsonde sites indicated in yellow [click to play animation | MP4]
GOES-16 Water Vapor
weighting functions calculated using 12 UTC rawinsonde data from Aberdeen, SD
(below) showed the downward shift of the peak pressures for all 3 spectral bands — with some contributions of radiation originating from the surface indicated for both the 7.3 µm and 6.9 µm bands.
![GOES-16 Water Vapor weighting functions calculated using 12 UTC rawinsonde data from Aberdeen, SD [click to enlarge]](https://cimss.ssec.wisc.edu/satellite-blog/wp-content/uploads/sites/5/2019/12/191210_12utc_kabr_waterVapor_weightingFunctions.png)
GOES-16 Water Vapor weighting functions calculated using 12 UTC rawinsonde data from Aberdeen, SD [click to enlarge]
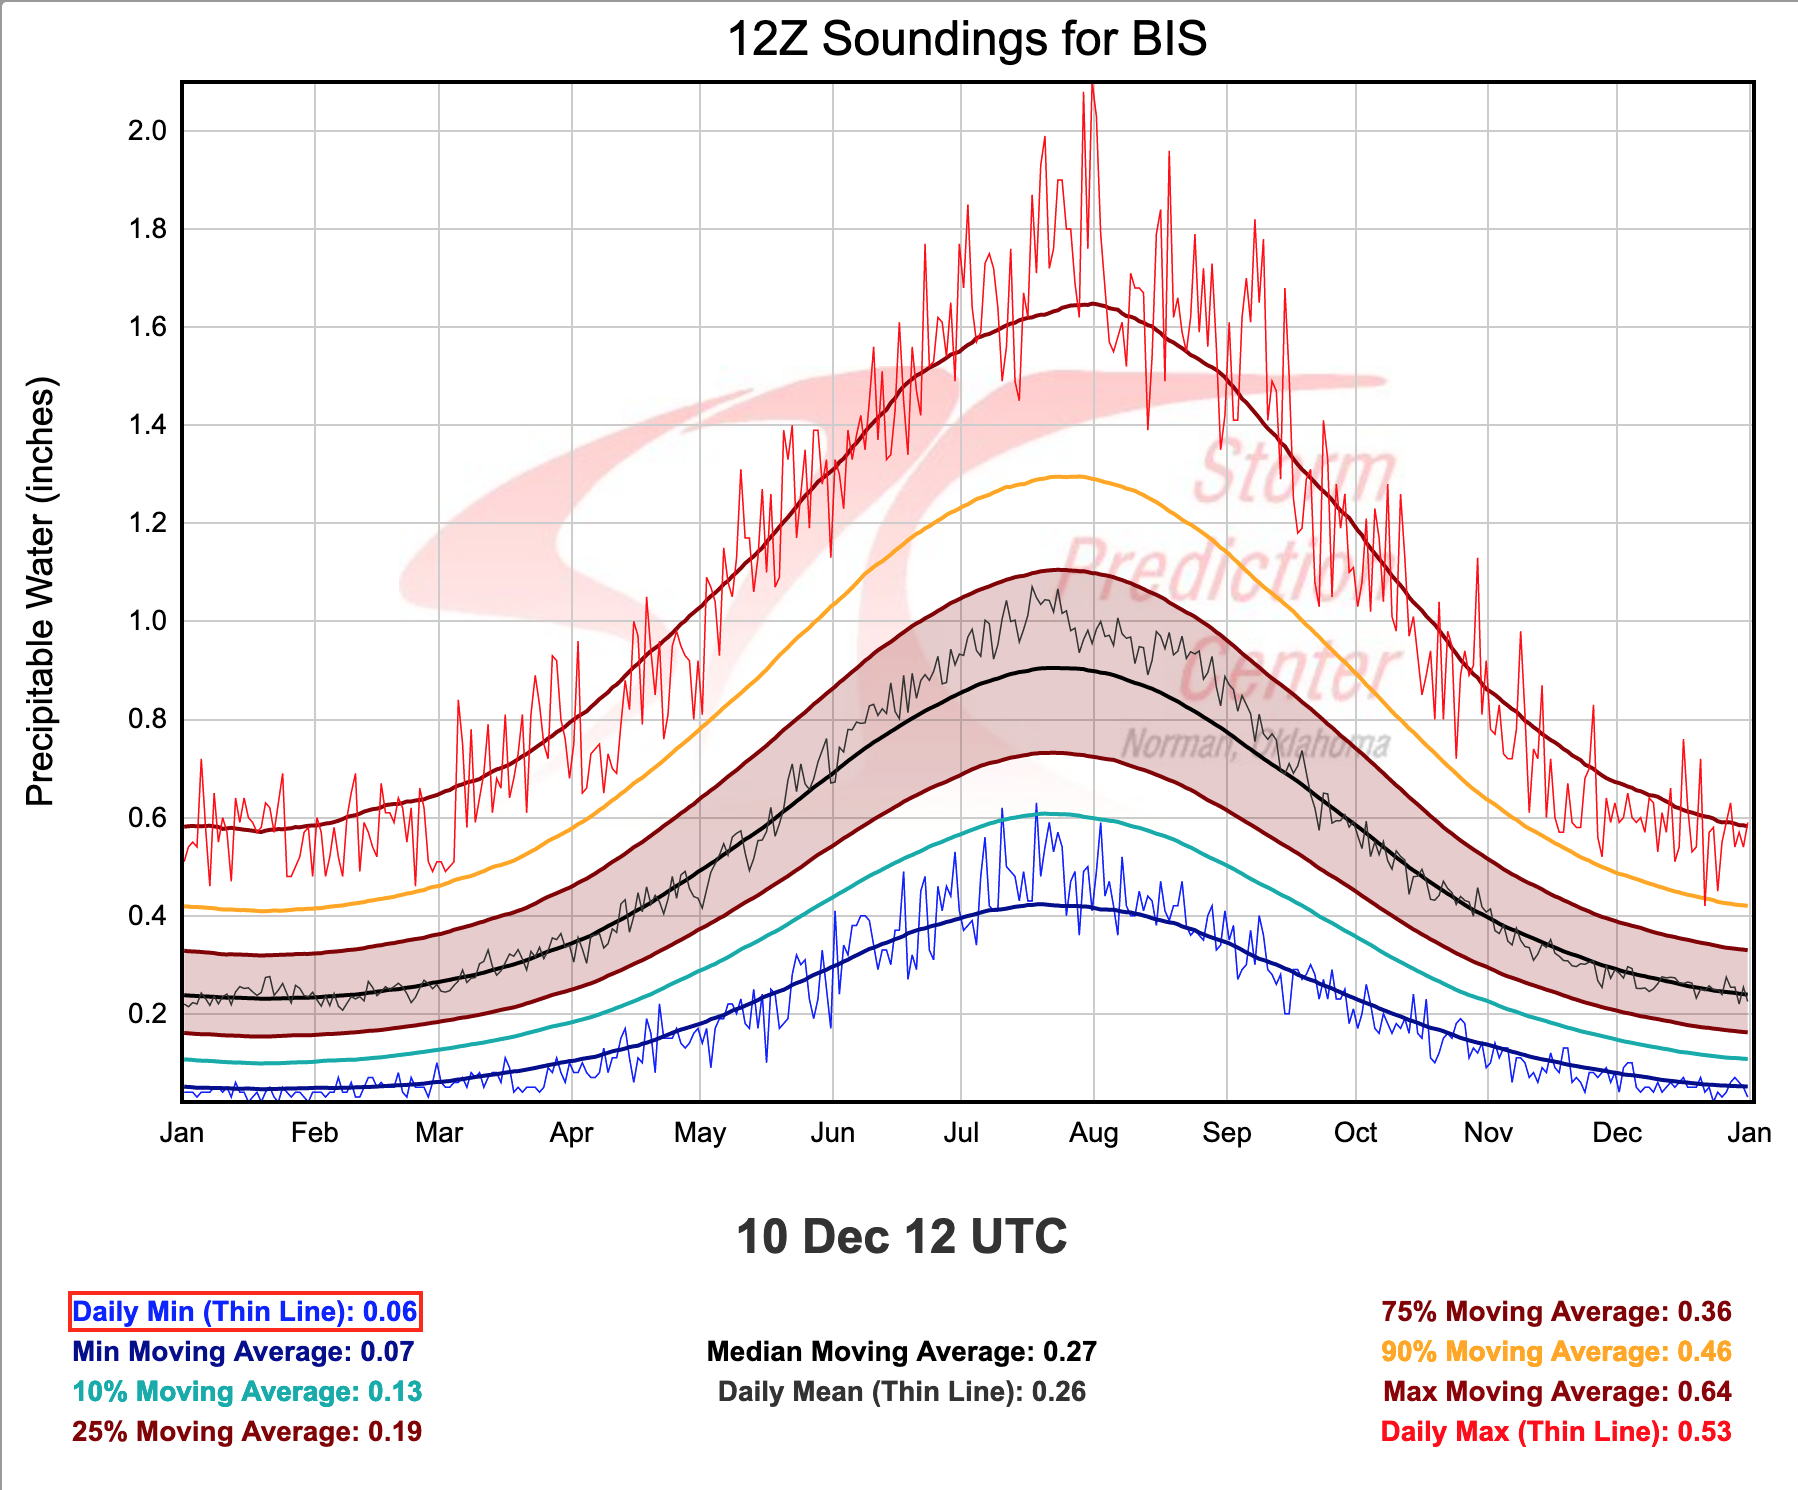
According to the
climatology of Precipitable Water for Aberdeen SD
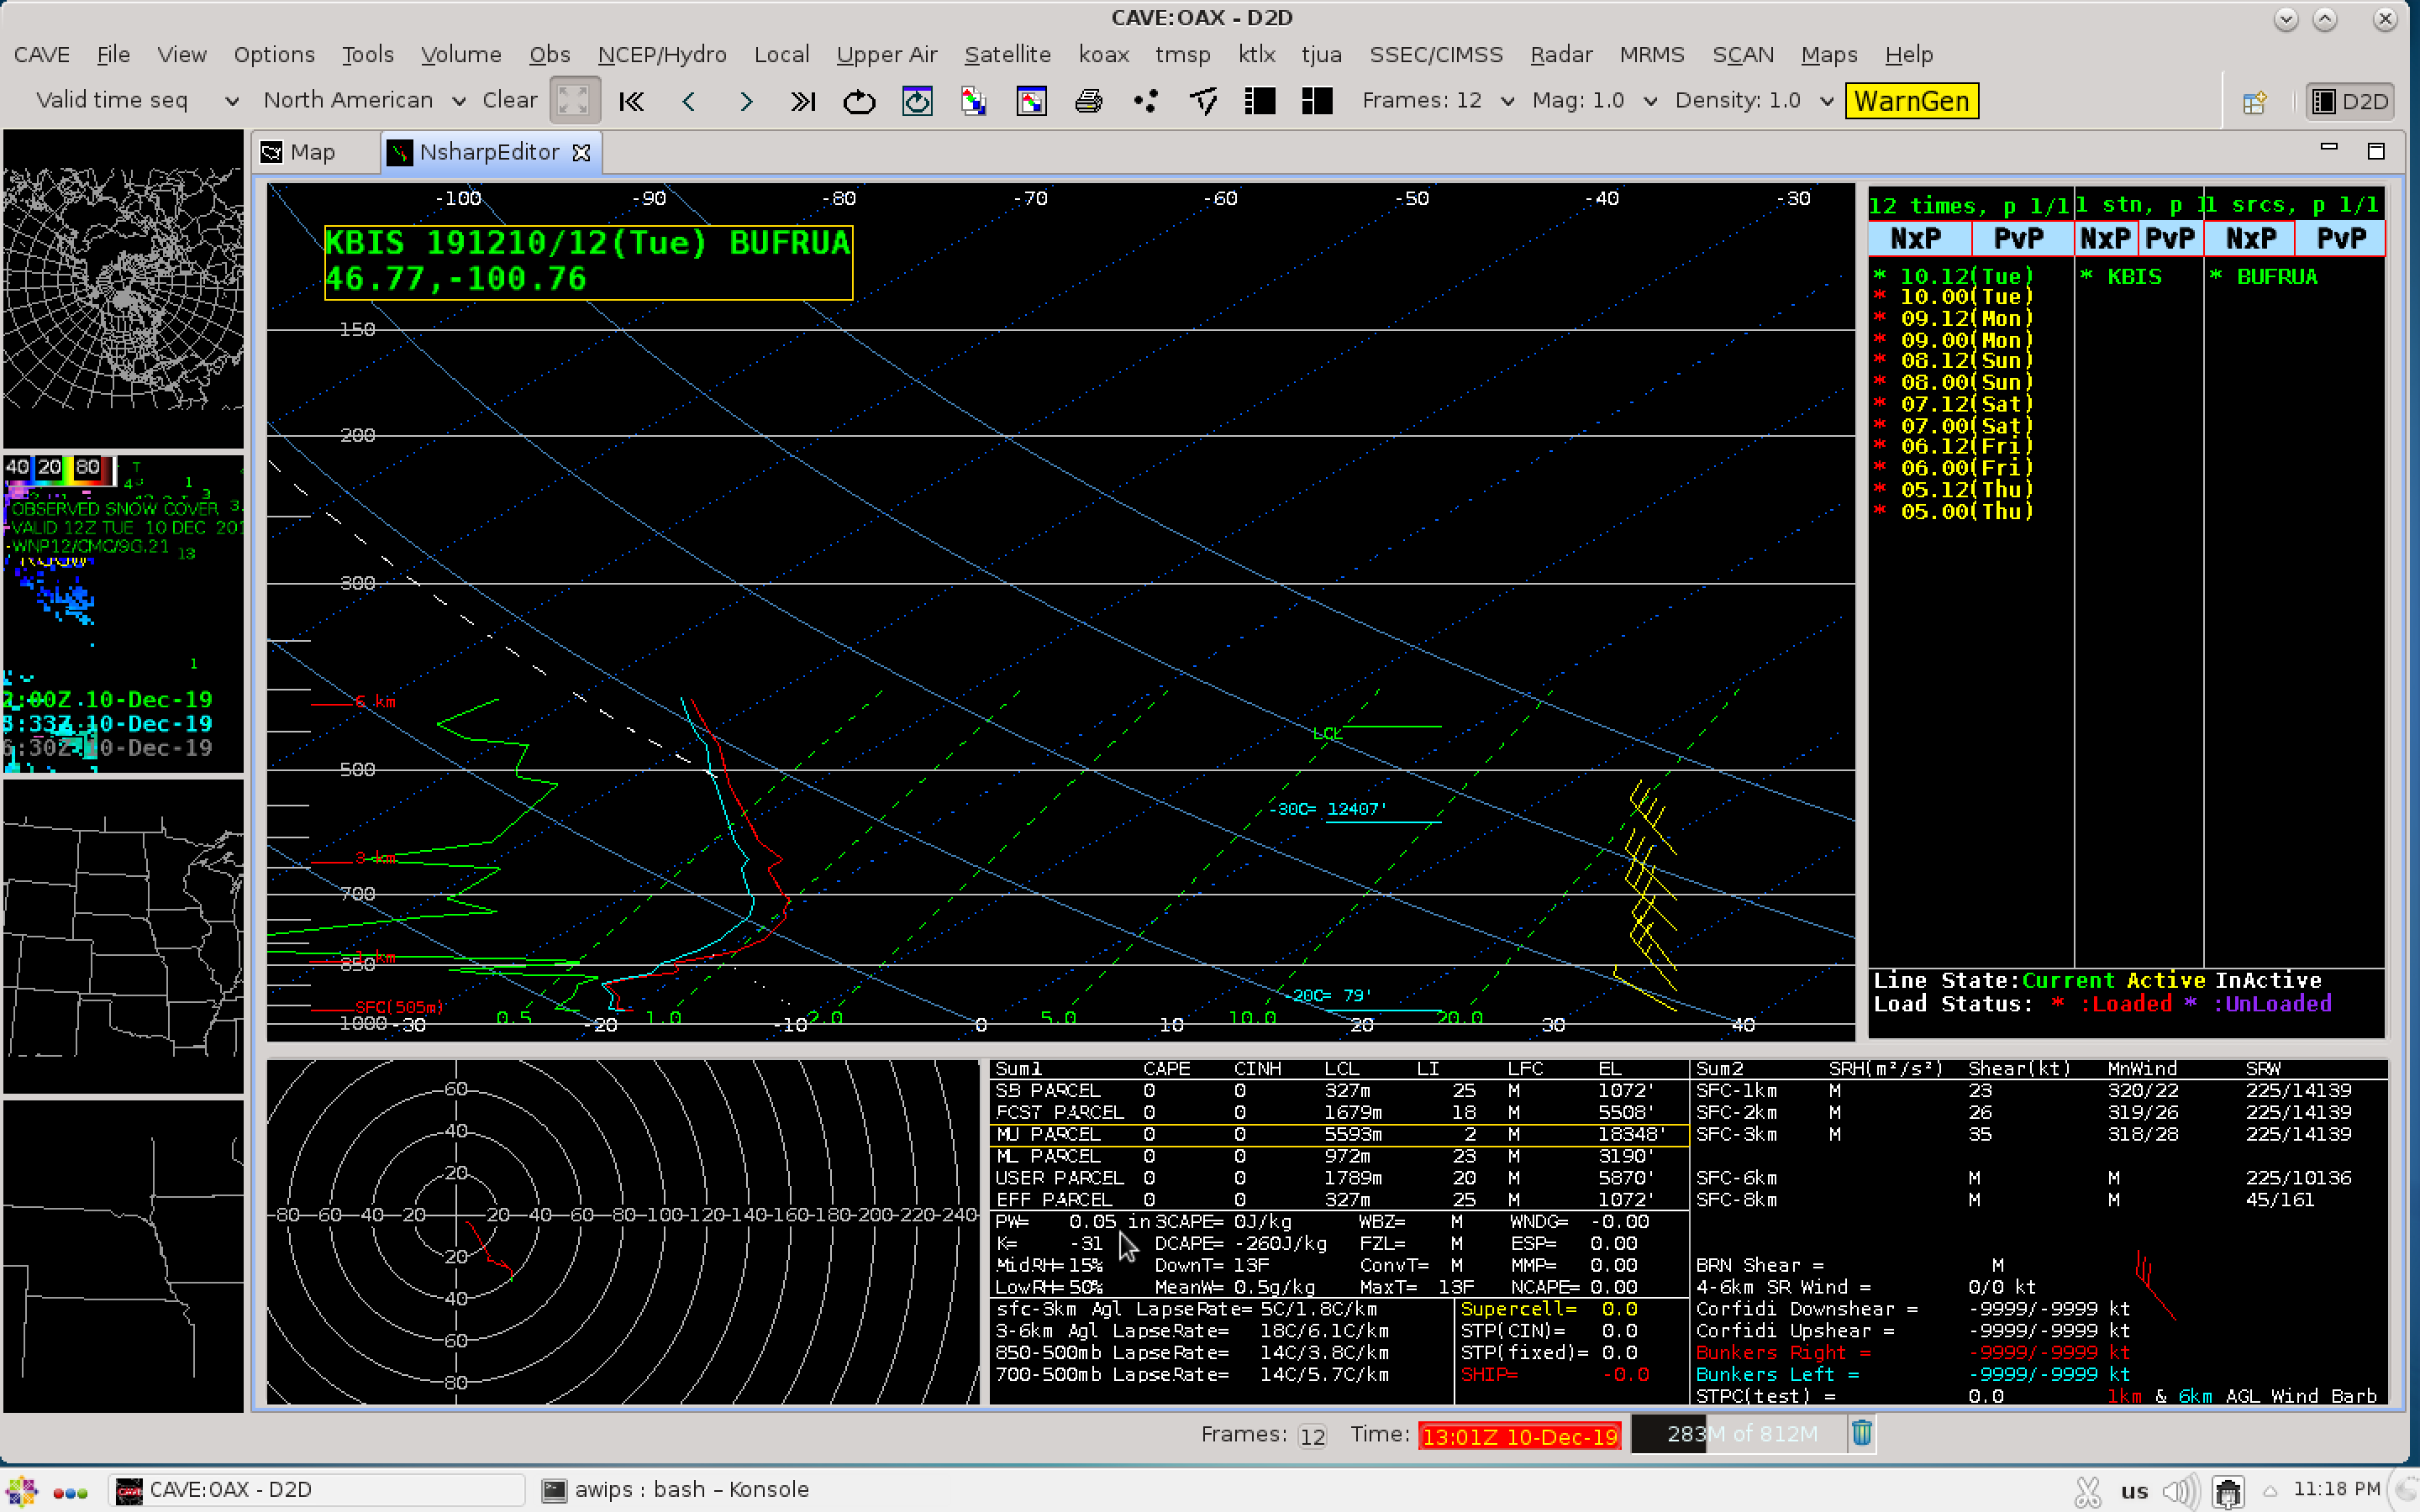
(below), the 12 UTC value of 0.06 inch tied the record minimum value for that date/time. The 12 UTC sounding at
Bismarck ND failed at a pressure level near 400 hPa — but the PW value of 0.05 inch calculated from that data would be slightly less than the
record minimum value of 0.06 inch for that date/time.
![Climatology of Precipitable Water for Aberdeen, SD [click to enlarge]](https://cimss.ssec.wisc.edu/satellite-blog/wp-content/uploads/sites/5/2019/12/191210_12utc_kabr_precipitableWater_climatology.png)
Climatology of Precipitable Water for Aberdeen, SD [click to enlarge]
On a NOAA-20 VIIRS Visible (0.64 µm) image with plots of available NUCAPS sounding locations
(below), soundings northeast of Bismarck KBIS and southeast of Aberdeen KABR are denoted by 1 and 2, respectively.
![NOAA-20 VIIRS Visible (0.64 µm) image, with plots of available NUCAPS sounding locations [click to enlarge]](https://cimss.ssec.wisc.edu/satellite-blog/wp-content/uploads/sites/5/2019/12/nd_sd_viirs_vis_nucaps-20191210_195005.png)
NOAA-20 VIIRS Visible (0.64 µm) image, with plots of available NUCAPS sounding locations [click to enlarge]
Plots of the NOAA-20 NUCAPS sounding profiles northeast of Bismarck KBIS and southeast of Aberdeen KABR around 19 UTC are shown below. Precipitable Water values calculated for these two soundings remained quite low, at 0.03 inch and 0.04 inch.
![NOAA-20 NUCAPS sounding profile northeast of Bismarck (Point 1) [click to enlarge]](https://cimss.ssec.wisc.edu/satellite-blog/wp-content/uploads/sites/5/2019/12/191210_19utc_nucaps_KBIS.png)
NOAA-20 NUCAPS sounding profile northeast of Bismarck KBIS (Point 1) [click to enlarge]
![NOAA-20 NUCAPS sounding profile southeast of Aberdeen KABR (Point 2) [click to enlarge]](https://cimss.ssec.wisc.edu/satellite-blog/wp-content/uploads/sites/5/2019/12/191210_19utc_nucaps_KABR.png)
NOAA-20 NUCAPS sounding profile southeast of Aberdeen KABR (Point 2) [click to enlarge]
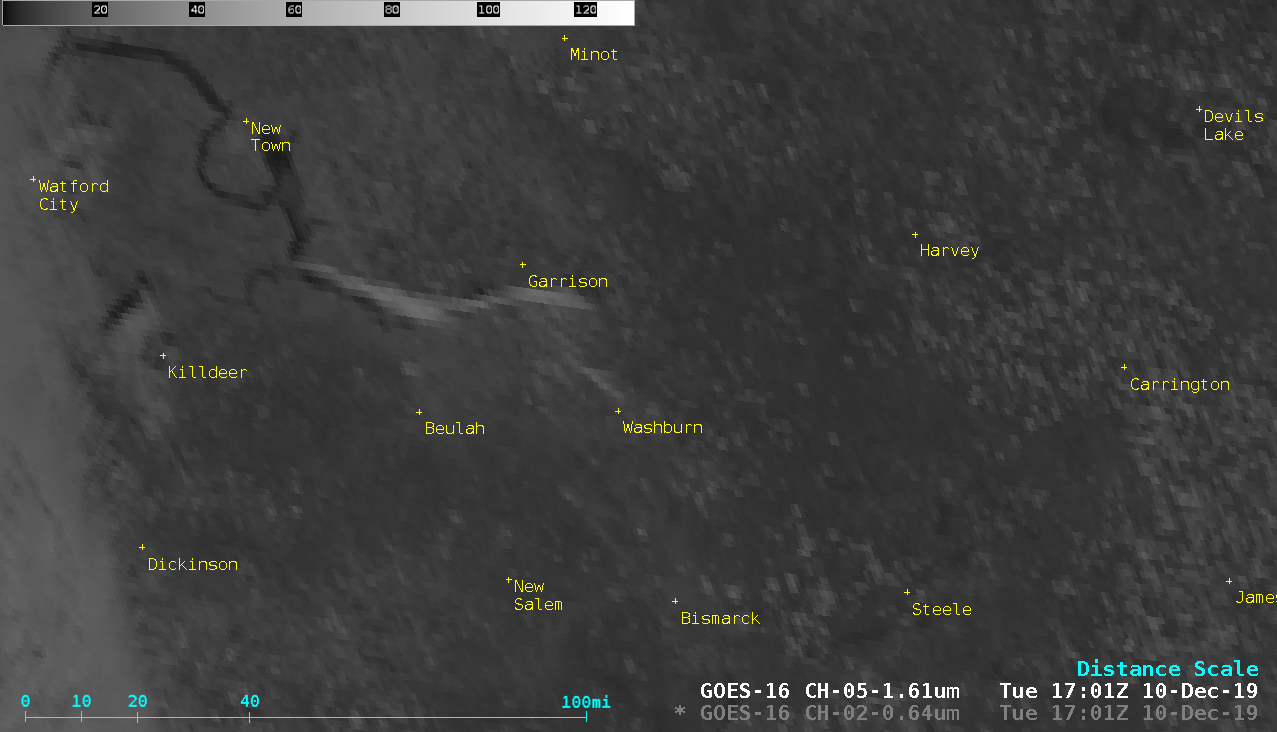
GOES-16 “Red” Visible (0.64 µm) and Near-Infrared “Snow/Ice” (1.61 µm) images [click to play animation | MP4]
Examples of “river effect” cloud plumes — produced by cold air flowing across deep, relatively warm water in some of the Missouri River reservoirs — were evident in GOES-16 “Red” Visible (
0.64 µm) and Near-Infrared “Snow/Ice” (
1.61 µm) images over North Dakota
(above) and South Dakota
(below).
![GOES-16 "Red" Visible (0.64 µm) and Near-Infrared "Snow/Ice" (1.61 µm) images [click to play animation | MP4]](https://cimss.ssec.wisc.edu/satellite-blog/wp-content/uploads/sites/5/2019/12/sd_nir_zoom-20191210_170115.png)
GOES-16 “Red” Visible (0.64 µm) and Near-Infrared “Snow/Ice” (1.61 µm) images [click to play animation | MP4]
View only this post
Read Less

![GOES-16 "Clean" Infrared Window (10.35 um), with SPC Storm Reports plotted in cyan [click to play animation | MP4]](https://cimss.ssec.wisc.edu/satellite-blog/wp-content/uploads/sites/5/2019/12/https://cimss.ssec.wisc.edu/satellite-blog/images/2019/12/191216_goes16_infrared_spcStormReports_Lower_Mississippi_Valley_anim.gif.gif)

![GOES-16 Mid-level (6.9 µm) Water Vapor images, with plots of Pilot Reports of turbulence (cyan and red), Turbulence SIGMETS (red boxes) and RAP40 model isotachs of maximum wind (yellow) [click to play animation | MP4]](https://cimss.ssec.wisc.edu/satellite-blog/wp-content/uploads/sites/5/2019/12/191213_goes16_waterVapor_pilotPreports_turbulenceSigmets_anim.gif)
![GOES-16 Water Vapor (6.9 µm) image with a pilot report of severe turbulence at 36,000 feet [click to enlarge]](https://cimss.ssec.wisc.edu/satellite-blog/wp-content/uploads/sites/5/2019/12/191213_1637utc_pirep.png)
![GOES-16 Water Vapor (6.9 µm) image with a pilot report of moderate to severe turbulence at 37,000 feet [click to enlarge]](https://cimss.ssec.wisc.edu/satellite-blog/wp-content/uploads/sites/5/2019/12/191213_1645utc_pirep.png)
![GOES-16 Low-level (7.3 µm) and Mid-level (6.9 µm) images, with rawinsonde sites indicated in yellow [click to play animation | MP4]](https://cimss.ssec.wisc.edu/satellite-blog/wp-content/uploads/sites/5/2019/12/191210_goes16_waterVapor_ND_SD_anim.gif)
![GOES-16 "Red" Visible (0.64 µm) and Near-Infrared "Snow/Ice" (1.61 µm) images [click to play animation | MP4]](https://cimss.ssec.wisc.edu/satellite-blog/wp-content/uploads/sites/5/2019/12/191210_goes16_visible_snowIce_SD_anim.gif)

![MIMIC Total Precipitable Water product [click to play animation | MP4]](https://cimss.ssec.wisc.edu/satellite-blog/wp-content/uploads/sites/5/2019/12/191208_191209_mimicTPW_AK_anim.gif)
