Orographically-trapped waves near Haida Gwaii
![GOES-17 Low-level (7.3 µm), Mid-level (6.9 µm) and Upper-level (6.2 µm) Water Vapor images, with topography [click to play animation | MP4]](https://cimss.ssec.wisc.edu/satellite-blog/wp-content/uploads/sites/5/2019/04/190422_goes17_waterVapor_Haida_Gwaii_waves_anim.gif)
GOES-17 Low-level (7.3 µm), Mid-level (6.9 µm) and Upper-level (6.2 µm) Water Vapor images, with topography [click to play animation | MP4]
Note that the wave signatures became more attenuated — especially over the southern portion of the Strait — as middle-tropospheric moisture began to overspread the area. This moisture at higher altitudes absorbed radiation being emitted from below, and re-radiated energy at the colder temperatures found within that layer of mid-level moisture.
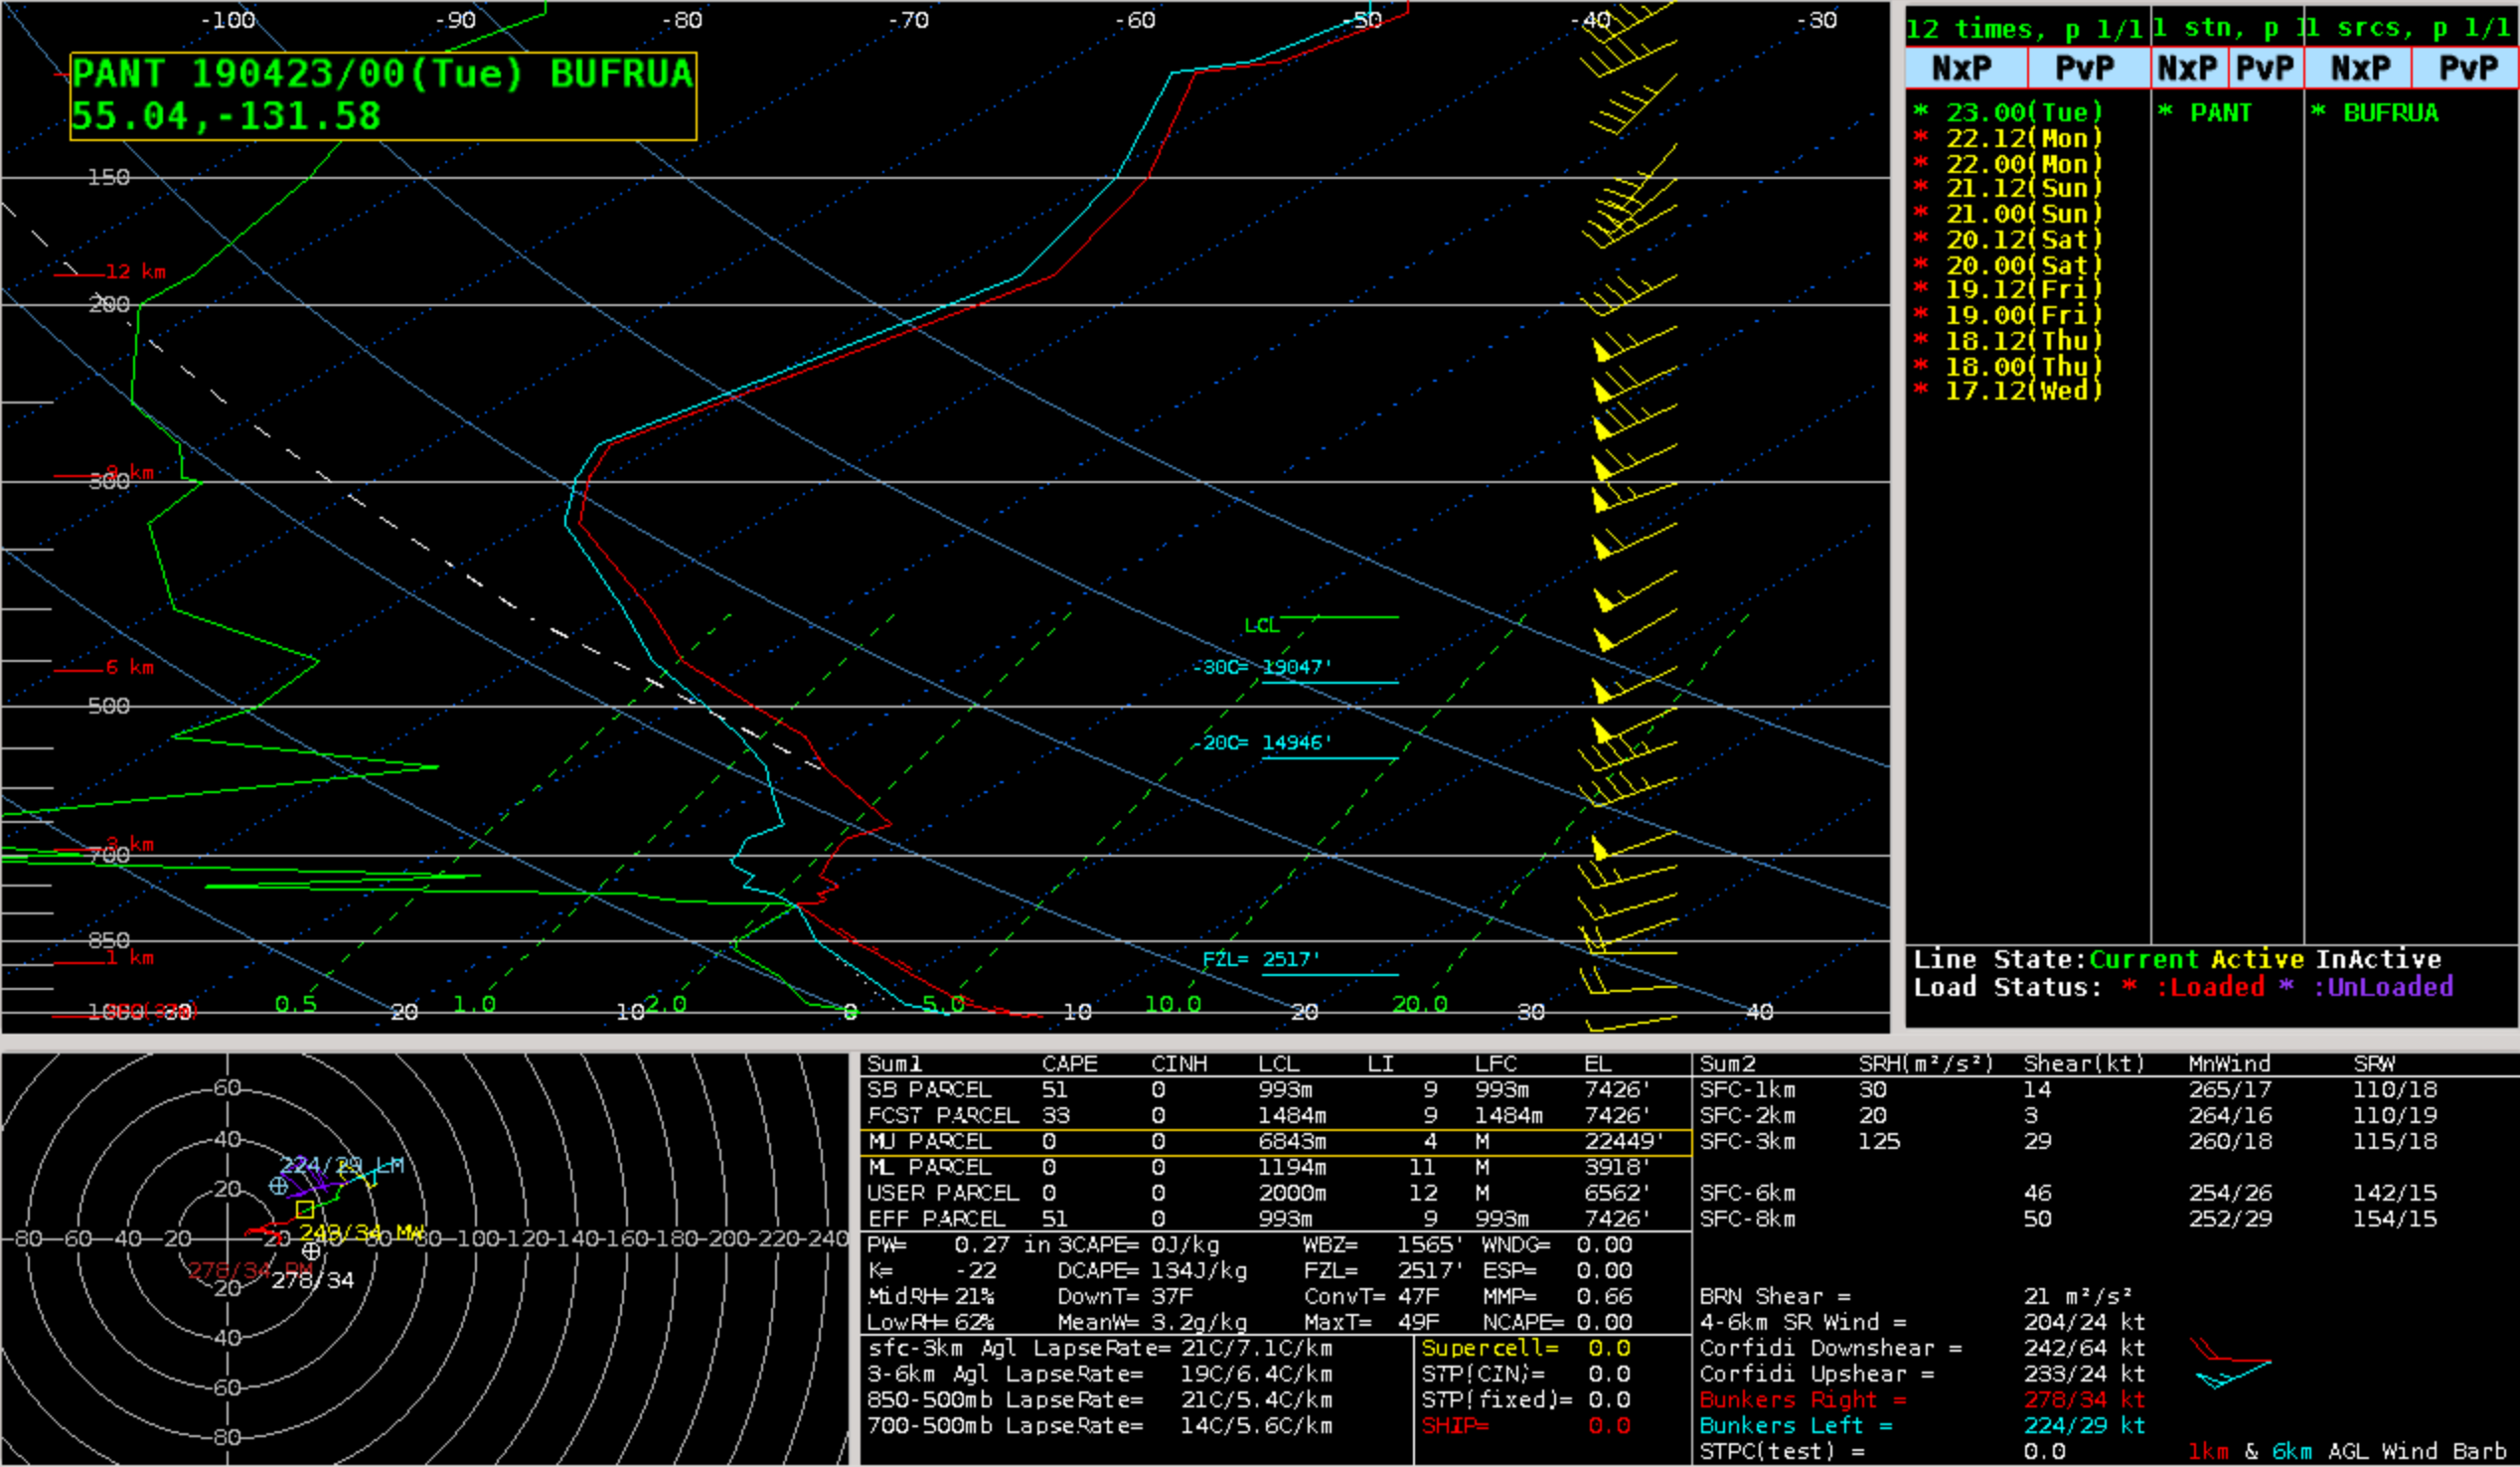
A plot of GOES-17 Water Vapor weighting functions calculated using 00 UTC rawinsonde data from Annette Island, Alaska (below) showed significant contributions for Band 10 (7.3 µm, violet) and Band 9 (6.9 µm, blue) radiation coming from within the 700-850 hPa range, so it’s likely that many of the waves resided within that layer. Higher-altitude contributions from the 500-600 hPa layer were due to the aforementioned high-level moisture that later moved over the region.
![GOES-17 Water Vapor weighting functions calculated from 12 UTC rawinsonde data at Annette Island, Alaska [click to enlarge]](https://cimss.ssec.wisc.edu/satellite-blog/wp-content/uploads/sites/5/2019/04/190423_00utc_pant_waterVapor_weightingFunctions.png)
GOES-17 Water Vapor weighting functions calculated from 00 UTC rawinsonde data at Annette Island, Alaska [click to enlarge]
![Suomi NPP VIIRS Visible (0.64 µm) and Infrared Window (11.45 µm) images at 2137 UTC [click to enlarge]](https://cimss.ssec.wisc.edu/satellite-blog/wp-content/uploads/sites/5/2019/04/190422_2137utc_suomiNPP_viirs_visible_infrared_Haida_Gwaii_anim.gif)
Suomi NPP VIIRS Visible (0.64 µm) and Infrared Window (11.45 µm) images at 2137 UTC [click to enlarge]