
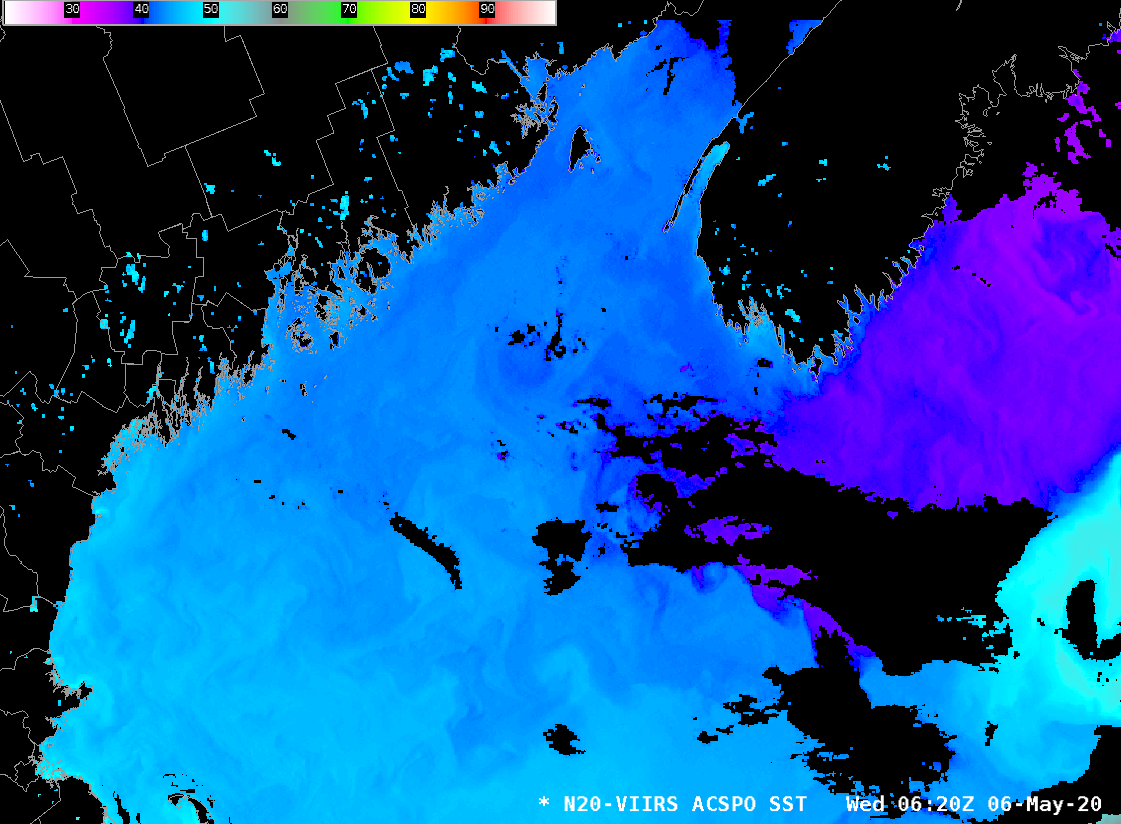
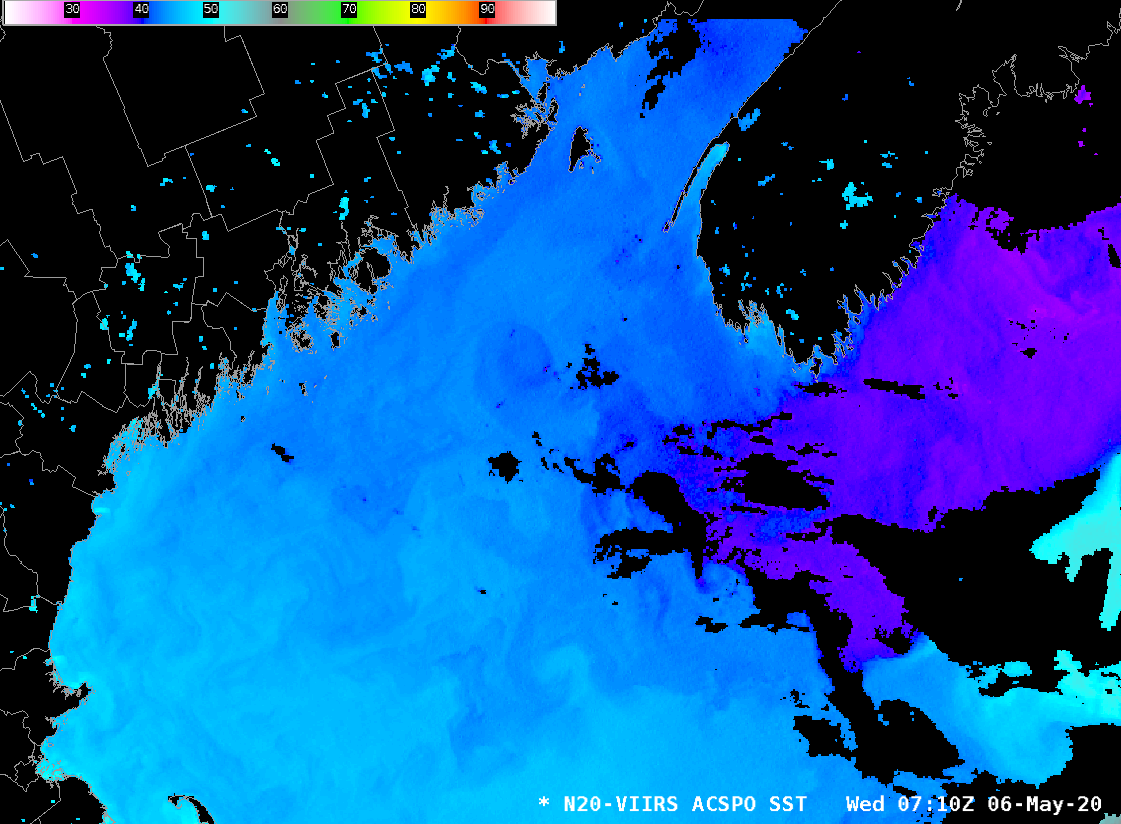
ACSPO SSTs at 0620 UTC and 0710 UTC on 6 May 2020 (Click to enlarge). The 0620 UTC image is actually from Suomi-NPP, not NOAA-20 as labeled.
Visible Infrared Imaging Radiometer Suite (VIIRS) data from Suomi NPP and NOAA-20 can be used to create accurate sea-surface temperature (SST) fields using the Advanced Clear-Sky Processor for Ocean (ACSPO) algorithms. The toggle above shows ACSPO SSTs over the Gulf of Maine from Suomi NPP (at 0620 UTC) and from NOAA-20 (at 0710 UTC) — orbital paths can be found here. Waters over the Gulf of Maine are relatively warm (around 41ºF) compared to the very cold waters (about 38ºF) southeast of Nova Scotia!
VIIRS’ view of the Gulf Stream is shown below — with the colorbar range from 59º to 86º F (compared to 20º to 100º for the Gulf of Maine image above). Warmest Gulf Stream waters are around 85º, but more uniformly near 82º F, with shelf waters near 74º F and tropical Atlantic waters near 77º.

ACSPO SSTs at 1855 UTC on 5 May 2020 (Click to enlarge).
VIIRS-based ACSPO SSTs are available via an LDM feed from CIMSS. Previous blog posts on ACSPO SSTs are here and here.
View only this post Read Less

![GOES-16 Dust RGB images, with and without plots of surface observations [click to play animation | MP4]](https://cimss.ssec.wisc.edu/satellite-blog/images/2020/05/200505_goes16_dustRGB_anim.gif)
![GOES-16 Mid-level Water Vapor images, with plot of pilot reports of turbulence, AIRMET boundaries, and NAM40 model 850 hPa winds [click to play animation | MP4]](https://cimss.ssec.wisc.edu/satellite-blog/images/2020/05/200505_goes16_waterVapor_pireps_850hpaWinds_anim.gif)
![Landsat-8 False Color RGB mage + Google Maps background [click to enlarge]](https://cimss.ssec.wisc.edu/satellite-blog/images/2020/05/200505_2149utc_landsat8_falseColorRGB_AK_anim.gif)
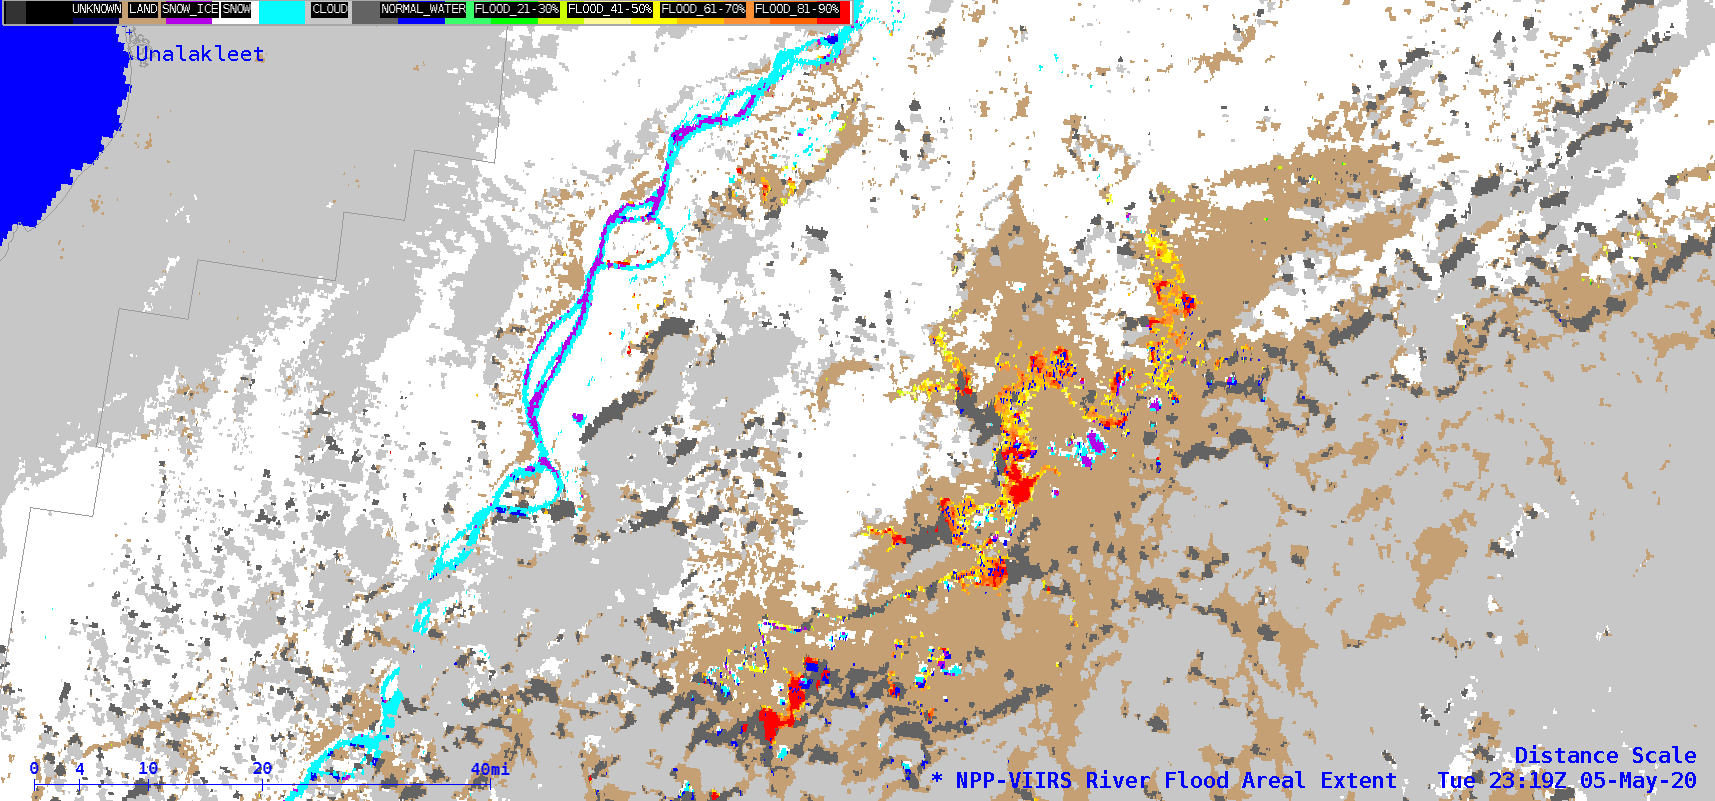
![Suomi NPP VIIRS River Flood Areal Extent product [click to enlarge]](https://cimss.ssec.wisc.edu/satellite-blog/images/2020/05/ak_viirs_flooding-20200505_231900.png)

![GOES-16 "Clean" Infrared Window (10.35 µm) images, with SPC Storm Reports plotted in cyan [click to play animation | MP4]](https://cimss.ssec.wisc.edu/satellite-blog/images/2020/05/200503_goes16_infrared_spcStormReports_mcs_anim.gif)
![NOAA-20 VIIRS Visible (0.64 µm) and Infrared Window (11.45 µm) images, with plots of available NUCAPS sounding points [click to enlarge]](https://cimss.ssec.wisc.edu/satellite-blog/images/2020/05/200503_1931utc_noaa20_viirs_visible_infrared_nucaps_mcs_anim.gif)
![Temperature and dew point profiles for the NUCAPS sounding point south-southeast of Jackson,Tennessee [click to enlarge]](https://cimss.ssec.wisc.edu/satellite-blog/images/2020/05/200503_19utc_nucaps_profile_kmkl.png)
