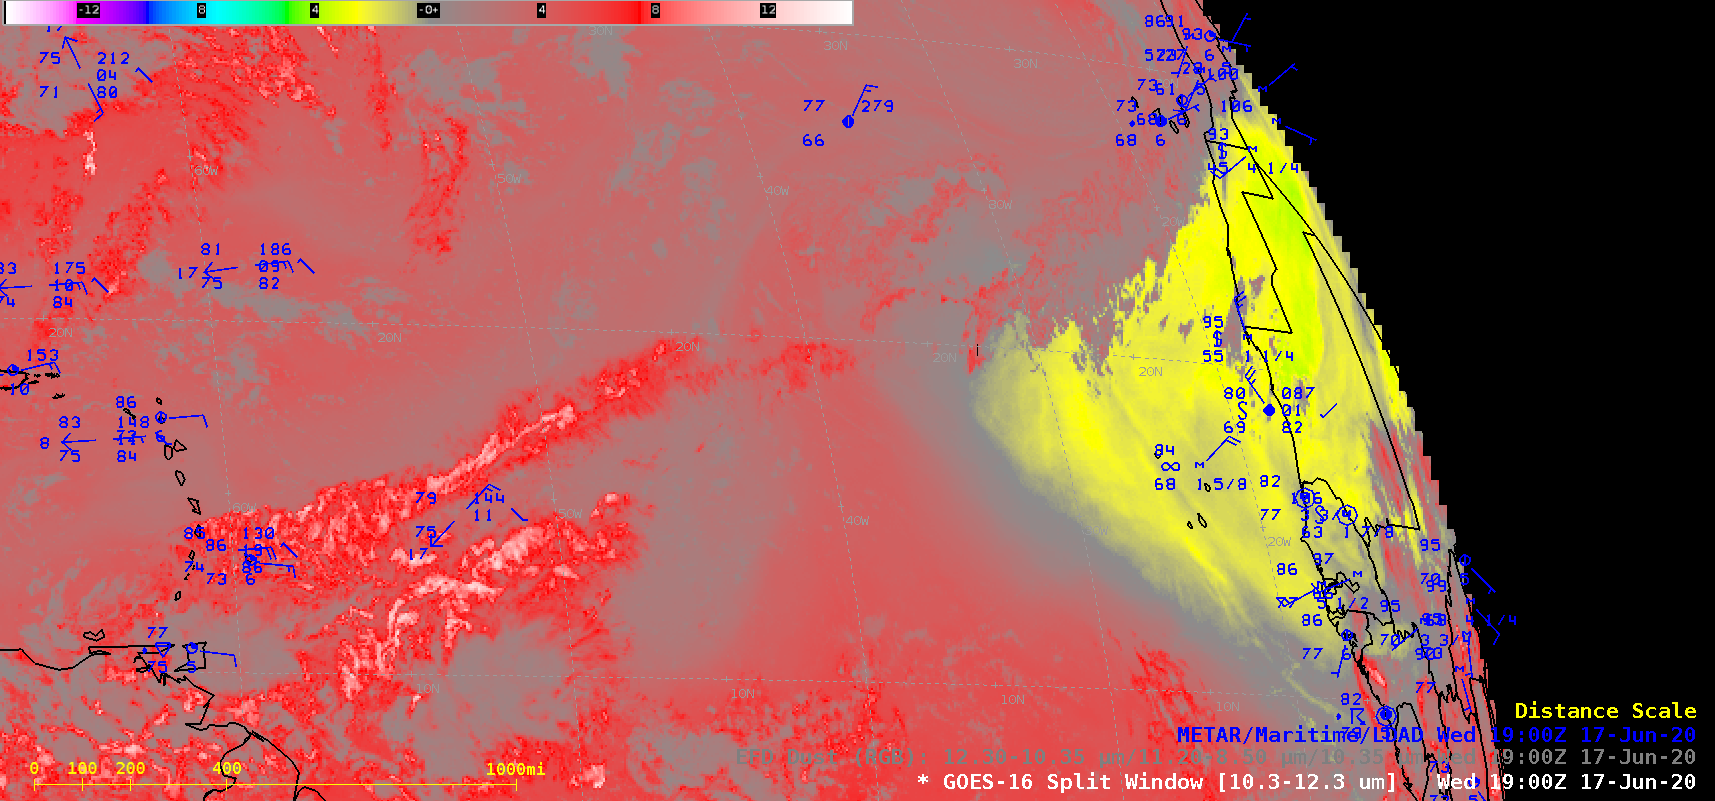
As a follow-up to this 15 June blog post, GOES-16 (GOES-East) Split Window Difference (10.3 µm – 12.3 µm) and Dust RGB (Red-Green-Blue) images (above) displayed signatures of another dense plume of Saharan Air Layer dust — which appeared as shades of yellow in the Split Window Difference images, and shades of magenta in the Dust RGB images — that was... Read More
![GOES-16 Split Window Difference (10.3 µm – 12.3 µm) and Dust RGB images, with surface reports plotted in blue [click to play animation | MP4]](https://cimss.ssec.wisc.edu/satellite-blog/images/2020/06/sal_swd-20200617_190019.png)
GOES-16 Split Window Difference (10.3 µm – 12.3 µm) and Dust RGB images, with surface reports plotted in blue [click to play animation | MP4]
As a follow-up to
this 15 June blog post, GOES-16
(GOES-East) Split Window Difference (
10.3 µm – 12.3 µm) and
Dust RGB (Red-Green-Blue) images
(above) displayed signatures of another dense plume of
Saharan Air Layer dust — which appeared as shades of yellow in the Split Window Difference images, and shades of magenta in the Dust RGB images — that was streaming westward off the coast of Africa and moving over the Cape Verde Islands and the eastern Atlantic Ocean from 0600 UTC on 17 June to 0020 UTC on 18 June 2020. This renewed pulse of dust was caused by an
anomalously strong easterly wind burst within the lower troposphere.
GOES-16 True Color RGB images created using Geo2Grid (below) showed the characteristic tan hues of the dust plume during daylight hours (0800-1850 UTC).
![GOES-16 True Color RGB images [click to play animation | MP4]](https://cimss.ssec.wisc.edu/satellite-blog/images/2020/06/GOES-16_ABI_RadF_true_color_2020169_162019Z.png)
GOES-16 True Color RGB images [click to play animation | MP4]
True Color RGB images from NOAA-20 and Suomi NPP as viewed using
RealEarth (below) provided views of the dust plume at 14 UTC and 15 UTC. Note that the core of the dust plume moved directly over the Cape Verde Islands.
![True Color RGB images from NOAA-20 and Suomi NPP [click to enlarge]](https://cimss.ssec.wisc.edu/satellite-blog/images/2020/06/200617_suomiNPP_noaa20_trueColorRGB_anim.gif)
True Color RGB images from NOAA-20 and Suomi NPP [click to enlarge]
Plots of surface report data from Sal, Cape Verde (GVAC) and Nauackchott, Mauritania (GQNO) are shown below. The surface visibility dropped below 1 mile at Sal, Cape Verde from 16-18 UTC — and along the coast of Africa at Nauackchott, Mauritania the arrival of the dry easterly winds was very evident in the sharp drop of dewpoint temperatures after 09 UTC.
![Plot of surface report data from Sal, Cape Verde [click to enlarge]](https://cimss.ssec.wisc.edu/satellite-blog/images/2020/06/200617_GVAC_SFCMG.GIF)
Plot of surface report data from Sal, Cape Verde [click to enlarge]
![Plot of surface report data from Nauackchott, Mauritania [click to enlarge]](https://cimss.ssec.wisc.edu/satellite-blog/images/2020/06/200617_GQNO_SFCMG.GIF)
Plot of surface report data from Nauackchott, Mauritania [click to enlarge]
===== 18 June Update =====
![GOES-16 True Color RGB images [click to play animation | MP4]](https://cimss.ssec.wisc.edu/satellite-blog/images/2020/06/GOES-16_ABI_RadF_true_color_2020170_162022Z.png)
GOES-16 True Color RGB images [click to play animation | MP4]
On the following day, GOES-16 True Color RGB images
(above) showed that the dust plume had moved a bit farther west and northwest. A longer 2-day (17-18 June) animation of GOES-16 Split Window Difference and Dust RGB images is shown below.
![GOES-16 Split Window Difference (10.3 µm – 12.3 µm) and Dust RGB images, with surface reports plotted in blue [click to play animation | MP4]](https://cimss.ssec.wisc.edu/satellite-blog/images/2020/06/sal_swd-20200618_190022.png)
GOES-16 Split Window Difference (10.3 µm – 12.3 µm) and Dust RGB images, with surface reports plotted in blue [click to play animation | MP4]
View only this post
Read Less
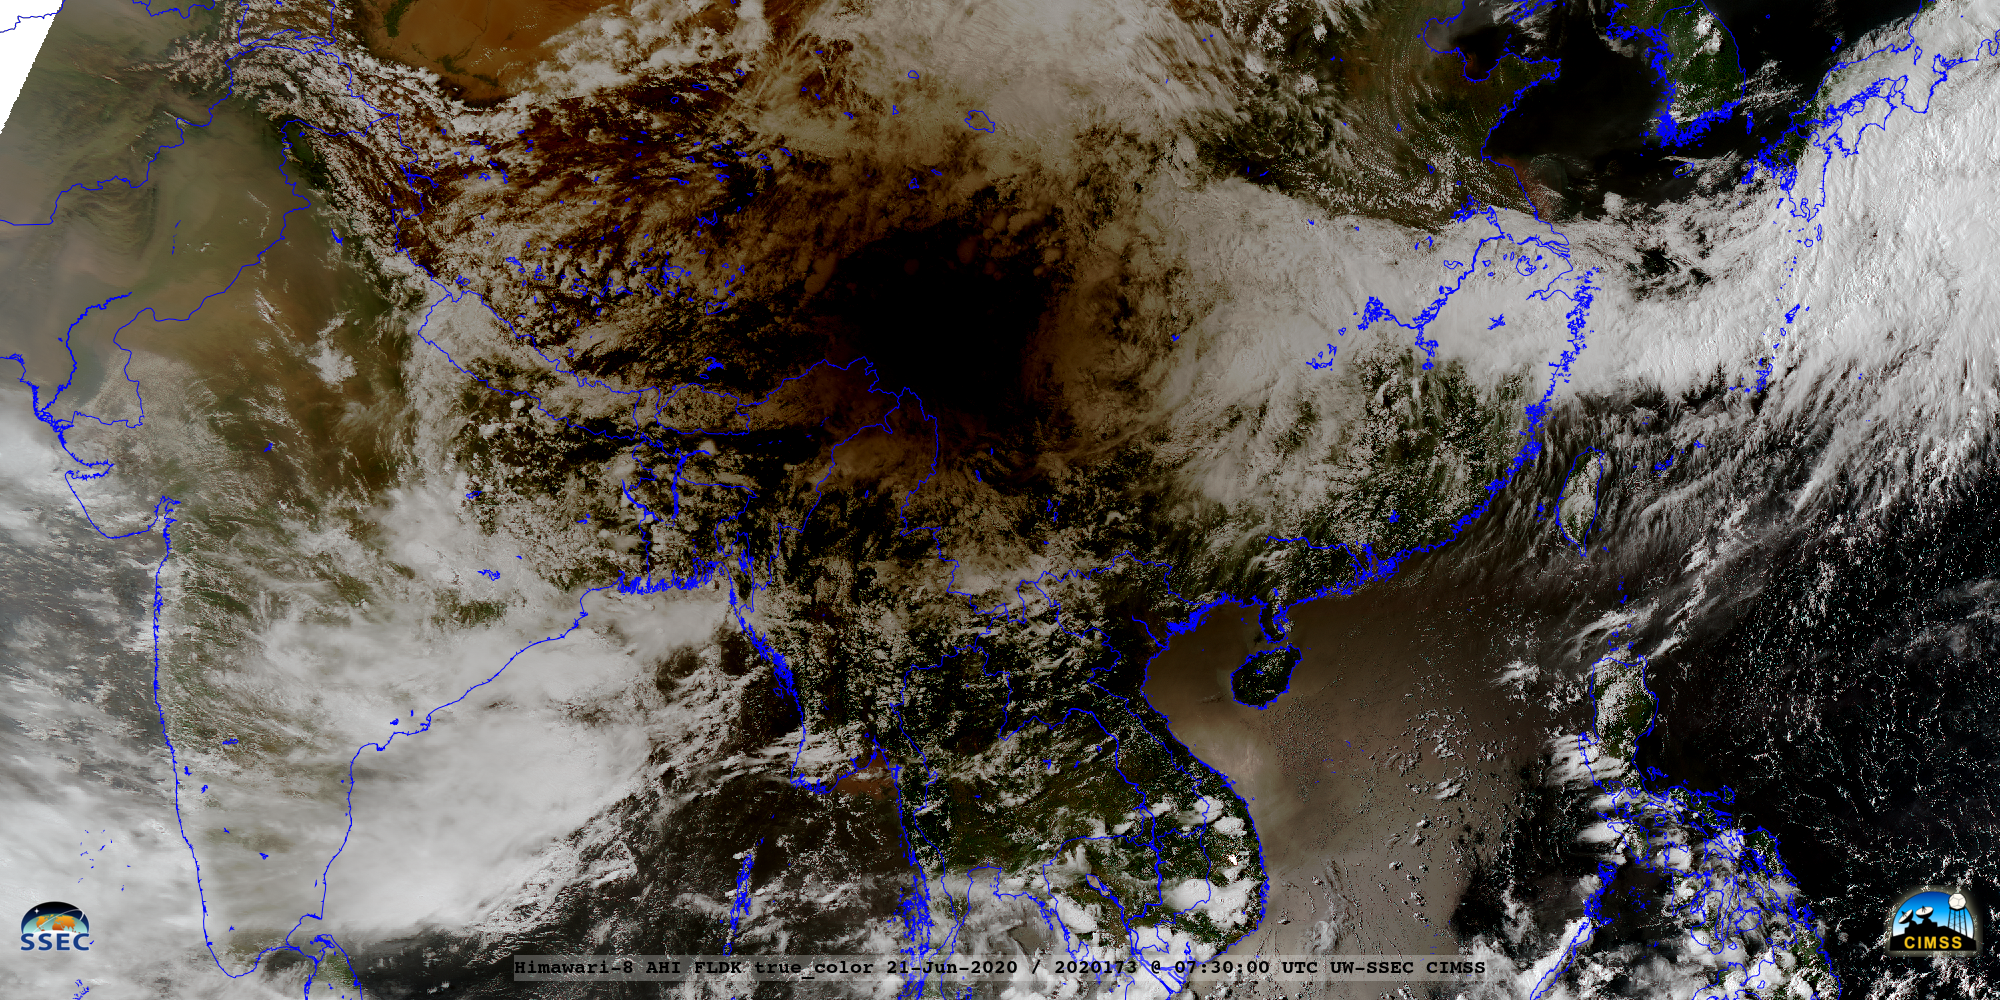
![Himawari-8 True Color RGB images [click to play animation | MP4]](https://cimss.ssec.wisc.edu/satellite-blog/images/2020/06/200621_himawari8_trueColorRGB_solar_eclipse_shadow_Asia_anim.gif)
![FY-2G Visible images [click to enlarge]](https://cimss.ssec.wisc.edu/satellite-blog/images/2020/06/200621_fy2g_visible_solar_eclipse_shadow_anim.gif)
![VIIRS Infrared Window (11.45 µm) images from NOAA-20 and Suomi NPP [click to enlarge]](https://cimss.ssec.wisc.edu/satellite-blog/images/2020/06/200620_noaa20_suomiNPP_viirs_infrared_American_Samoa_anim.gif)
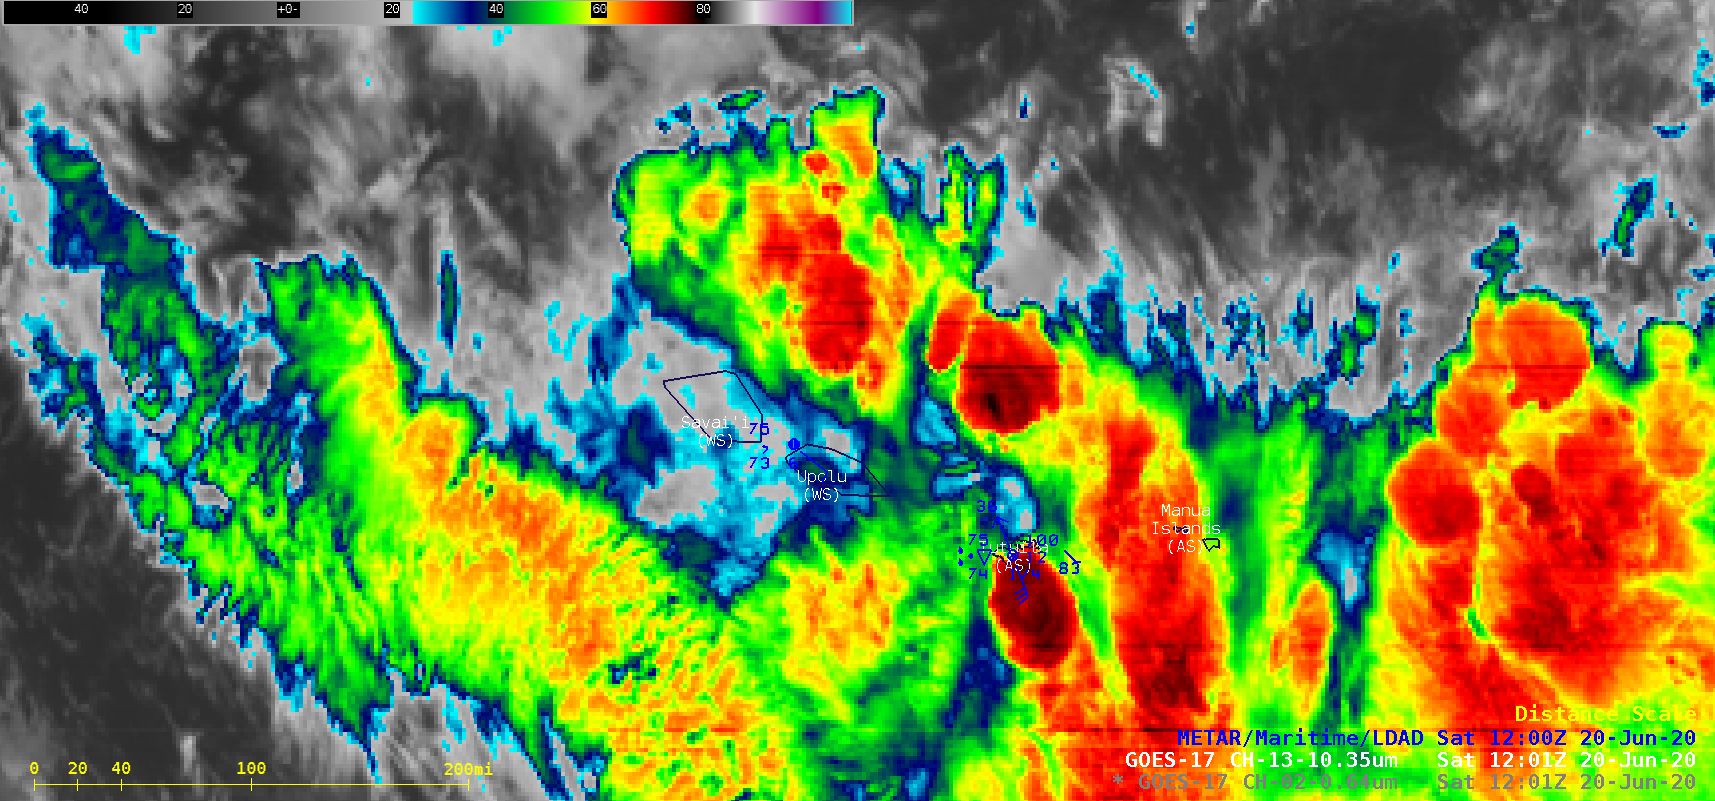
![GOES-17 "Clean" Infrared Window (10.35 µm) images [click to play animation | MP4]](https://cimss.ssec.wisc.edu/satellite-blog/images/2020/06/200620_goes17_infrared_American_Samoa_anim.gif)

![GOES-16 Split Window Difference (10.3 µm – 12.3 µm) and Dust RGB images, with surface reports plotted in blue [click to play animation | MP4]](https://cimss.ssec.wisc.edu/satellite-blog/images/2020/06/200617_goes16_splitWindowDifference_dustRGB_Saharan_Air_Layer_dust_anim.gif)
![GOES-16 True Color RGB images [click to play animation | MP4]](https://cimss.ssec.wisc.edu/satellite-blog/images/2020/06/200617_goes16_trueColorRGB_Saharan_Air_Layer_dust_anim.gif)
![GOES-16 True Color RGB images [click to play animation | MP4]](https://cimss.ssec.wisc.edu/satellite-blog/images/2020/06/200618_goes16_trueColorRGB_Saharan_Air_Layer_dust_anim.gif)
![GOES-16 Split Window Difference (10.3 µm – 12.3 µm) and Dust RGB images, with surface reports plotted in blue [click to play animation | MP4]](https://cimss.ssec.wisc.edu/satellite-blog/images/2020/06/200617_200618_goes16_splitWindowDifference_dustRGB_Saharan_Air_Layer_dust_anim.gif)
