The major Saharan Air Layer dust outbreak (previously discussed here and here) continued its westward progression — and on 21 June 2020, GOES-16 (GOES-East) Split Window Difference (10.3 µm – 12.3 µm) and Dust RGB images (above) showed signatures of the dust (shades of tan to light brown in Split Window Difference, and shades of... Read More
![GOES-16 Split Window Difference (10.3 µm – 12.3 µm) and Dust RGB images, with surface reports plotted in white [click to play animation | MP4]](https://cimss.ssec.wisc.edu/satellite-blog/images/2020/06/sal_swd-20200621_230022.png)
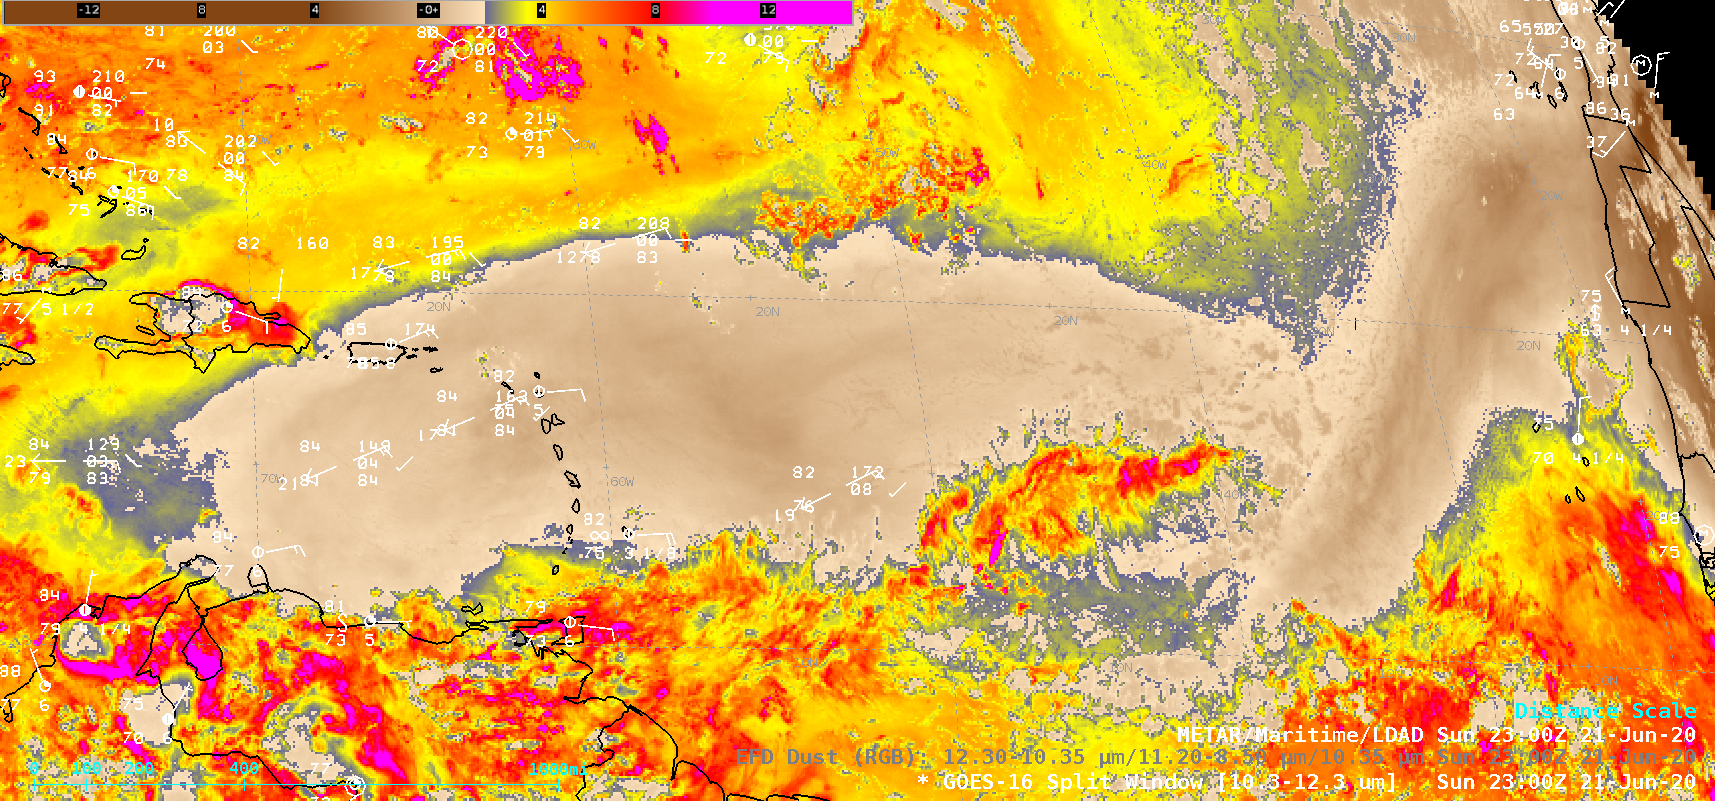
GOES-16 Split Window Difference (10.3 µm – 12.3 µm) and Dust RGB images, with surface reports plotted in white [click to play animation | MP4]
The major Saharan Air Layer dust outbreak (previously discussed
here and
here) continued its westward progression — and on 21 June 2020, GOES-16
(GOES-East) Split Window Difference (
10.3 µm – 12.3 µm) and
Dust RGB images
(above) showed signatures of the dust
(shades of tan to light brown in Split Window Difference, and shades of magenta in Dust RGB images) as it moved over the Lesser Antilles, the eastern Caribbean Sea and Puerto Rico. Surface reports at Port of Spain, Trinidad and Tobago (
plot |
data) indicated a drop in visibility below 1/2 mile for several hours, until some of the airborne dust was scavenged by convective precipitation; farther to the north, dust restricted the visibility to 3 miles at Barbados (
plot |
data). At San Juan, Puerto Rico (
plot |
data) the surface visibility only dropped to 7 miles, as most of dust remained aloft.
GOES-16 True Color RGB images created using Geo2Grid (below) showed the characteristic tan hues of the dust plume during daylight hours (1000-2200 UTC).
![GOES-16 True Color RGB images [click to play animation | MP4]](https://cimss.ssec.wisc.edu/satellite-blog/images/2020/06/GOES-16_ABI_RadF_true_color_2020173_210022Z.png)
GOES-16 True Color RGB images [click to play animation | MP4]
===== 22 June Update =====
![GOES-16 Split Window Difference (10.3 µm – 12.3 µm) and Aerosol Optical Depth images, with surface reports plotted in white [click to play animation | MP4]](https://cimss.ssec.wisc.edu/satellite-blog/images/2020/06/sal_swd-20200622_235022.png)
GOES-16 Split Window Difference (10.3 µm – 12.3 µm) and Aerosol Optical Depth images, with surface reports plotted in white [click to play animation | MP4]
On 22 June, GOES-16 Split Window Difference (10.3 µm – 12.3 µm) and Aerosol Optical Depth (AOD) images
(above) showed that the SAL dust had continued moving west, overspreading Puerto Rico, Hispaniola and much of the Caribbean Sea. Widespread AOD values of 1.0 to 1.8 were seen across that region.
A closer look at GOES-16 Split Window Difference and AOD images centered over Puerto Rico (below) revealed that the surface visibility was reduced to 3 miles at two sites in eastern Puerto Rico — and an AOD value of 2.0 was noted just south of San Juan TJSJ at 2201 UTC. The visibility was further reduced to 2-3 miles at nearby islands.
![GOES-16 Split Window Difference (10.3 µm – 12.3 µm) and Aerosol Optical Depth images, with surface reports plotted in white [click to play animation | MP4]](https://cimss.ssec.wisc.edu/satellite-blog/images/2020/06/sal_pr_aod-20200622_220119.png)
GOES-16 Split Window Difference (10.3 µm – 12.3 µm) and Aerosol Optical Depth images, with surface reports plotted in white [click to play animation | MP4]
GOES-16 True Color RGB images
(below) depicted the thick plume of dust.
![GOES-16 True Color RGB images [click to play animation | MP4]](https://cimss.ssec.wisc.edu/satellite-blog/images/2020/06/GOES-16_ABI_RadF_true_color_2020174_211022Z.png)
GOES-16 True Color RGB images [click to play animation | MP4]
A 9-day animation of a GOES-16 Split Window Difference “
Saharan Air Layer product” covering the period 13-22 June 2020
(below) displayed the westward progress of the SAL plume
(darker red to shades of white) across the Atlantic Ocean.
![GOES-16 Split Window Difference "Saharan Air Layer product", 13-22 June [click to play animation | MP4]](https://cimss.ssec.wisc.edu/satellite-blog/images/2020/06/200618_18z_sal.png)
GOES-16 Split Window Difference “Saharan Air Layer product”, 13-22 June [click to play animation | MP4]
===== 24 June Update =====
![GOES-16 True Color RGB (daytime) and Dust RGB (nighttime) images, 08-24 June [click to play MP4 animation]](https://cimss.ssec.wisc.edu/satellite-blog/images/2020/06/GOES-16_ABI_RadF_true_color_night_dust_2020176_160020Z.png)
GOES-16 True Color RGB (daytime) and Dust RGB (nighttime) images, 08-24 June (credit: Tim Schmit, ASPB/CIMSS) [click to play MP4 animation]
A 17-day animation of GOES-16 True Color RGB (daytime) and Dust RGB (nighttime) images during the period from 08-24 June
(above) showed that (1) the primary strong SAL dust plume eventually reached the Gulf of Mexico on 24 June, (2) a second SAL dust plume emerged off the northwest coast of Africa on 22-23 June, and (3) the Dust RGB only exhibited a strong signature
(brighter shades of magenta) for the most highly-concentrated areas of dust as they began to move westward off the coast of Africa — once the dust became more diffuse over the middle Atlantic, it lost a recognizable signature in the Dust RGB (while still retaining a good daytime signature in the True Color RGB).
A 12-day animation of GOES-16 Split Window Difference “Saharan Air Layer product” covering the period 13-24 June (below) also displayed the primary SAL plume reaching the Gulf of Mexico on 24 June, in addition to the secondary SAL plume emerging on 22-23 June.
![GOES-16 Split Window Difference "Saharan Air Layer product", 13-24 June [click to play animation | MP4]](https://cimss.ssec.wisc.edu/satellite-blog/images/2020/06/20200619.21.NWAtlantic.SALgoes16split.png)
GOES-16 Split Window Difference “Saharan Air Layer product”, 13-24 June [click to play animation | MP4]
View only this post
Read Less
![Plot of rawinsonde data from Nome, Alaska [click to enlarge]](https://cimss.ssec.wisc.edu/satellite-blog/images/2020/06/200627_PAOM_RAOBS.GIF)
![Topography, Suomi NPP VIIRS Visible (0.64 µm) and GOES-17 "Red" Visible (0.64 µm) images around 1320 UTC [click to enlarge]](https://cimss.ssec.wisc.edu/satellite-blog/images/2020/06/200627_1320utc_topo_suomiNPP_goes17_visible_AK_anim.gif)
![Topography, Suomi NPP VIIRS Infrared Window (11.45 µm) and GOES-17 "Clean" Infrared Window (10.35 µm) images around 1320 UTC [click to enlarge]](https://cimss.ssec.wisc.edu/satellite-blog/images/2020/06/200627_1320utc_topo_suomiNPP_goes17_infrared_AK_anim.gif)
![Topography, Suomi NPP VIIRS Visible (0.64 µm) and GOES-17 "Red" Visible (0.64 µm) images around 2140 UTC [click to enlarge]](https://cimss.ssec.wisc.edu/satellite-blog/images/2020/06/200627_2140utc_topo_suomiNPP_goes17_visible_AK_anim.gif)
![Topography, Suomi NPP VIIRS Infrared Window (11.45 µm) and GOES-17 "Clean" Infrared Window (10.35 µm) images around 2140 UTC [click to enlarge]](https://cimss.ssec.wisc.edu/satellite-blog/images/2020/06/200627_2140utc_topo_suomiNPP_goes17_infrared_AK_anim.gif)
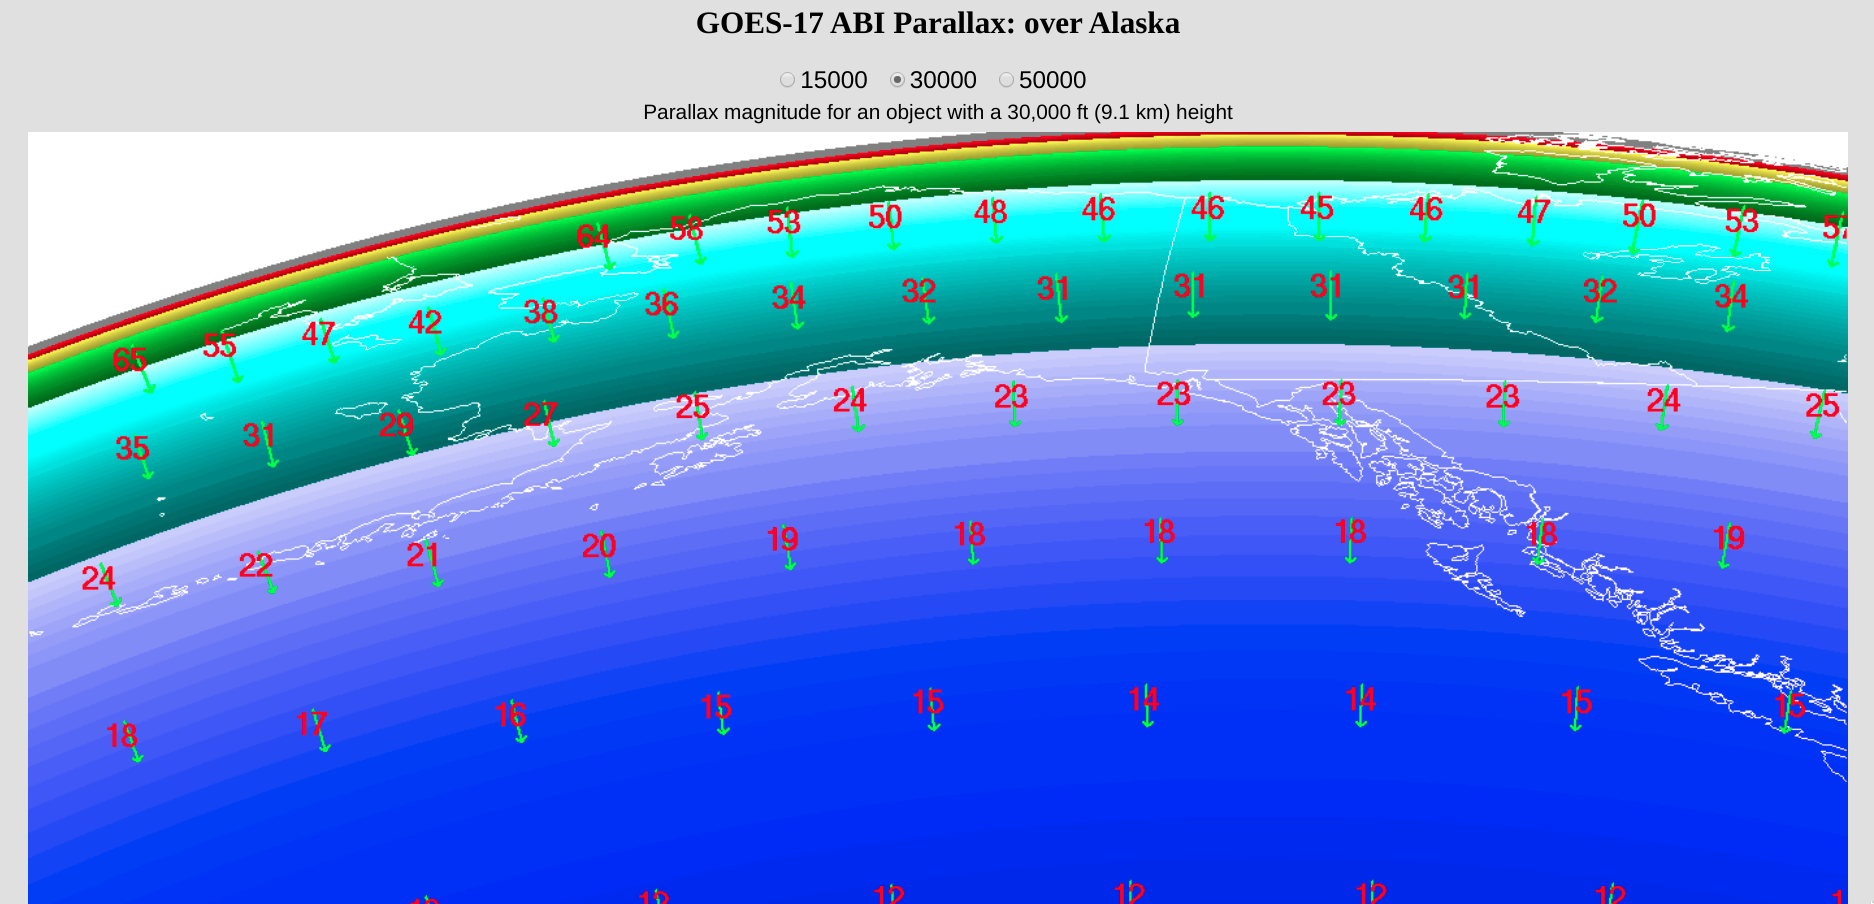
![Plots of GOES-17 parallax correction vectors and displacements (in km) for a 30,000-foot (9.1 km) cloud feature at select points over the Alaska region [click to enlarge]](https://cimss.ssec.wisc.edu/satellite-blog/images/2020/06/200627_parallax_AK.png)
![GOES-16 “Red” Visible (0.64 µm) images [click to play animation | MP4]](https://cimss.ssec.wisc.edu/satellite-blog/images/2020/06/200625_goes16_HudsonBay_ice_fast_anim.gif)
![Ice concentration departure from normal [click to enlarge]](https://cimss.ssec.wisc.edu/satellite-blog/images/2020/06/200622_HudsonBay_ice_concentration_departure.gif)
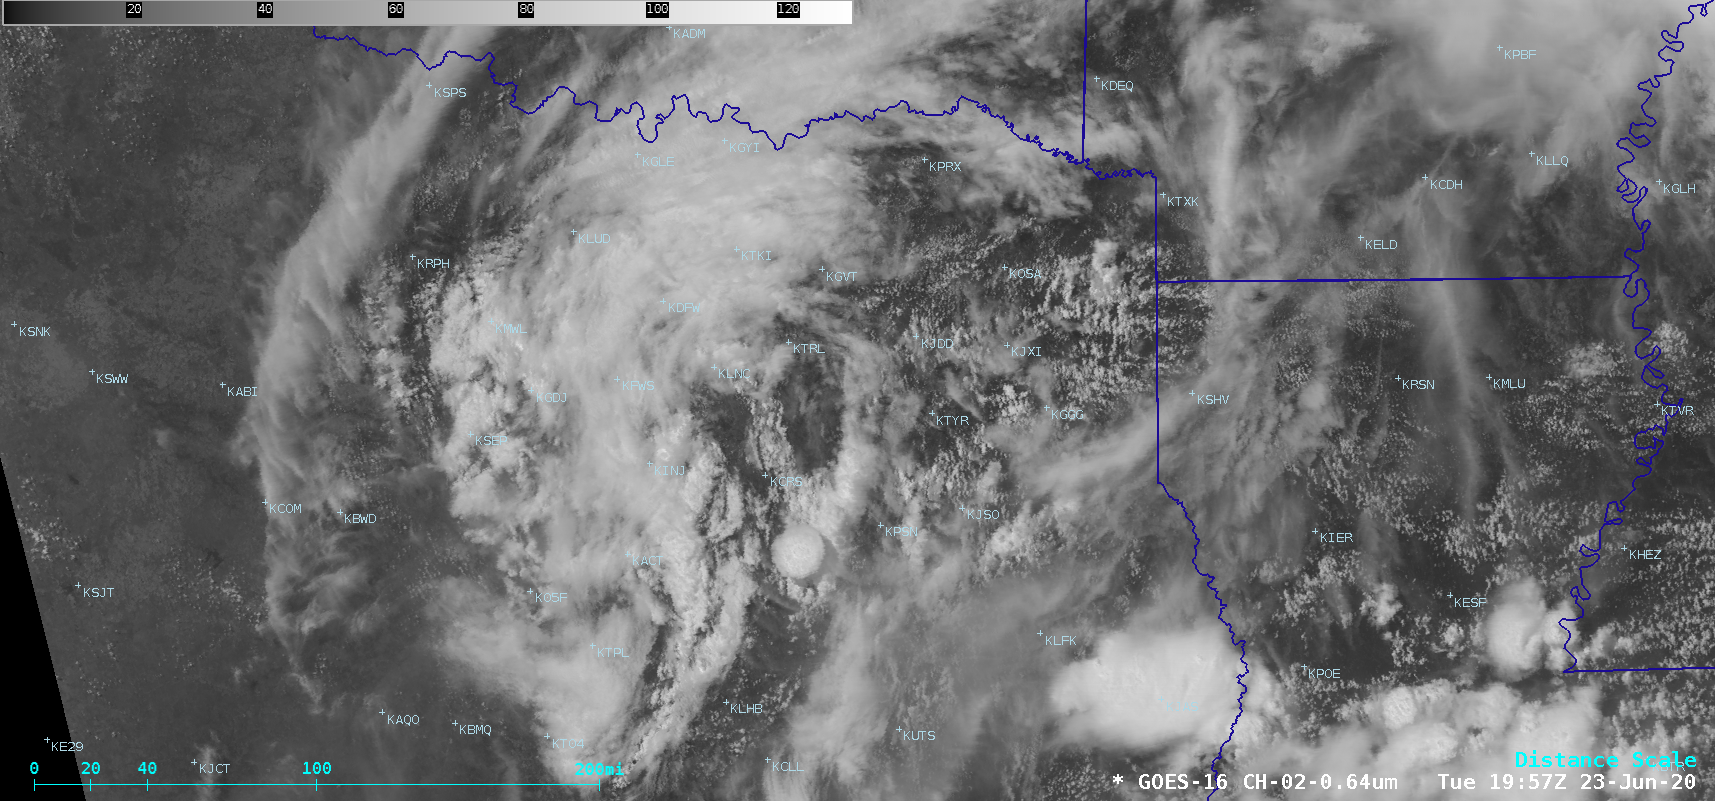
![GOES-16 “Red” Visible (0.64 µm) images [click to play animation | MP4]](https://cimss.ssec.wisc.edu/satellite-blog/images/2020/06/200623_goes16_visible_TX_mcv_anim.gif)
![SPC Mesoscale Analysis of 850/500 hPa wind shear and Most Unstable Lifted Index at 13 UTC [click to enlarge]](https://cimss.ssec.wisc.edu/satellite-blog/images/2020/06/200623_13utc_spc_mesoanalysis.png)
![SPC Mesoscale Analysis of 850/500 hPa wind shear and Most Unstable Lifted Index at 16 UTC [click to enlarge]](https://cimss.ssec.wisc.edu/satellite-blog/images/2020/06/200623_16utc_spc_mesoanalysis.png)
![GOES-16 Split Window Difference (10.3 µm – 12.3 µm) and Dust RGB images, with surface reports plotted in white [click to play animation | MP4]](https://cimss.ssec.wisc.edu/satellite-blog/images/2020/06/200621_goes16_splitWindowDifference_dustRGB_Saharan_Air_Layer_dust_anim.gif)
![GOES-16 True Color RGB images [click to play animation | MP4]](https://cimss.ssec.wisc.edu/satellite-blog/images/2020/06/200621_goes16_trueColorRGB_Saharan_Air_Layer_dust_anim.gif)
![GOES-16 Split Window Difference (10.3 µm – 12.3 µm) and Aerosol Optical Depth images, with surface reports plotted in white [click to play animation | MP4]](https://cimss.ssec.wisc.edu/satellite-blog/images/2020/06/200622_goes16_splitWindowDifference_aerosolOpticalDepth_Saharan_Air_Layer_dust_anim.gif)
![GOES-16 Split Window Difference (10.3 µm – 12.3 µm) and Aerosol Optical Depth images, with surface reports plotted in white [click to play animation | MP4]](https://cimss.ssec.wisc.edu/satellite-blog/images/2020/06/200622_goes16_splitWindowDifference_aerosolOpticalDepth_Saharan_Air_Layer_dust_Puerto_Rico_anim.gif)
![GOES-16 True Color RGB images [click to play animation | MP4]](https://cimss.ssec.wisc.edu/satellite-blog/images/2020/06/200622_goes16_trueColorRGB_Saharan_Air_Layer_dust_anim.gif)
![GOES-16 Split Window Difference "Saharan Air Layer product", 13-22 June [click to play animation | MP4]](https://cimss.ssec.wisc.edu/satellite-blog/images/2020/06/200613_200622_goes16_Saharan_Air_Layer_anim.gif)
